Indirect Exchange Interaction in Fully Metal-Semiconductor Separated SWCNTs Revealed by ESR
Abstract
The ESR response from highly metal-semiconductor(M-SC) separated SWCNTs for temperatures between 0.39 and 200 K is characteristically different for the two systems. The signal originates from defect spins but interaction with free electrons leads to a larger line width for M tubes. The latter decreases with increasing whereas it increases with for SC tubes. The spins undergo a ferromagnetic phase transition below around 10 K. Indirect exchange is suggested to be responsible for the spin-spin interaction, supported by RKKY interaction in the case of M tubes. For SC tubes spin-lattice relaxation via an Orbach process is suggested to determine the line width.
pacs:
73.22.-f;72.25.RbI Introduction
Electron spin resonance from single-walled carbon nanotubes (SWCNTs) has been a subject of extensive studies in the recent past, starting in 1997 Petit et al. (1997) and continuing until most recently a set of new papers Havlicek et al. (2010); Dinse et al. (2010); Zaka et al. (2010) appeared. In several of the early papers response from localized and itinerant spins was claimed as well as from various collective phenomena such as ferromagnetic or antiferromagnetic ordering or even superconductivity Likodimos et al. (2007); Corzilius et al. (2007); Galambos et al. (2009). The discussion about the observation of spins from itinerant electrons entered a new state with the publication of a recent theoretical work Dora et al. (2008) where electrons in a Tomonaga-Luttinger liquid state (TLL) were postulated to have an extremely broad ESR absorption line, even at temperatures below 4 K. The TLL state was well demonstrated for SWCNT from photo emission. It is a consequence of the quasi-onedimensional (1D) nature of the electrons in the tubes Ishii et al. (2003); Rauf et al. (2004).
The discovery of possibilities to quantitatively separate semiconducting (SC) and metallic (M) tubes Yanagi et al. (2008); Arnold et al. (2006) can be considered as a crucial step forward to tackle the problem, particularly if tubes were grown from non-magnetic catalysts Ruemmeli et al. (2007). This finding allowed for the possibility to study the ESR response separately in the two types of tubes. Preliminary results were published recently for SC tubes immersed into ethanol as a tube carrying medium Havlicek et al. (2010). However, in this case the solvent was interacting with the tubes obscuring intrinsic properties.
Here we report on ESR from fully M-SC separated SWCNTs grown from a non-magnetic PtRhRe catalyst. Even though no response from itinerant electrons could be detected down to 0.39 K significant differences in the ESR response were observed for the first time from the localized spins in the two tube systems. The differences were particularly obvious for the line widths which were strongly enhanced at low temperatures for the M tubes and decreased with increasing . In contrast, for the SC tubes, they were rather small at low temperatures but increased with . For the ESR susceptibility a Curie-Weiss behavior was observed with ferromagnetic coupling. At a ferromagnetic state is obtained, without contributions of magnetic components. Interaction of the spins is suggested to be by indirect exchange with an additional contribution of long range RKKY type interaction for the M tubes. In the latter this interaction also dominates the line width whereas for the SC tubes the increase of the line width with is ascribed to spin lattice relaxation via an Orbach process.
II Experimental
Single-walled carbon nanotubes with an average diameter of 1.6 nm were grown by laser ablation using a PtRhRe catalyst and M-SC separated to better than 97% as described previously Ruemmeli et al. (2007). Bulk properties of the samples were characterized by transmission electron microscopy (TEM), X-ray diffraction and transport measurements. TEM revealed a clear bundling of the tubes with a bundle size between 20 and 100 nm and tapered ends Sup . From X-ray diffraction a bundle peak at nm-1 was observed with slightly smaller and larger values for the M and for the SC tubes, respectively. This corresponds to an average tube diameter of 1.6 nm in agreement with the observation from TEM. Conductivity measurements revealed an almost temperature independent resistivity for the metallic tubes, following weak localization behavior. This indicates good contact and evidences some 3D character of the metallic tubes. In contrast, SC tubes exhibited an exponential increase of the resistivity with decreasing temperature following a variable range hoping behavior Sup . ESR experiments were performed at X-band frequencies of 9.45 GHz (39.07 eV) in the temperature range between 1.5 and 200 K with low power (30 dB) to avoid saturation. For temperatures between 0.39 and 1.7 K a cylinder resonator was used built into a He3 refrigerator and a superconducting magnet. In this case microwave power was limited to 45 dB.
Samples from 500 ∘C vacuum annealed tubes were prepared as bucky paper with high (Pt1) and low (Pt2) thickness compared to the skin depth of the microwaves. The latter was evaluated from the dc conductance. The tubes were inserted into a standard ESR quartz tube and pumped to high vacuum before measurement.
Spin concentration was estimated by a comparison to a ”strong pitch” calibration sample from Bruker. This sample consists of pitch embedded into a KCl matrix with a standardized spin concentration of 1.2 spins per cm length in a standard 4 mm ESR quartz tube with 3 mm inner diameter. Calibration was performed at 1.5 K where the peak to peak line width is 1.7 G. Considering the reduction of cavity quality factor by the nanotube samples we obtained 7.5 spins/g for the M tubes and 12 spins/g for the SC tubes. Within experimental error this is the same spin concentration and results in 1 spin per 1000 carbon atoms.
The ESR spectra were fitted considering a dispersive signal contribution. Samples with high thickness behave textbook like as the M tubes show a well expressed asymmetry in the absorption whereas the absorption in the SC tubes remains nearly symmetric. Results for low temperature recording are depicted in Fig. 1.
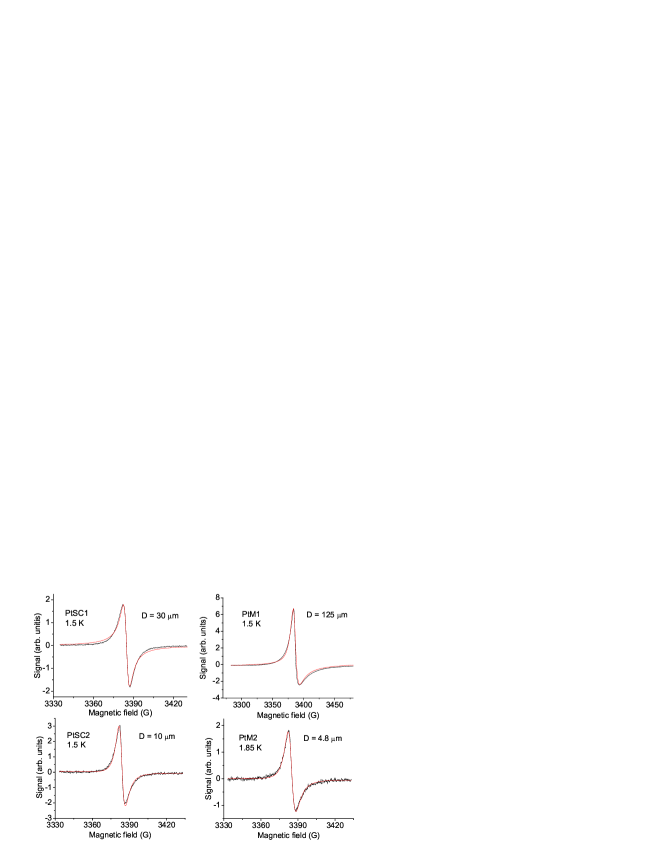
For the case of the low thickness samples the ESR response is nearly symmetric. The remaining slight asymmetry was found to be well represented by the derivative of a Dysonian line shape of the form
| (1) |
where and are fitting parameters describing the signal amplitude, the resonance field, the line width, and a phase angle. For a contribution of the dispersive component of the susceptibility to the absorption line appears. Since the analysis for the low thickness samples is much simpler, in the following results are reported only for the latter. The ESR susceptibility was evaluated as .
III Results
According to Ref. Dora et al., 2008 the line widths for the itinerant electrons should be around 1000 G at 4 K for a TLL parameter . For a very small decrease of due to bundling of only metallic tubes and for temperatures as low as 0.4 K the line width should reduce to about 50 G, well within the range observable in our experiment. However, even at the lowest temperature of 0.39 K no extra broad line is observed with a free carrier response signature.
For the narrow lines depicted in Fig. 1 we observe characteristic differences in the line widths between SC and M tubes with respect to their dependence on temperature and with respect to their values at low temperatures. The line width increases with decreasing temperature for the M tubes but decreases for the SC tubes. As a consequence, at low temperatures the line width for the former is significantly larger as compared to the line width of the latter. Examples are depicted in Fig. 2. The increase of the line width for low temperatures is particularly dramatic for the M tubes before annealing.

The fit with an inverse power law yields 0.205 for the exponent and a constant residual line width of 3.3 G. The observed increase in line width (excess line width) is more than a factor two from its residual width. For the annealed tubes a similar power law behavior is obtained for high and intermediate temperatures but the increase stops and levels off around 10 K. In all cases the negative exponent is 0.2.
For SC tubes the line width increases with temperature at least for high and intermediate temperatures, first in a quasi-linear manner with a trend to saturate for higher temperatures. The total increase amounts up to 2 G for the temperature range under study. The initial slope varies with sample treatment and decreases with tube annealing. At temperatures between 20 and 30 K the line width becomes almost temperature independent with a noticeable re-increase for and a peak around 8 K. Due to the strong signal at these temperatures the line widths were determined with a RMS error of G which is approximately two times the size of the red dots in the insert.
In addition to the line width, the magnetic susceptibility was evaluated from the ESR signal as a function of temperature. The temperature dependence of exhibits a maximum value around 10 K but is like for higher temperatures. As a consequence at high temperatures the lines are hardly detectable but recorded with high precision at low temperatures. Figure 3 depicts examples for
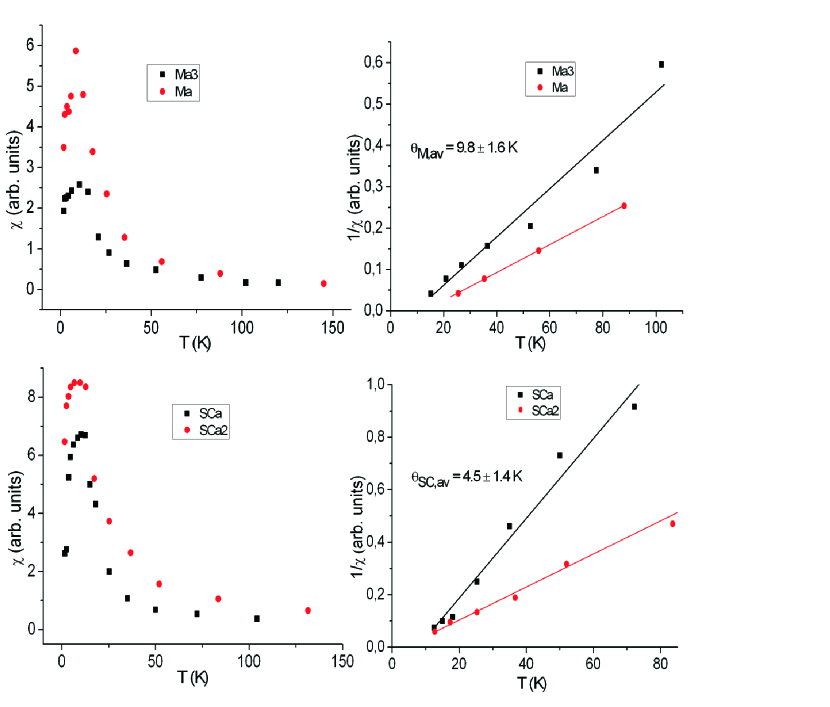
M and SC tubes. The peak in the ESR susceptibility coincides well with the leveling of the line width for the M samples at low temperatures and with the re-increase of the line width for the SC samples. Using a Curie-Weiss law for as renders the spin-spin interaction as ferromagnetic rather than anti-ferromagnetic as the linear regressions in Fig. 3 intersect the temperature axis at positive values. The observed peak in suggests a transition to a ferromagnetic state with a finite distribution of transition temperatures.
IV Discussion
The lack of the observation of additional ESR contributions from free carriers is consistent with a full TLL state of the electrons even in the bundled metallic tubes with relaxed 1D character. It is also consistent with recent experiments from photo emission where for metallic tubes TLL signatures were observed in the spectral function Ayala et al. (2009).
The localized spins can be assigned to various defects such as single bonded covalent functionalization or defects on or inside the tubes. The defect concentration is similar to the value of /C reported in Corzilius et al. (2007) from magnetic measurements but considerably higher than values of given in Likodimos et al. (2007). The high spin concentration observed here is not surprising since both, purification and separation introduce defects. This is also evidenced from Raman scattering which revealed an increase of the D/G ratio by 33% from 0.06 to 0.08 (515 nm laser) for the SC tubes and by 57.5% from 0.13 to 0.21 (647 nm laser) for the M tubes. The defects are in strong interaction with the tubes leading in general to similar behavior for M and SC tubes. However, as far as transition temperatures and spin relaxation are concerned, significant differences are observed.
Wave functions of the defect spins are in general spread out over a considerable number of hexagonal cells. For example, DFT calculations for hydrogen bonded to a small capped (3,3) SWCNT yield a spin distribution over 5 and 8 hexagons in axial and radial direction, respectively Bulusheva . This provides the possibility of exchange interaction in spite of the large distance between spins. The interaction can be particularly enhanced by the indirect exchange mechanism across the carbon lattice, and, for M tubes, by interaction with free carriers according to the RKKY mechanism.
In the suggested ferromagnetic state we do not observe the ESR response from the magnetically ordered spins, since the easy axes of the magnetic regions are randomly oriented following the random orientation of the nanotubes or bundles of nanotubes. Magnetic anisotropy can be traced back to an anisotropic curvature perpendicular and parallel to the tube axis and the concomitant anisotropy in the SO coupling.
Magnetic properties from defects in carbon systems have been reported in several publications Makarova (2004); Wang et al. (2009); Yang and Wu (2009). Apparently transversal extension of the tubes or the 3D nature of the bundles is enough to allow ferromagnetic or anti-ferromagnetic interaction but it is not enough to suppress TLL nature of the electrons. A decrease of spin susceptibility at low temperatures was recently reported for unseparated SWCNTs Likodimos et al. (2007) and speculated to originate from a spin gap opening or from an anti-ferromagnetic ordering of the defect spins as it was suggested for the magnetic behavior of nanohorns Garaj et al. (2000). The low concentration of defect spins in Likodimos et al. (2007) may be a problem for such interpretation. In contrast, in our case with the much higher spin concentration the temperature dependence of the inverse susceptibility exhibits clear ferromagnetic coupling for SC and M tubes. Indications for weak ferromagnetism in small parts of nanotube samples were also reported from magnetization measurements of SWCNT with high concentration of defect spins in Corzilius et al. (2007). However in this case it was suggested that ferromagnetic ordering occurs in metallic tubes only.
In the M tubes the transition temperatures as evaluated from the linear regressions are almost a factor two higher than in the SC tubes. This is suggested to be due to the additional spin-spin interaction mediated by the free carriers. In low dimensional electronic systems the RKKY type interaction is very efficient since it extends as where is the distance between two spins and is the dimension of the system Shenoy (2005). In SWCNT it is particularly interesting since Fermi wave vectors can be either zero or where is the NT translation vector Costa et al. (2005). As a consequence the RKKY interaction is not oscillatory, at least not for tubes with . RKKY interaction is likewise important for the transition temperatures and for the line widths and was shown in Costa et al. (2005) to decrease with increasing .
The increase of the line width with increasing temperature for SC tubes suggests spin-lattice interaction (SLI) as the relevant process for spin relaxation. SLI is usually mediated by either a direct process which is linear in , a Raman process which goes with a high power of or an Orbach process. Since only the latter exhibits saturation with it is natural to invoke it for the description of the experiments. On the other hand, the re-increase of the line width at very low temperatures indicates additional contributions. Since it is suggestive that this increase is related to the ferromagnetic phase transition with the statistically distributed transition temperatures a Gaussian temperature dependence is appropriate for its description. Considering homogeneous and inhomogeneous contributions we describe the line width obtained from the Dysonian fits as
| (2) |
where is a Lorentzian type homogeneous line width following an Orbach relaxation and considers the line width from Gaussian fluctuations and possible concomitant variations of values. is a temperature independent background line width. This Pythagorayan addition of line width components is a commonly used approximation which mimics a folding procedure Simon et al. (2006). and in the expression for the Orbach process are the energetic distance to a higher electronic state for the spin excitation, and a scaling prefactor. , , and are the parameters of the distribution from inhomogeneous fluctuations. As shown in Fig. 4, Eq. 2 provides a very good representation of the experiments with , , , , and as parameters.
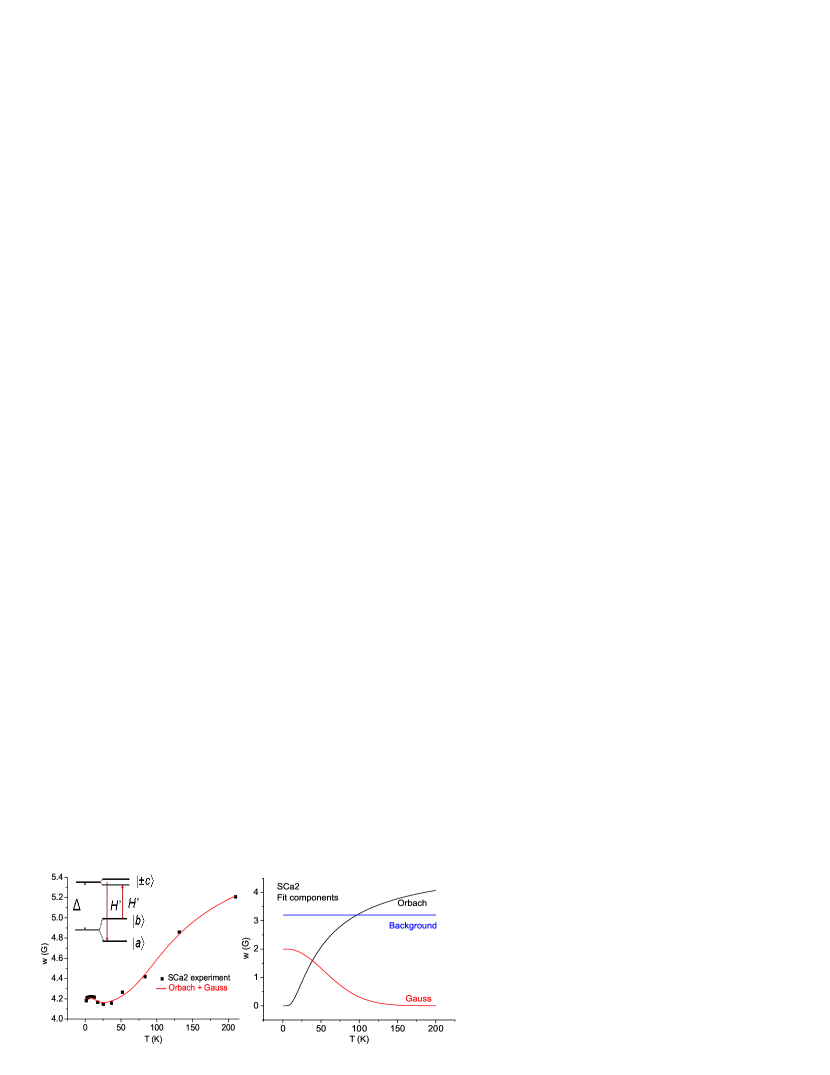
From the parameter values in the caption of Fig. 4 the excitation energy is 3.8 meV (45.1 K). Applying the same fitting procedure to the other sample gave very similar values. was in particular found to be 44.5 K for the second sample.
In the case of a spin-lattice relaxation by an Orbach process the excited spin state and the ground state are coupled by a perturbation Hamiltonian to an intermediate split off electronic state to which spins are excited before relaxation. A scheme of this process is depicted in Fig. 4. The perturbation is in general phononic or vibronic. In the original work of R. Orbach Orbach (1961) the extra electronic state came from crystal field splitting. Due to the large number of defects in our samples a rather large number of possible excited states can be expected which supports a spin-lattice relaxation by an Orbach process.
The increase of the line widths for K in the SC tubes is the signature of fluctuations when approaching the phase transition. The values from Fig. 3 for K are in good agreement with the value of K used for the fit in Fig. 4. Fluctuations along with structural phase transitions are well known to broaden ESR lines. Blinc et al. (1996); Mozurkewich et al. (1984) This broadening often follows a power law of the form with of the order of 1. The fit depicted in the insert of Fig. 2 yields , slightly smaller than expected. This deviation is very likely due to the statistical distribution of with the concomitant flattening of the slope.
For the metallic tubes a decrease of line width with increasing temperature is observed. Since in our case the defect spins are localized and do not show activated behavior motional narrowing can be ruled out for an explanation. Increasing and even diverging line widths for decreasing were also reported for metallic spin systems which undergo a transition to a spin glass Mozurkewich et al. (1984). However, in this case line widths of the order of 100 G are expected. Since this is not observed here we are left with an indirect exchange mechanism as responsible for the increase of line with decreasing temperature. In the metallic tubes this mechanism has a strong contribution from the free carrier RKKY interaction which increases with decreasing temperature as described above.
One may certainly ask why spin lattice interaction e.g. in the form of an Orbach process is not active for the metallic tubes. Such behavior can indeed not be ruled out. As it would partly compensate the negative temperature coefficient observed for the metallic tubes such relaxation would result in an even stronger decrease of line width with temperature for the metallic tubes.
The surprise in the results for the line width concerns not only the different temperature dependence but even more the considerably larger line width for the M tubes as compared to the SC tubes at low temperatures. This, together with the different temperature dependence, leads to a crossover of the line widths with increasing temperature. While the ratio between the excess line width for the M tubes and for the SC tubes is 3.2 at 1.5 K on average, it is only 0.6 at 200 K. This is suggested to be a consequence of the increasing spin-lattice interaction with increasing and the simultaneous decrease of the line width due to the decreasing RKKY interaction.
V Summary
In summary we have shown that M-SC separated SWCNT reveal significant differences in their ESR response. While for both types of tubes a ferromagnetic temperature dependence is observed for the spin susceptibility, the latter levels off at characteristic temperatures and eventually decreases. This is interpreted as a transition to a ferromagnetic state. The difference in the transition temperature for the two tube systems is suggested to originate from an RKKY type interaction of the spins with the free carriers in the M tubes. Even more dramatic is the observed difference in the temperature dependence of the line width for the two tube systems. It decreases with increasing temperature for the M tubes but increases for the SC tubes. Since the behavior of the metallic tubes follows the temperature dependence of the RKKY interaction the latter is suggested to be responsible for the line narrowing. In contrast, for SC tubes an Orbach type relaxation process is suggested to be responsible for the broadening of the ESR lines width increasing temperature.
Acknowledgements.
Valuable discussions with B. Dora, F. Simon, M. Mehring, and K. Baberschke are gratefully acknowledged. Work supported by FWF projects P17345 and P20550, A and DFG project RU1540/8-1, D.References
- Petit et al. (1997) P. Petit, E. Jouguelet, J. E. Fischer, A. G. Rinzler, and R. E. Smalley, Phys. Rev. B 56, 9275 (1997).
- Havlicek et al. (2010) M. Havlicek, W. Jantsch, M. Ruemmely, R. Schoenfelder, K. Yanagi, Y. Miyata, H. Kataura, F. Simon, H. Peterlik, and H. Kuzmany, phys. stat. sol. B 247, 2851 (2010).
- Dinse et al. (2010) K. P. Dinse, J. van Tol, A. Ozarowski, and B. Corzilius, Applied Magnetic Resonance 37, 595 (2010).
- Zaka et al. (2010) M. Zaka, Y. Ito, H. L. Wang, W. J. Yan, A. Robertson, Y. M. A. Wu, M. H. Rummeli, D. Staunton, T. Hashimoto, J. J. L. Morton, et al., Acs Nano 4, 7708 (2010).
- Likodimos et al. (2007) V. Likodimos, S. Glenis, N. Guskos, and C. L. Lin, Physical Review B 76, 075420 (2007).
- Corzilius et al. (2007) B. Corzilius, K.-P. Dinse, J. van Slageren, and K. Hata, Phys. Rev. B 75, 235416 (2007).
- Galambos et al. (2009) M. Galambos, G. Fabian, F. Simon, L. Ciric, L. Forro, L. Korecz, A. Rockenbauer, J. Koltai, V. Zolyomi, A. Rusznyak, et al., phys. stat. sol. B 246, 2760 (2009).
- Dora et al. (2008) B. Dora, M. Gulácsi, J. Koltai, V. Zólyomi, J. Kürti, and F. Simon, Phys. Rev. Lett. 101, 106408 (2008).
- Ishii et al. (2003) H. Ishii, H. Kataura, H. Shiozawa, H. Yoshioka, H. Otsubo, Y. Takayama, T. Miyahara, S. Suzuki, Y. Achiba, M. Nakatake, et al., Nature 426, 540 (2003).
- Rauf et al. (2004) H. Rauf, T. Pichler, M. Knupfer, J. Fink, and H. Kataura, Phys. Rev. Lett. 93, 096805 (2004).
- Yanagi et al. (2008) K. Yanagi, Y. Miyata, and H. Kataura, Applied Physics Express 1, 034003 (2008).
- Arnold et al. (2006) M. Arnold, A. Green, J. Hulvat, S. Stupp, and M. Hersam, Nature Nanotech. 1, 60 (2006).
- Ruemmeli et al. (2007) M. H. Ruemmeli, M. Loffler, C. Kramberger, F. Simon, F. Fulop, O. Jost, R. Schonfelder, A. Gruneis, T. Gemming, W. Pompe, et al., Journal of Physical Chemistry C 111, 4094 (2007).
- (14) Supplementary information can be obtained from aps link.
- Feher and Kip (1955) G. Feher and A. Kip, Phys. Rev. 98, 337 (1955).
- Ayala et al. (2009) P. Ayala, Y. Miyata, K. De Blauwe, H. Shiozawa, Y. Feng, K. Yanagi, C. Kramberger, S. R. P. Silva, R. Follath, H. Kataura, et al., Physical Review B 80, 205427 (2009).
- (17) L. G. Bulusheva, private Communication, 2010.
- Makarova (2004) T. Makarova, Semiconductors 38, 615 (2004).
- Wang et al. (2009) Y. Wang, Y. Huang, Y. Song, X. Zhang, Y. Ma, J. Linag, and Y. Chen, Nano Lett. 9, 220 (2009).
- Yang and Wu (2009) Y. Yang and G. Wu, Acs Nano 3, 1646 (2009).
- Garaj et al. (2000) S. Garaj, L. Thien-Nga, R. Gaal, L. Forro, K. Takahashi, F. Kokai, M. Yudasaka, and S. Iijima, Phys. Rev. B 62, 17115 (2000).
- Shenoy (2005) V. B. Shenoy, Phys. Rev. B 71, 125431 (2005).
- Costa et al. (2005) A. T. Costa, D. F. Kirwan, and M. S. Ferreira, Phys. Rev. B 72, 085402 (2005).
- Simon et al. (2006) F. Simon, H. Kuzmany, B. Náfrádi, T. Fehér, L. Forró, F. Fülöp, A. Jánossy, A. Rockenbauer, L. Korecz, F. Hauke, et al., Phys. Rev. Lett. 97, 136801 (2006).
- Orbach (1961) R. Orbach, Proc. Royal. Soc. , Ser. A 264, 458 (1961).
- Blinc et al. (1996) B. Blinc, D. Arcon, P. Cevc, D. Mihailovic, and A. Omerzu, Appl. Mag. Reson. 11, 203 (1996).
- Mozurkewich et al. (1984) G. Mozurkewich, J. H. Elliott, M. Hardiman, and R. Orbach, Phys. Rev. B 29, 278 (1984).