Submillimeter observations of millimeter bright galaxies discovered by the South Pole Telescope
Abstract
We present APEX SABOCA and LABOCA observations of 11 representative examples of the rare, extremely bright (), dust-dominated millimeter-selected galaxies recently discovered by the South Pole Telescope (SPT). All 11 sources are robustly detected with LABOCA with , approximately an order of magnitude higher than the canonical submillimeter galaxy (SMG) population. Six of the sources are also detected by SABOCA at , with the detections or upper limits providing a key constraint on the shape of the spectral energy distribution (SED) near its peak. We model the SEDs of these galaxies using a simple modified blackbody and perform the same analysis on samples of SMGs of known redshift from the literature. These calibration samples inform the distribution of dust temperature for similar SMG populations, and this dust temperature prior allows us to derive photometric redshift estimates and far infrared luminosities for the sources. We find a median redshift of , higher than the inferred for the normal SMG population. We also derive the apparent size of the sources from the temperature and apparent luminosity, finding them to appear larger than our unlensed calibration sample, which supports the idea that these sources are gravitationally magnified by massive structures along the line of sight.
Subject headings:
galaxies: high-redshift — galaxies: formation — galaxies: evolution — galaxies: starbursts — submillimeter — gravitational lensing1. Introduction
The first extragalactic surveys at submillimeter (submm) wavelengths carried out at with SCUBA (Holland et al., 1999) over a decade ago (Smail et al., 1997; Hughes et al., 1998; Barger et al., 1998) discovered a population of optically faint, submm bright galaxies. Multi-wavelength follow-up campaigns subsequently established that the bright () submillimeter galaxies (SMGs) represent a significant population of distant () dust-enshrouded, far-infrared (FIR) luminous () galaxies, in which large gas reservoirs () are being turned into stars at a prodigious rate (yr-1; e.g., Neri et al. 2003; Chapman et al. 2005).
Ground-based extragalactic surveys conducted at wavelengths of have identified a few hundred sources in total sky area of (e.g., Coppin et al., 2006; Perera et al., 2008; Austermann et al., 2009; Weiß et al., 2009). The brightest sources found in these surveys have , and a source density of . A handful of brighter sources have been discovered in small area surveys by targeting massive galaxy clusters and thereby taking advantage of gravitational magnification. For example, ultra-bright SMGs have been found behind the Bullet cluster (1ES 065756, , ; Wilson et al. 2008; Gonzalez et al. 2010; Johansson et al. 2010) and MACS J2135010217 (SMM J21350102, hereafter called the “Eyelash”, , ; Swinbank et al. 2010; Ivison et al. 2010; Danielson et al. 2011). Sources lensed by intervening galaxies have also been found serendipitously (, ; Lestrade et al. 2010; Ikarashi et al. 2011). These objects are important as gravitationally magnified windows on the obscured star formation process in the early universe, but large samples of these rare objects cannot be obtained in surveys of a few square degrees.
The landscape of submm surveys has changed dramatically in the last few years with the advent of observatories capable of mapping large areas of sky simultaneously in multiple bands. The Balloon-borne Large-Aperture Submillimeter Telescope (BLAST – (Pascale et al., 2008)) mapped over at , and (Devlin et al., 2009), identifying many dusty galaxies and providing photometric redshift estimates. The South Pole Telescope (SPT) surveyed to mJy depth at 1.4 and in 2008, discovering a population of rare () and extremely bright ( at ) dusty galaxies (Vieira et al., 2010). Early results from the Science Demonstration Phase (SDP) observations of the Herschel Astrophysical Terahertz Large Area Survey (H-ATLAS – Eales et al. 2010) and the Herschel Multi-tiered Extragalactic Survey (HerMES – Oliver et al. 2010) – each surveying tens of deg2 at , and – also identified analogous populations of bright sources (Negrello et al., 2010; Conley et al., 2011).
In this paper, we denote SMGs with , primarily discovered in the large area surveys described above, as “ultra-bright” SMGs. These sources appear more luminous than galaxies identified in smaller surveys (); we refer to the fainter, un-lensed, population as “normal” SMGs. The apparent luminosity of the ultra-bright SMGs, and their excess relative to the expected high-flux number counts of normal SMGs, is a strong indication that a significant fraction are strongly lensed with magnification factors of order to (Blain, 1996; Blain et al., 1999; Negrello et al., 2007; Hezaveh & Holder, 2011).
Measuring this lensing amplification – using high-resolution follow-up imaging and detailed lens modeling – is one of the keys to determining the intrinsic properties of these ultra-bright SMGs and their place in the overall scheme of galaxy evolution. The other key, which we focus on in this work, is determining their redshifts. Recent “blind” CO line searches, i.e., without prior optical/near-IR spectroscopy, with the Zpectrometer (Frayer et al., 2011) on the Green Bank Telescope and Z-Spec (Bradford et al., 2009) on the Caltech Submillimeter Observatory yielded redshifts in the range for five ultra-bright H-ATLAS sources (Frayer et al., 2011; Lupu et al., 2010). At present, robust spectroscopic redshifts have been published for ten such ultra-bright SMGs – discovered either from the ground or with Herschel – although several more sources from H-ATLAS and HerMES have now been spectroscopically confirmed (Harris et al., 2012). The bulk of these lie within the the observed redshift range of normal, radio-identified SMGs (, Chapman et al., 2005), which may in part be due to the frequency coverage of Zpectrometer and Z-Spec favoring CO detections. The redshift of the single ultra-bright SMG published to date was made using the IRAM PdBI WideX correlator (Cox et al., 2011). A large overlap between the SPT and Herschel sources is expected, but the longer SPT selection wavelength () does predict a broader redshift range than the -selected Herschel sources. The SPT may also be sensitive to a population of cooler sources that are invisible to the shorter-wavelength Herschel selection. The large SPT survey area (, compared to the and that H-ATLAS and HerMES cover) ensures the identification of the rarest and most highly magnified objects in the sky.
In this paper we present the first and maps of a subset of 11 SPT sources. In §2 the SABOCA and LABOCA observations and data reduction are outlined. In §3.1 and 3.2 we describe the submm maps, source morphology, and fluxes, while in §3.3 and 3.4 we fit spectral energy distributions (SEDs), derive photometric redshifts, FIR luminosities, and dust temperatures based on the SEDs. Finally, in §4 we discuss the derived properties of SPT sources, including their redshifts, and the implications these findings have. Throughout, we adopt a flat cosmology with , and (Spergel et al., 2003).
2. Observations and data reduction
2.1. South Pole Telescope Selection
The SPT (Carlstrom et al., 2011), a 10-meter off-axis Gregorian design with a field of view, has been surveying the mm-wave sky with unprecedented sensitivity and angular resolution since its commissioning in 2007. The SPT is located within of the geographical South Pole. At an altitude of above sea level, the South Pole is one of the premier locations for mm-wave astronomy. The high altitude and low temperatures ensure an atmosphere with low water-vapor content and excellent transparency. Meanwhile, the location at the Earth’s rotational axis allows 24-hour access to the target fields.
The first receiver mounted on the SPT is a camera consisting of 840 transition-edge-sensor bolometers, optimized for fine-scale anisotropy studies of the cosmic microwave background (CMB) and the discovery of distant massive galaxy clusters through the thermal Sunyaev-Zel’dovich (SZ) effect (Sunyaev & Zeldovich, 1972). The 840 bolometers are split into six wedges each containing 140 detectors. In 2008 (the season during which the SPT data in this work was taken), the array consisted of a single wedge, three wedges, and two wedges. The wedge did not produce science-quality data, but the and wedges performed to specification, resulting in r.m.s. survey depths of approximately at and at . The 10-meter primary mirror of the SPT results in beam sizes (FWHM) of approximately at and at . The camera was upgraded to provide sensitivity in all three bands for observations starting in 2009. The SPT-SZ survey was completed in all three bands in November 2011.
The data reduction pipeline applied to the SPT data is described in Vieira et al. (2010, hereafter V10). Briefly, the SPT time-ordered data from every working detector are calibrated and bandpass filtered, one or more common modes are removed from the data of all the detectors on a given wedge, and the data from all detectors in a given wavelength band are co-added into a map using inverse-noise weighting.
Sources are identified in SPT maps as described in V10. Objects are identified by first convolving the single-band map with a matched filter (e.g., Haehnelt & Tegmark, 1996) that de-weights noise and astrophysical signals on large scales and maximizes sensitivity to point-like objects, then searching the filtered map for high-significance peaks. Sources are then cross matched between the 1.4 and catalogs, and their fluxes are deboosted according to the method detailed in Crawford et al. (2010). Sources detected in SPT maps are classified as dust-dominated or synchrotron-dominated based on the ratio of their flux in the and bands. Approximating the spectral behavior of sources between and as a power law, , we estimate the spectral index for every source and use as the dividing line between dust- and synchrotron-dominated populations, thereby removing all flat spectrum radio quasars from the sample (see V10 for details). We apply an additional selection on the sample by imposing a cut on sources found in the Infrared Astronomy Satellite Faint-Source Catalog (IRAS-FSC, Moshir et al., 1992). This corresponds to cutting out sources with , which should remove any source at from this sample. Absolute calibration for both the and bands is derived from the CMB and the calibration uncertainty is , as described in Vieira et al. (2010).
For the study presented here, 11 sources from of 2008 survey data were imaged at and . Their fluxes range from to and approximate a flux limited sample. The sources are listed with their full source names in Table 1; throughout the paper we refer to them by their truncated coordinates (e.g., SPT-S J2332275358.5 becomes SPT 233253).
2.2. APEX submm continuum imaging
The submm observations presented in this paper were carried out at and with the Submillimeter Apex BOlometer CAmera (SABOCA) and the Large Apex BOlometer CAmera (LABOCA) at the Atacama Pathfinder EXperiment (APEX).111APEX is a collaboration between the Max-Planck Institute für Radioastronomie, the European Southern Observatory, and the Onsala Space Observatory. The sources observed and their coordinates are given in Table 1.
LABOCA is a 295-element bolometer array (Siringo et al. 2009) with an field-of-view and a measured angular resolution of (FWHM). The center frequency of LABOCA is () with a passband FWHM of . The measured noise performance for these observations was .
SABOCA is a 39-element transition edge sensor (TES) bolometer array (Siringo et al. 2010) with a field-of-view and a measured angular resolution of (FWHM). The center frequency of SABOCA is () with a passband FWHM of . The measured noise performance for these observations was .
SABOCA and LABOCA observations of seven of our sources were carried out during Max-Planck observing time in May 2010 (PI: Weiß). A further four sources were observed in August 2010 under ESO programs 086.A-1002A and 087.A-0968A (PI: Greve). This brings the total number of sources presented in this paper to 11. All SABOCA observations were obtained in excellent weather conditions (precipitable water vapor, , less than ). The LABOCA observations of all targets were done in good weather conditions ().
Typical integration times for LABOCA were on-source resulting in an r.m.s. level of , adequate to detect any of the SPT sources at , assuming a point-like source (with respect to the LABOCA beam) and an SED similar to other SMGs.
At the time of our observations, we had no information on source redshifts, SED shapes, or resolved structure, all of which can dramatically vary the expected flux density for a given flux density. The SABOCA observations therefore targeted a fixed r.m.s. of (3 h on-source). At this noise level we expected a 5- detection for a typical redshift of , assuming an unresolved point source. For sources that were not detected at this noise level we increased the integration time up to 5 h on-source, yielding a r.m.s. of , which should detect a typical source out to approximately .
Mapping was performed using the raster–spiral mode (Siringo et al., 2009) for both bolometer arrays. This mode yields map sizes slightly larger than the field of view of the arrays ( and for SABOCA and LABOCA respectively). The SABOCA maps are thus well matched to the SPT resolution (FWHM 1′) and positional uncertainty of the SPT source ().
Calibration was achieved through observations of Mars, Uranus, and Neptune as well as secondary calibrators and was found to be accurate within and at and , respectively. The atmospheric attenuation was determined via skydips every hours as well as from independent data from the APEX radiometer which measures the line of sight water vapor column every minute. Focus settings were determined typically once per night and checked during sunrise. Pointing was checked on nearby quasars and found to be stable within 3″ r.m.s.
The data were reduced using the Bolometer Array analysis software (BoA) reduction package (Schuller et al., 2010). The time-ordered data undergo flat fielding, calibration, opacity correction, correlated noise removal on the full array as well as on groups of bolometers related by the wiring and in the electronics, flagging of unsuitable data (bad bolometers and/or data taken outside reasonable telescope scanning velocity and acceleration limits), as well as de-spiking. Each reduced scan was then gridded into a spatial intensity and weighting map. Weights are calculated based on the r.m.s. of each time series contributing to a certain grid point in the map. Individual maps were co-added with inverse variance weighting. The resulting map was used in a second iteration of the reduction to flag those parts of the time streams with significant source signal. This guarantees that the source fluxes are not affected by filtering and baseline subtraction. For sources that remained undetected at we flagged a region with radius centered on the LABOCA position in the time streams.
2.3. Spitzer-IRAC imaging
Mid-infrared Spitzer/Infrared Array Camera (IRAC) imaging was obtained on 2009 August 02 as part of a larger Spitzer program (PID 60194; PI Vieira) to follow up bright submm galaxies identified in the SPT survey. The on-target observations consisted of and dithered exposures at and , respectively. A large dither pattern was used for the exposures, and a medium dither pattern was used at . This scheme was designed to provide imaging sufficiently deep to detect even very distant galaxies, while also providing a minimal level of sensitivity at to furnish infrared colors for low-redshift sources nearby.
The data were reduced following the methods described in Ashby et al. (2009). The corrected Basic Calibrated Data (cBCD) frames were modified individually to eliminate column pull-down artifacts, and treated to remove residual images arising from prior observations of bright sources. The resulting pre-processed frames were then mosaiced with standard outlier rejection techniques using MOPEX under the control of IRACproc (Schuster et al., 2006) to create two mosaics covering the field. The final mosaics were generated with 086 pixels, i.e., pixels subtending a solid angle equal to half that of the native IRAC pixels. The field covered with at least ten exposures is roughly 6′ wide, centered on the SPT position. In this work, we show only the images.
2.4. Spectroscopic Redshifts
To date, spectroscopic redshifts have been obtained for two sources in this sample. SPT 053850 has a redshift of , derived from ionized silicon (Si iv 1400Å) emission in an optical spectrum with VLT/X-SHOOTER (284.A-5029; PI:Chapman) and carbon monoxide CO(7–6) and CO(8–7) with APEX/Z-Spec (086.A0793 and 087.A0815; PI: De Breuck, and 086.F9318 and 087.F9320; PI: Greve). Multiple source images surrounding a low-redshift elliptical galaxy are resolved in high-resolution imaging with the Submillimeter Array (SMA) (2009A-S076, PI: Marrone). The foreground lens has a measured spectroscopic redshift of . A paper detailing these measurements and providing detailed characterization of this source (including lens modeling) is in preparation (Bothwell et al.).
SPT 233253 has a redshift of , derived from Ly and ionized carbon (C iv 1549Å) in an optical spectrum with VLT/FORS2 from program (285.A5034; PI: Chapman) and carbon monoxide CO(7–6) with APEX/Z-Spec. The redshift of the foreground lens, which is a cluster of galaxies, is . A paper providing a full characterization of this source, including unambiguous evidence for it being lensed by the cluster of galaxies, is in preparation (Vieira et al.).
3. Results
3.1. Submillimeter maps and source morphology
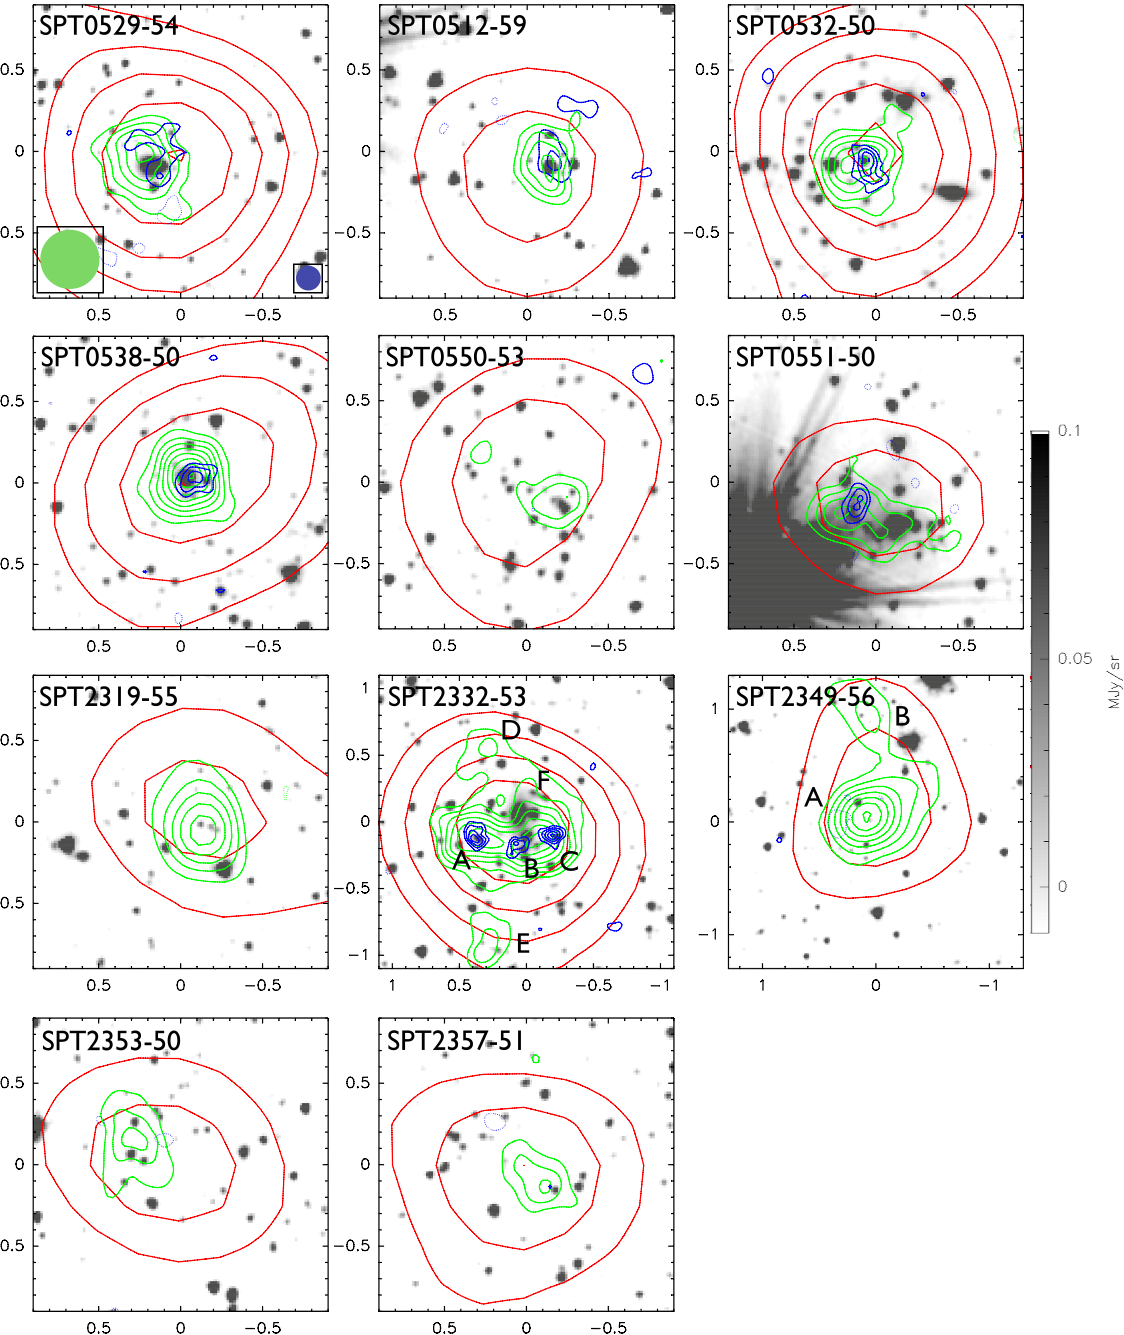
Fig. 1 shows Spitzer/IRAC postage-stamp images of our 11 sources, with the SPT , LABOCA and SABOCA signal-to-noise ratio () contours overlaid.
All sources are detected at at . For 6 of the 11 sources, the in the SABOCA images near the LABOCA positions (Fig. 1). A further source (SPT 235751) is marginally detected at as it shows a emission peak at the LABOCA centroid position. Of the remaining four sources, two (SPT 234956 and SPT 231955) are tentatively detected () in the SABOCA map, while two show no signs of a SABOCA detection.
All sources, with the exception of SPT 052954 and SPT 233253, are consistent with being point sources in both the LABOCA and SABOCA maps. Two LABOCA sources are associated with SPT 234956 (A and B, see Fig. 1), each is consistent with a point source. Inserting point sources into the bolometer time-streams and subjecting them to the same reduction steps as detailed in §2.2 reproduces the observed maps very well.
SPT 052954 appears to be resolved at , with emission extending to the north and east. This three-component substructure is enclosed within the area of a LABOCA beam, and the source appears point-like at .
For SPT 233253 the LABOCA emission is clearly extended in the east-west direction, spanning . At the source resolves into three separate, unresolved blobs. We denote these sources A, B and C, going from east to west (see Fig. 1). Two additional sources (D and E) are seen in the LABOCA map to the north and south of the central east-west source. Subtracting point sources at the A, B, and C positions in the LABOCA map reveals an additional LABOCA source, denoted F in Fig. 1. While D, E and F are significant () at , no associated emission is seen in the SABOCA map. For a detailed analysis of the properties of SPT 233253 we refer to Vieira et al., in prep.
3.2. Millimeter and submillimeter fluxes
The LABOCA source coordinates, the SPT flux densities at and , and the LABOCA/SABOCA flux densities at and for our 11 sources are listed in Table 1. The SPT flux densities have been determined using the method described in V10. We report the peak flux densities, as none of the sources is resolved in the SPT maps. Submm flux density determinations are discussed below. For all source fitting, the absolute calibration error was added in quadrature to the statistical error.
We do not report the flux of SPT 233253 since it coincides with a massive cluster of galaxies (see Vanderlinde et al. (2010)), and the SZ decrement of the cluster at this wavelength overwhelms any emission (Vieira et al., in prep). In the case of SPT 234956, we disregard the B component, and attribute the SPT and fluxes to the component A, which coincides with the SPT centroid.
The LABOCA flux densities were determined by fitting a Gaussian with , the resolution of the smoothed maps, to the sources (except for SPT 233253, see below). A constant baseline term was included in the fit in order to account for any background level.
The SABOCA fluxes were derived by summing the flux within an aperture corresponding to the LABOCA beam solid angle (), i.e. within a radius of . A background level was estimated from a surrounding annular region (inner and outer radii of and ) and removed. The aperture was centered on the LABOCA centroid. The flux uncertainties were estimated for each source by measuring the flux within the same aperture at the same position in 100 difference maps generated from individual observations, and measuring the variance of the resulting distribution. For the SABOCA detections, we compared fluxes obtained by centering the aperture on the SABOCA and LABOCA centroids, and found the differences to be , well within the photometric uncertainties.
For SPT 233253, which is resolved into three sources in the LABOCA map, we derived the total flux within an aperture of . This aperture encompasses components A, B, C, and F. The same aperture was used to measure the corresponding total flux at in the SABOCA map. The SPT flux contains the combined contribution from all four components, and possibly also the D and E sources seen in the LABOCA maps, because of the large SPT beam. For subsequent photometric analysis we ignore any contribution from the positions of D and E to the total flux because of their large distance from the detected source. The D and E sources are not consistent with being part of the same lensing configuration as A, B, C, and F. The D and E sources do not have obvious IRAC counterparts. We have investigated the possibility that they are artifacts from the LABOCA data processing, but every test indicates that they are real.
SPT 052954 is extended in the SABOCA map, so we determined its flux using an aperture with radius .
3.3. Spectral energy distributions and redshifts
The majority of our sources do not have spectroscopic redshifts, which prevents us from determining their dust temperatures and luminosities. Our data are not well-suited to photometric redshift measurements that rely on LIRG SED templates (e.g. Silva et al., 1998; Chary & Elbaz, 2001), as we do not have data in the MIR and NIR where these templates have strong spectral features. The SED of dusty galaxies is nearly featureless at the spectral resolution of bolometer cameras, thereby hampering simple photometric redshift techniques. The most prominent feature, the frequency of the SED peak, cannot provide a redshift without prior information on the dust temperature, as these quantities are degenerate through the ratio (e.g. Blain et al. (2003)). Nonetheless, some success in predicting spectroscopic redshifts of SMGs have been achieved by maximum-likelihood techniques that employ libraries of SED templates of local starbursts and ULIRGs in their analysis (e.g. Aretxaga et al., 2007).
To overcome this degeneracy, we have developed a method that uses the distribution of SEDs for sources of known redshift taken from the literature. We assume a simple grey-body form for the SED to derive for sources in three samples: 1) unlensed sources at with imaging, 2) lensed sources at with imaging, and 3) SPT sources with known redshifts.
For the unlensed sources, we draw our sample from:
-
•
16 sources from Kovács et al. (2006), an selected sample with 1.4 GHz radio counterparts, optical spectroscopic redshifts, and imaging from CSO/SHARC-II.222Some of these sources also have photometry from CSO/BOLOCAM and/or photometry from IRAM/MAMBO, which we use, when available.
-
•
11 sources from Kovács et al. (2010), a Spitzer IRAC and MIPS selected sample with Spitzer/IRS MIR spectroscopy, IRAM/MAMBO imaging and imaging from CSO/SHARC-II.
-
•
18 sources from Chapman et al. (2010), a radio selected sample with detections, optical spectroscopic redshifts, and , , and imaging from Herschel/SPIRE.
- •
For the lensed sources, we draw our sample from:
-
•
5 well studied lensed sources from the literature, (e.g., Blain, 1999; Benford et al., 1999; Barvainis & Ivison, 2002) including IRAS F102144724, APM 082795255, and H 1413117 (the Cloverleaf). imaging for these sources comes from CSO/SHARC-II (Benford et al., 1999; Beelen et al., 2006) and millimeter photometry from a variety of literature sources.
- •
- •
For the two SPT sources, we use the measured spectroscopic redshifts described in §2.4.
We fit each source in each sample with a blackbody law, modified with a spectral emissivity that varies physically such that the dust opacity reaches unity at frequency (e.g., Blain et al., 2003):
| (1) |
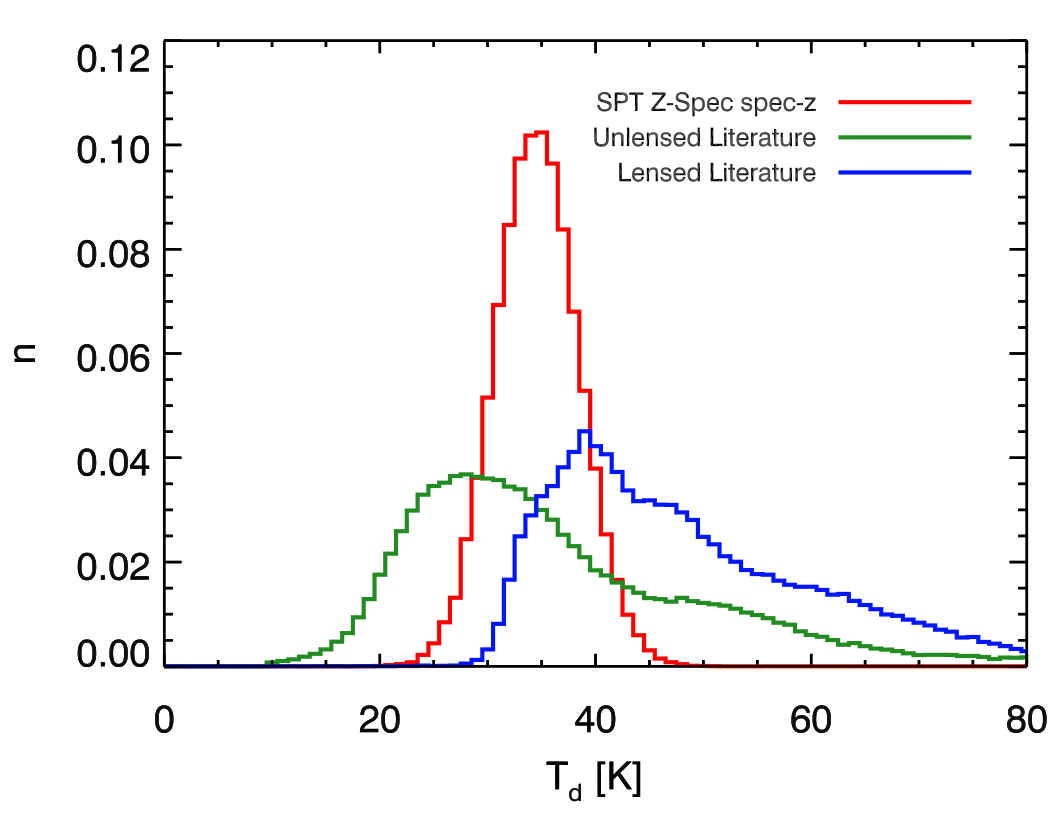
Here, is the Planck function. We fix the spectral index of the emissivity to , and critical frequency to () following Draine (2006). From these fits we derive a distribution of dust temperatures for each sample from the sum of the probability distributions of the individual sources (Fig. 2). The SED fits exclude any data at wavelengths shorter than (rest wavelength for the highest redshift sources) to ensure similarity between the calibration samples and the data in hand for SPT sources in this work. Moreover, such a constraint is appropriate to ensure the applicability of our simple model, which cannot adequately represent emission from hot components that may become apparent at shorter wavelengths. We find that our simple greybody fits all sources well over this wavelength range. We attribute the difference in the dust temperature distributions between the lensed and unlensed sources to the former being selected near the peak of their dust emission (e.g., by SPIRE at or, in the case of the bright AGN, by IRAS at ), which will bias the selection towards hotter (and more luminous sources). The unlensed sources were selected from either mm, radio or IRAC data, and we intentionally marginalized over these three selection techniques to mitigate any bias.
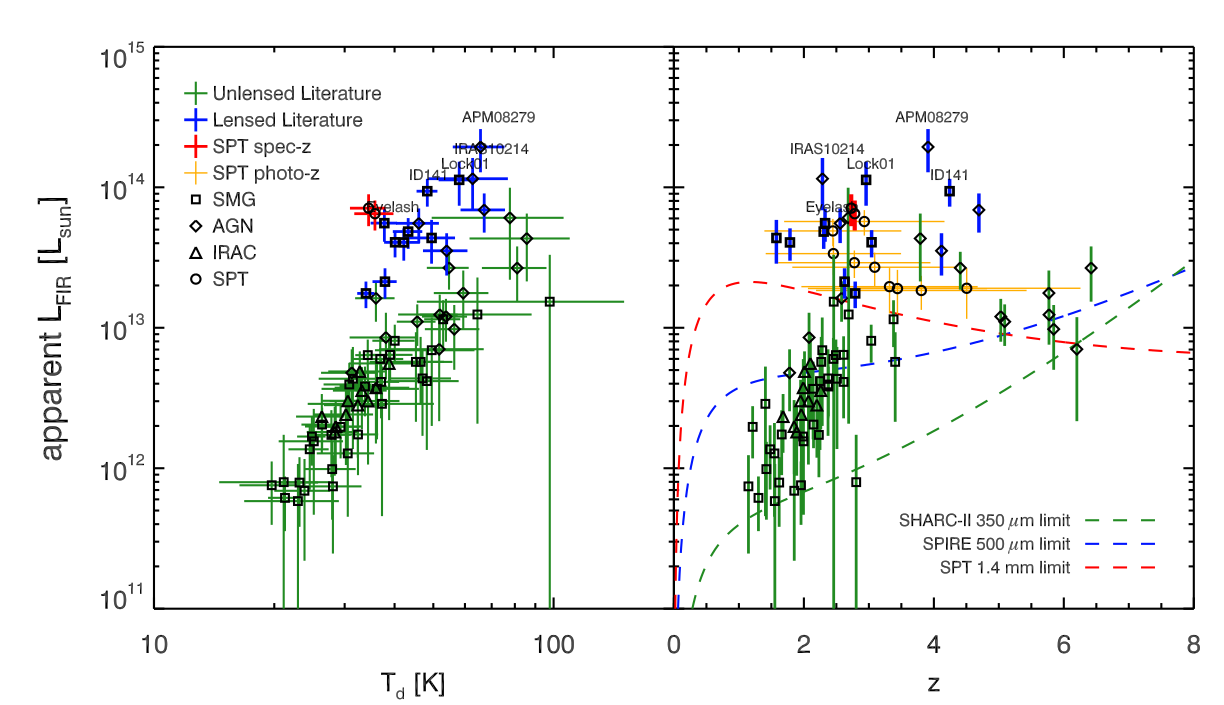
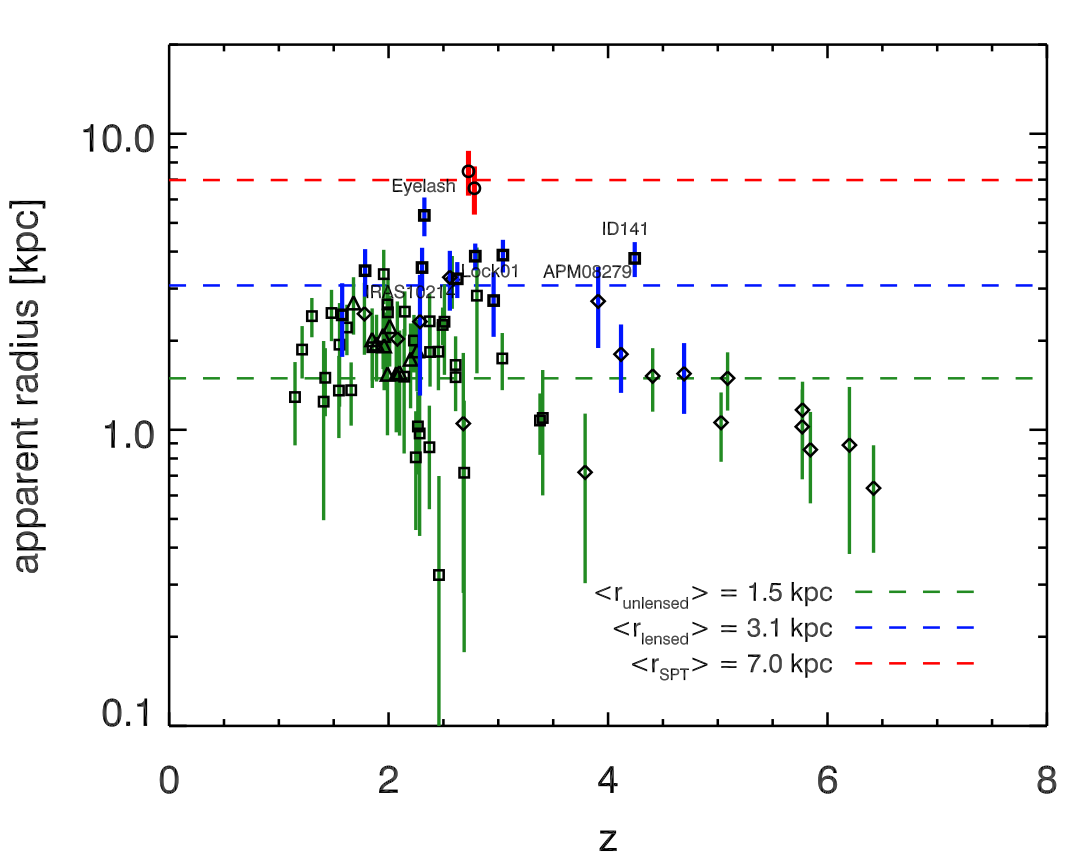
The distribution of , apparent , and for the three samples can be seen in Fig. 3. The lensed sources have the highest apparent luminosity at a given , as expected from the gravitational magnification, which increases the solid angle they subtend. The lensed sources appear to be offset in the vs. space, indicative of them being randomly sampled from the background and made more luminous by gravitational magnification. The lensed sources pulled from the literature are significantly hotter than the unlensed population. This is presumably due to selection effects.
The detection limits for the types of observations used in the three samples are also shown in the right panel of Fig. 3, for the SED model employed in this work and assuming a dust temperature of . The apparent luminosity threshold decreases at high redshift for SPT selection, owing to the steep rise in the submillimeter SED of these objects for .
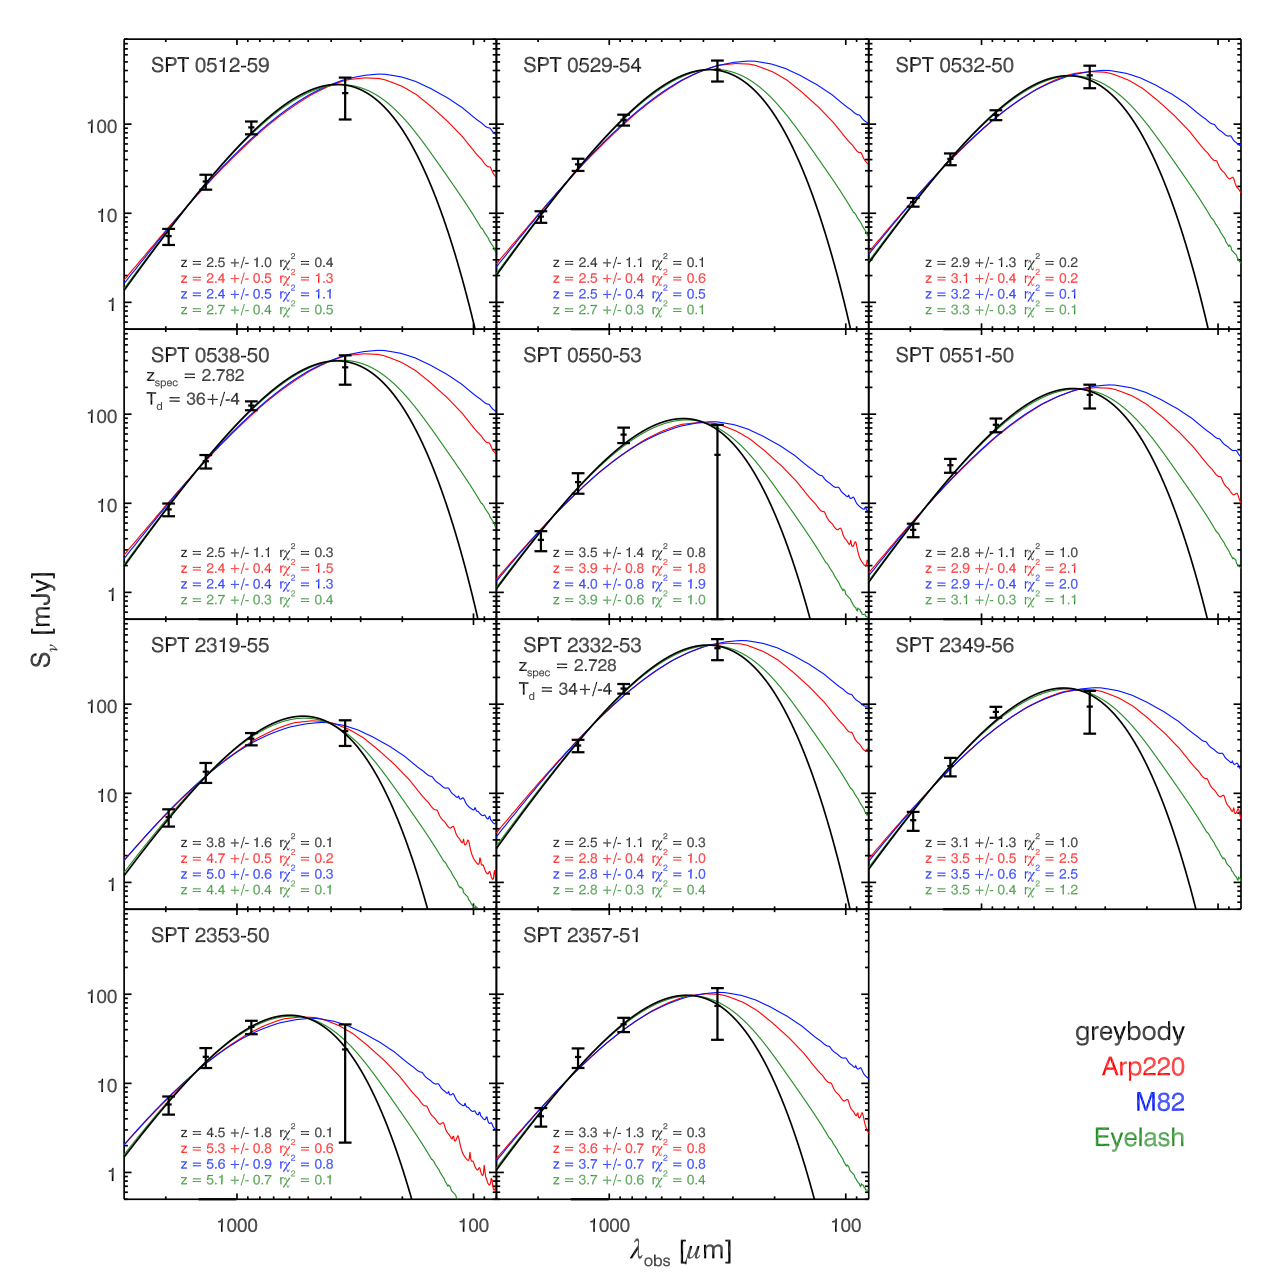
The observed submm/mm SEDs of the SPT sources are shown in Fig. 4. In all cases, the data point falls below the power-law extrapolation of the longer-wavelength data, giving the photometric redshift technique a spectral feature from which to impose its constraint. To infer a photometric redshift for an SPT source, we compare our data to the modified blackbody SED model described above. We randomly draw a value of from one of our distributions and fit the redshift for the SED described by this temperature. Repeating this times, we generate a probability distribution for the source redshift that marginalizes over the prior, and adopt the median and standard deviation of this distribution as the estimate of the photometric redshift and its uncertainty. The unlensed sample has a median dust temperature of , while the lensed sample has a median dust temperature of . We adopt the distribution from the unlensed sources throughout this paper under the assumption that lensing is randomly sampling the underlying unlensed population of sources. This is a conservative choice, since of the three distributions, it results in the lowest redshifts because of the degeneracy. Also, the dust temperatures derived for the two sources with spectroscopic redshifts fall in the middle of the unlensed distribution. The photometric redshifts derived from this analysis are indicated in Fig. 4 and in Table 2.
As a point of comparison, we also fit each SPT source with redshifted SED templates of Arp 220, M 82 (Silva et al., 1998), and the Eyelash (Ivison et al., 2010). The Eyelash SED is modeled using a two-component dust model comprising two modified blackbodies with and and , as described in Ivison et al. (2010). We adopt the redshift for which a given template provided the best fit to the data (global minimum) as the best estimate photometric redshift (for that template). The photometric redshifts and uncertainties obtained from these three SED templates are shown in Fig. 4. Without additional photometry shortward of it is difficult to discriminate between different SED templates such as Arp 220 or M 82. These galaxy template redshifts are consistent with the temperature-marginalized greybody values.
For the two sources with spectroscopic redshifts (SPT 233253 and SPT 053850), we can also directly check the photometric redshift estimates. In both cases we recover the true redshift to within the statistical uncertainties.
3.4. FIR luminosities, star formation rates, and dust masses
Adopting the photometric redshifts and SED fits described above in §3.3, we can derive far-infrared luminosities and star formation rates, and dust masses. The fits are shown as black curves in Fig. 4, and are seen to provide a good match to the data. For the two sources with spectroscopic redshifts, we can break the degeneracy, and derive the FIR luminosities, star formation rates, and dust temperatures, which are listed in Table 2. For the remaining sources, we derive FIR luminosities, star formation rates, and dust masses by fixing the dust temperature at the median of the distribution for the unlensed sources (K).
We determine dust masses according to
| (2) |
where is the flux density at the observed frequency (which we here set to , the rough central frequency of the LABOCA bandpass). is the luminosity distance, is the magnification factor, and is the cosmic microwave background temperature at redshift (which, in principle, has to be included, although it only changes the dust mass at the level – Papadopoulos et al. (2000)). We adopt (Hildebrand, 1983; Kruegel & Siebenmorgen, 1994), where is the adopted dust emissivity index (see §3.3). The dust masses (before correcting downward for the unknown magnification) are in the range (Table 2). We note that significant uncertainties are associated with these estimates due to the uncertainties in the dust emissivity.
The apparent FIR luminosity is determined from the modified blackbody SEDs, assuming , as described in §3.3. The SED is integrated over the rest wavelength range . This yields apparent FIR luminosities in range (Table 2). To derive total star formation rates, we use the following conversion from Murphy et al. (2011):
| (3) |
The resulting apparent star formation rates are in the range (Table 2). No correction has been applied to or the star formation rate for the unknown gravitational magnification factor and we use the factor of to indicate that these values are upper limits. Even if the lensing correction was known, we have assumed that AGN do not contribute significantly to the FIR luminosity, and the star formation rates would therefore still be upper limits.
Assuming a gas-to-dust mass ratio of , consistent with what is found for normal SMGs (e.g., Santini et al. 2010), we infer total apparent gas masses in the range , and gas-depletion time scales of . This is consistent with the lower-limit gas-depletion time scales () inferred from CO observations of normal SMGs (Greve et al., 2005). Note that the gas-depletion time scale estimate is independent of the lensing amplification factor as it enters in both the estimate of total gas mass and the star formation rate.
4. Discussion
4.1. FIR luminosities and dust temperatures
In this section, we compare the derived properties of our SPT sources with those of other ultra-bright SMGs from the literature with measurements and spectroscopic redshifts of . This comparison is summarized in Fig. 3, which shows vs. and vs. for the SPT sources and other ultra-bright SMGs, normal SMGs, and AGN.
As can be seen in Fig. 3, where we plot vs. , the two SPT sources with spectroscopic redshifts (and thus well-determined dust temperatures) are significantly cooler than other lensed, ultra-bright sources with similar FIR luminosities. The dust temperatures (determined using the SED fit described in §3.3) of the strongly lensed sources from the literature are in the range with a median of K, while the SPT dust temperatures have a mean , see Table 2 and Fig. 2. The fact that the SPT sources appear to have lower dust temperatures than other ultra-bright SMGs with similar FIR luminosities is likely due to the shorter wavelength () selection of the latter, which will be biased towards warmer temperatures. Also, the ultra-bright SMGs (and AGN) from the literature were selected based on their extreme brightness, which probably implies a preference towards warmer dust temperatures. It is also possible that strong lensing preferentially selects towards compact and warmer objects. Finally, differential magnification may have an effect on the measured source temperatures (e.g. Blain, 1999), but it is beyond the scope of this paper to address this issue.
For SPT sources with only photometric redshifts, we infer apparent FIR luminosities (integrated from ) in the range . In Fig. 3 we plot the FIR luminosities as a function of redshift, along with those of the above mentioned lensed and unlensed SMGs from the literature. The SPT sources have apparent FIR luminosities comparable to those of other lensed, ultra-bright SMGs, such as the SPIRE sources with spectroscopic redshifts, which have apparent FIR luminosities in the range . In comparison, normal SMGs have an average intrinsic FIR luminosity of (with a range – Kovács et al. (2006)). Thus, the apparent luminosities of ultra-bright SMGs (including those discovered by SPT) are typically an order of magnitude higher than those of the normal SMGs. To a large extent, this difference is expected to reflect the lensing amplification of the ultra-bright SMGs. In the case of the Eyelash, where the amplification factor is well-known (), the intrinsic FIR luminosity obtained after correcting for lensing is (Ivison et al., 2010), which is typical of normal SMGs.
4.2. SPT sources are strongly lensed
High-resolution follow-up observations of extremely bright SMGs in the literature have shown the majority to be strongly lensed, dusty galaxies (Swinbank et al., 2010; Fu et al., 2012). It seems reasonable to assume that the SPT sources, given their similarity to the literature sources, are also highly lensed, although, we cannot rule out that some fraction of them are intrinsically extremely luminous.
For some of the SPT sources, there is indeed unequivocal evidence that they are strongly lensed. In the case of SPT 233253, the LABOCA source is resolved into three distinct SABOCA sources – a morphology which strongly suggests we are dealing with a single source undergoing strong gravitational lensing. This is confirmed in optical/near-IR imaging of this source, where the SABOCA sources are clearly seen to line up with a giant arc (Vieira et al., in prep.). Similarly in SPT 052954, the LABOCA source is resolved into an extended SABOCA source with multiple peaks, again indicative of strong lensing. Finally, in at least one other case (SPT 053850), we see structure in the submm emission consistent with gravitational lensing (Bothwell et al., in prep.). A lack of high resolution (sub)mm imaging prevents us from constructing accurate lens models and deriving the intrinsic properties of the remainder of the sources. The mass scale of the haloes responsible for lensing the SPT population (i.e. galaxy-scale lensing, cluster lensing, etc.) is still poorly determined, although theoretical modeling indicates that the majority of the sources should be lensed by massive elliptical galaxies at (Hezaveh & Holder, 2011). Future publications will address the lensing statistics for this sample.
The SED fitting performed in §3.3 provides a way to estimate the average magnification of the SPT sources. The luminosity and temperature of the sources are related by a version of the Stefan-Boltzmann law, modified to account for the frequency-dependent emissivity of the sources, so that , where we assume that the SPT sources emit as modified blackbodies isotropically from a surface of radius . The effective Stefan-Boltzmann constant, , is determined for our model by setting equal to the ratio of the integral of the modified blackbody over a perfect Planck blackbody. For our model, with the opacity reaching unity at and (as for the two SPT SMGs with spectroscopic redshifts), varies from 0.51 to 0.54. Using this relation, we solve for the apparent effective radii obtained for the SPT sources, and also for the lensed and unlensed SMGs and dusty AGN from the literature333For simplicity we have assumed that the modification of the Stefan-Boltzmann law is the same for all sources, given by the value for , the median for the unlensed population. It varies by a factor of 50% over the range of enclosing the bulk of the unlensed SMGs and asymptotes to unity at large , but factors of order unity are unimportant for this argument. Assuming that the intrinsic sizes and dust temperatures of the SPT sources are, on average, similar to those of the unlensed SMGs, we can ascribe the differences in the apparent radii to different average magnification factors. From Fig. 5 we find an average size ratio of , which translates into a magnification ratio of . We stress, that while the apparent size estimates will depend on the optically thick transition-wavelength, , all sources are fitted with the same SED model, and so changing will not alter the relative trend seen.
For the SPT sources with photometric redshifts, the implied lensing magnification strongly depends on the assumed dust temperature. Sampling the distribution of temperatures associated with the unlensed catalog, we find a broad distribution of magnifications for the SPT photometric sources with 67% of the total samples indicating lensing magnification . Fixing the dust temperature for all sources to be K, as was found for the two SPT sources with spectroscopic redshifts, we find the mean magnification of the SPT sources with photometric redshifts to be . In order to make the SPT sample of photometric redshift sources consistent with no lensing , it is necessary for the mean dust temperature to be greater than K.
4.3. The redshifts of ultra-bright SMGs
From the 11 SPT sources presented in this paper, we find a median redshift of with a 68% range of using the modified blackbody fits (see §3.3). If we instead use the Arp 220, M 82, and Eyelash SED templates, we find in all cases median redshifts of . We emphasize that while the photometric redshifts derived in §3.3 should not be considered more reliable than within on a source-by-source basis, our analysis does indicate than when taken as a sample (which includes two spectroscopic redshifts) the SPT sources do have a very high average redshift. The use of the unlensed sample of SMGs as the prior is conservative in that it results in lower redshifts than would be found by using the lensed sample. The agreement between the modified black-body and template-derived redshift distributions, and the comparison to the two so SPT sources with spectroscopic redshifts suggests that this assumption is reasonable.
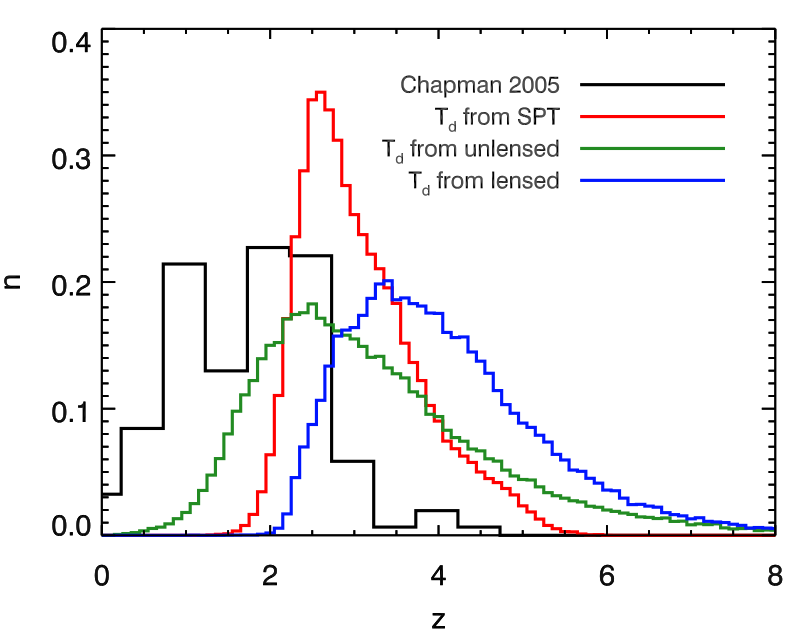
The redshift distribution for the SPT sources is shown in Fig. 6 for all three choices of the calibration sample for the modified blackbody fitting technique. The redshifts for a sample of normal, radio-identified, -selected SMGs are also shown (, Chapman et al. 2005), where we have updated the distribution to include five additional unlensed SMGs spectroscopically confirmed to reside in the redshift range (Capak et al., 2008, 2011; Knudsen et al., 2008; Coppin et al., 2010) as well as newly obtained redshifts by Banerji et al. (2011) of SMGs in the spectroscopic ’redshift desert’ (). If the SPT sources have similar dust temperatures as the unlensed SMG population at with spectroscopic redshifts, then the FIR colors imply that the SPT sources are at systematically higher redshifts. For all choices of calibration sample (which provide the prior), the SPT sources are at higher median redshift than the Chapman et al. (2005) sources.
The SPT sources are hypothesized to be a sample of gravitationally magnified members of the normal SMG population, which suggests that they should be drawn from the same redshift distribution. The difference in their observed redshift distributions is likely due to a combination of selection effects. First, the Chapman et al. (2005) sample is strongly selected against high redshift objects by virtue of the reliance on radio detections to inform spectroscopic followup. Some correction is provided by the addition of newer sources found to be at higher redshift, but the selection remains important. For the SPT sample, we removed any source which is detected in the IRAS-FSC, thereby removing low redshift unlensed interlopers and possibly a small number of lensed sources at . The longer-wavelength selection of the SPT sample also admits very high-redshift sources that would be harder to detect at as the SED peak approaches the bolometer passband. Finally, the strong lensing condition itself is expected to introduce a bias towards higher redshift objects. Theoretical work predicts that gravitational magnification by clusters and galaxies shifts the redshift distribution of an observed source population toward higher redshifts than an equivalent field-selected sample (Broadhurst et al., 1995; Blain, 1996; Negrello et al., 2007; Jain & Lima, 2011).
5. Summary
We have presented SABOCA and LABOCA maps and fluxes of 11 ultra-bright SMGs from the SPT survey, resulting in the first FIR/submm SEDs of SPT sources. Employing a novel method, which makes use of a compilation of SEDs of 58 sources with spectroscopic redshifts at and with photometry, we have derived photometric redshift estimates for our sources. In the two cases where we have spectroscopic redshifts, they agree well with the photometric redshifts from this analysis. The SPT redshift distribution, with a mean of and an 68% confidence region , is found to be skewed towards significantly higher redshifts than the distribution observed for the normal un-lensed SMG population. We argue that the higher mean redshift of the SPT sources is due to the longer selection wavelength and the lensing selection-criterion.
Using the median dust temperature measured from the unlensed population of sources from the literature, we fit modified blackbody laws to the observed SPT SEDs and estimated their apparent (i.e., lensing-uncorrected) FIR luminosities (), star formation rates (), and dust masses (). Based on the two SPT sources with spectroscopic redshifts, we derive dust temperatures () similar to that of normal SMGs. From the same two sources we estimate a value of for the gravitational magnification factor. Such a large magnification factor is in line with tentative lens models (Vieira et al. in prep, Bothwell et al. in prep) and theoretical modeling (Hezaveh & Holder, 2011). Once corrected for lensing, our findings, as well as those of others (e.g. Conley et al., 2011), suggest that the intrinsic properties of the ultra-bright SMGs will fall within the range of normal SMGs. Based on theoretical models and the measured projected area, it appears that the wide field coverage of the SPT finds the rarest, brightest objects, including those with the highest magnification relative to strongly lensed SMGs and AGN found in the literature.
Due to the extraordinary boosting of the flux and angular size caused by the gravitational lensing, ultra-bright SMGs are ideal targets for high-resolution follow-up observations with the Atacama Large Millimeter Array (ALMA), Herschel Space Observatory, and the Hubble Space Telescope. These observatories can access the dust properties, gas kinematics, and star formation conditions on sub-kpc scales in these systems. These observations were based on sources selected from 200 deg2. SPT has now surveyed 2500 deg2 and an extensive multi-wavelength campaign is on-going.
Facilities: APEX (SABOCA, LABOCA, Z-Spec), Spitzer, SPT.
References
- Aretxaga et al. (2007) Aretxaga, I. et al. 2007, MNRAS, 379, 1571
- Ashby et al. (2009) Ashby, M. L. N. et al. 2009, ApJ, 701, 428
- Austermann et al. (2009) Austermann, J. E. et al. 2009, MNRAS, 393, 1573
- Banerji et al. (2011) Banerji, M., Chapman, S. C., Smail, I., Alaghband-Zadeh, S., Swinbank, A. M., Dunlop, J. S., Ivison, R. J., & Blain, A. W. 2011, MNRAS, 1571
- Barger et al. (1998) Barger, A. J., Cowie, L. L., Sanders, D. B., Fulton, E., Taniguchi, Y., Sato, Y., Kawara, K., & Okuda, H. 1998, Nature, 394, 248
- Barvainis & Ivison (2002) Barvainis, R., & Ivison, R. 2002, ApJ, 571, 712
- Beelen et al. (2006) Beelen, A., Cox, P., Benford, D. J., Dowell, C. D., Kovács, A., Bertoldi, F., Omont, A., & Carilli, C. L. 2006, ApJ, 642, 694
- Benford et al. (1999) Benford, D. J., Cox, P., Omont, A., Phillips, T. G., & McMahon, R. G. 1999, ApJ, 518, L65
- Blain (1996) Blain, A. W. 1996, MNRAS, 283, 1340
- Blain (1999) —. 1999, MNRAS, 304, 669
- Blain et al. (2003) Blain, A. W., Barnard, V. E., & Chapman, S. C. 2003, MNRAS, 338, 733
- Blain et al. (1999) Blain, A. W., Moller, O., & Maller, A. H. 1999, MNRAS, 303, 423
- Bradford et al. (2009) Bradford, C. M. et al. 2009, ApJ, 705, 112
- Broadhurst et al. (1995) Broadhurst, T. J., Taylor, A. N., & Peacock, J. A. 1995, ApJ, 438, 49
- Capak et al. (2008) Capak, P. et al. 2008, ApJ, 681, L53
- Capak et al. (2011) Capak, P. L. et al. 2011, Nature, 470, 233
- Carlstrom et al. (2011) Carlstrom, J. E. et al. 2011, PASP, 123, 568
- Chapman et al. (2005) Chapman, S. C., Blain, A. W., Smail, I., & Ivison, R. J. 2005, ApJ, 622, 772
- Chapman et al. (2010) Chapman, S. C. et al. 2010, MNRAS, 409, L13
- Chary & Elbaz (2001) Chary, R., & Elbaz, D. 2001, ApJ, 556, 562
- Conley et al. (2011) Conley, A. et al. 2011, ApJ, 732, L35+
- Coppin et al. (2006) Coppin, K. et al. 2006, MNRAS, 372, 1621
- Coppin et al. (2010) Coppin, K. E. K. et al. 2010, MNRAS, 407, L103
- Cox et al. (2011) Cox, P. et al. 2011, ApJ, 740, 63
- Crawford et al. (2010) Crawford, T. M., Switzer, E. R., Holzapfel, W. L., Reichardt, C. L., Marrone, D. P., & Vieira, J. D. 2010, ApJ, 718, 513
- Danielson et al. (2011) Danielson, A. L. R. et al. 2011, MNRAS, 410, 1687
- Devlin et al. (2009) Devlin, M. J. et al. 2009, Nature, 458, 737
- Draine (2006) Draine, B. T. 2006, ApJ, 636, 1114
- Eales et al. (2010) Eales, S. et al. 2010, PASP, 122, 499
- Frayer et al. (2011) Frayer, D. T. et al. 2011, ApJ, 726, L22
- Fu et al. (2012) Fu, H. et al. 2012, ArXiv e-prints
- Gonzalez et al. (2010) Gonzalez, A. H., Papovich, C., Bradač, M., & Jones, C. 2010, ApJ, 720, 245
- Greve et al. (2005) Greve, T. R. et al. 2005, MNRAS, 359, 1165
- Haehnelt & Tegmark (1996) Haehnelt, M. G., & Tegmark, M. 1996, MNRAS, 279, 545+
- Harris et al. (2012) Harris, A. I. et al. 2012, ArXiv e-prints
- Hezaveh & Holder (2011) Hezaveh, Y. D., & Holder, G. P. 2011, ApJ, 734, 52
- Hildebrand (1983) Hildebrand, R. H. 1983, QJRAS, 24, 267
- Holland et al. (1999) Holland, W. S. et al. 1999, MNRAS, 303, 659
- Hughes et al. (1998) Hughes, D. H. et al. 1998, Nature, 394, 241
- Ikarashi et al. (2011) Ikarashi, S. et al. 2011, MNRAS, 1143
- Ivison et al. (2010) Ivison, R. J. et al. 2010, A&A, 518, L35+
- Jain & Lima (2011) Jain, B., & Lima, M. 2011, MNRAS, 411, 2113
- Johansson et al. (2010) Johansson, D. et al. 2010, A&A, 514, A77+
- Knudsen et al. (2008) Knudsen, K. K., van der Werf, P. P., & Kneib, J.-P. 2008, MNRAS, 384, 1611
- Kovács et al. (2006) Kovács, A., Chapman, S. C., Dowell, C. D., Blain, A. W., Ivison, R. J., Smail, I., & Phillips, T. G. 2006, ApJ, 650, 592
- Kovács et al. (2010) Kovács, A. et al. 2010, ApJ, 717, 29
- Kruegel & Siebenmorgen (1994) Kruegel, E., & Siebenmorgen, R. 1994, A&A, 288, 929
- Lestrade et al. (2010) Lestrade, J.-F., Combes, F., Salomé, P., Omont, A., Bertoldi, F., André, P., & Schneider, N. 2010, A&A, 522, L4+
- Lupu et al. (2010) Lupu, R. E. et al. 2010, ArXiv e-prints
- Moshir et al. (1992) Moshir, M., Kopman, G., & Conrow, T. A. O. 1992, IRAS Faint Source Survey, Explanatory supplement version 2, ed. M. Moshir, G. Kopman, & T. A. O. Conrow
- Murphy et al. (2011) Murphy, E. J. et al. 2011, ApJ, 737, 67
- Negrello et al. (2010) Negrello, M. et al. 2010, Science, 330, 800
- Negrello et al. (2007) Negrello, M., Perrotta, F., González-Nuevo, J., Silva, L., De Zotti, G., Granato, G. L., Baccigalupi, C., & Danese, L. 2007, MNRAS, 377, 1557
- Neri et al. (2003) Neri, R. et al. 2003, ApJ, 597, L113
- Oliver et al. (2010) Oliver, S. J. et al. 2010, A&A, 518, L21+
- Omont et al. (2011) Omont, A. et al. 2011, A&A, 530, L3+
- Papadopoulos et al. (2000) Papadopoulos, P. P., Röttgering, H. J. A., van der Werf, P. P., Guilloteau, S., Omont, A., van Breugel, W. J. M., & Tilanus, R. P. J. 2000, ApJ, 528, 626
- Pascale et al. (2008) Pascale, E. et al. 2008, ApJ, 681, 400
- Perera et al. (2008) Perera, T. A. et al. 2008, MNRAS, 391, 1227
- Rex et al. (2010) Rex, M. et al. 2010, A&A, 518, L13+
- Santini et al. (2010) Santini, P. et al. 2010, A&A, 518, L154+
- Schuller et al. (2010) Schuller, F., Nord, M., Vlahakis, C., Albrecht, M., Beelen, A., Bertoldi, F., Mueller, S., & Schaaf, R. 2010, BoA – The Bolometer Data Analysis Software. User and Reference Manual (http://www.mpifr-bonn.mpg.de/div/submmtech/software/boa/boa_main.html)
- Schuster et al. (2006) Schuster, M. T., Marengo, M., & Patten, B. M. 2006, in Society of Photo-Optical Instrumentation Engineers (SPIE) Conference Series, Vol. 6270, Society of Photo-Optical Instrumentation Engineers (SPIE) Conference Series
- Silva et al. (1998) Silva, L., Granato, G. L., Bressan, A., & Danese, L. 1998, ApJ, 509, 103
- Siringo et al. (2009) Siringo, G. et al. 2009, A&A, 497, 945
- Smail et al. (1997) Smail, I., Ivison, R. J., & Blain, A. W. 1997, ApJ, 490, L5+
- Spergel et al. (2003) Spergel, D. N. et al. 2003, ApJS, 148, 175
- Sunyaev & Zeldovich (1972) Sunyaev, R. A., & Zeldovich, Y. B. 1972, Comments on Astrophysics and Space Physics, 4, 173
- Swinbank et al. (2010) Swinbank, A. M. et al. 2010, Nature, 464, 733
- Vanderlinde et al. (2010) Vanderlinde, K. et al. 2010, ApJ, 722, 1180
- Vieira et al. (2010) Vieira, J. D. et al. 2010, ApJ, 719, 763
- Wang et al. (2010) Wang, R. et al. 2010, ApJ, 714, 699
- Wang et al. (2008) —. 2008, AJ, 135, 1201
- Weiß et al. (2009) Weiß, A. et al. 2009, ApJ, 707, 1201
- Wilson et al. (2008) Wilson, G. W. et al. 2008, MNRAS, 390, 1061
| ID | R.A. | Dec. | ||||
|---|---|---|---|---|---|---|
| mJy | mJy | mJy | mJy | |||
| SPT-S J0512595935.6 | 05:12:57.8 | 59:35:39.6 | ||||
| SPT-S J0529035436.6 | 05:29:03.0 | 54:36:33.3 | aaThe flux is integrated within a aperture covering the extended emission. | |||
| SPT-S J0532505047.1 | 05:32:50.9 | 50:47:10.0 | ||||
| SPT-S J0538165030.8 | 05:38:16.5 | 50:30:52.5 | ||||
| SPT-S J0550025356.6 | 05:50:00.5 | 53:56:41.2 | bbNo emission peak at . The flux was measured within an aperture corresponding to the LABOCA beam solid angle (see §3.2). | |||
| SPT-S J0551385057.9 | 05:51:39.2 | 50:57:59.4 | ||||
| SPT-S J2319215557.9 | 23:19:21.5 | 55:57:57.6 | bbNo emission peak at . The flux was measured within an aperture corresponding to the LABOCA beam solid angle (see §3.2). | |||
| SPT-S J2332275358.5 | 23:32:26.5 | 53:58:39.8 | ccThe flux is integrated within a aperture covering the -A, -B, -C, and -F components. | ccThe flux is integrated within a aperture covering the -A, -B, -C, and -F components. | . . .ddNo flux measurements available for this source, see §3.2 for details. | |
| . . . . . . . -A | 23:32:29.7 | 53:58:38.4 | eeThe flux is measured within a aperture. | . . . | . . . | |
| . . . . . . . -B | 23:32:27.6 | 53:58:42.8 | eeThe flux is measured within a aperture. | . . . | . . . | |
| . . . . . . . -C | 23:32:25.8 | 53:58:38.0 | ††footnotemark: | . . . | . . . | |
| . . . . . . . -D | 23:32:29.0 | 53:57:59.0 | bbNo emission peak at . The flux was measured within an aperture corresponding to the LABOCA beam solid angle (see §3.2). | . . . | . . . | |
| . . . . . . . -E | 23:32:29.4 | 53:59:31.0 | bbNo emission peak at . The flux was measured within an aperture corresponding to the LABOCA beam solid angle (see §3.2). | . . . | . . . | |
| . . . . . . . -F | 23:32:27.1 | 56:58:17.0 | bbNo emission peak at . The flux was measured within an aperture corresponding to the LABOCA beam solid angle (see §3.2). | . . . | . . . | |
| SPT-S J2349425638.2 | 23:49:42.3 | 56:38:41.2 | bbNo emission peak at . The flux was measured within an aperture corresponding to the LABOCA beam solid angle (see §3.2). | |||
| . . . . . . . -A | 23:49:43.1 | 53:58:17.0 | bbNo emission peak at . The flux was measured within an aperture corresponding to the LABOCA beam solid angle (see §3.2). | . . . | . . . | |
| SPT-S J2353385010.2 | 23:53:39.9 | 50:10:05.2 | bbNo emission peak at . The flux was measured within an aperture corresponding to the LABOCA beam solid angle (see §3.2). | |||
| SPT-S J2357185153.7 | 23:57:17.1 | 51:53:52.1 |
Note. — SABOCA () and LABOCA () flux densities of the 11 SPT sources presented in this paper, along with their SPT ( and ) flux densities. The positions are the centroid positions, except for SPT 233253-A, -B, and -C where the centroid positions are used. Unless otherwise stated, all fluxes were measured within an aperture corresponding to the LABOCA beam solid angle (see §3.2). The errors given are statistical only. For the SED fitting analysis we add the absolute calibration uncertainty in quadrature to the statistical uncertainty.
| Short IDa | photo- | spec- | ||||
|---|---|---|---|---|---|---|
| [K] | ||||||
| SPT 051259 | . . . | … | ||||
| SPT 052954 | . . . | … | ||||
| SPT 053250 | . . . | … | ||||
| SPT 053850 | ||||||
| SPT 055053 | . . . | … | ||||
| SPT 055150 | . . . | … | ||||
| SPT 231955 | . . . | … | ||||
| SPT 233253 | ||||||
| SPT 234956 | . . . | … | ||||
| SPT 235350 | . . . | … | ||||
| SPT 235751 | . . . | … |
Note. — Best estimates of dust temperatures, spectral indices and dust masses as derived from the modified blackbody fits (see §3.3). The FIR luminosities, star formation rates, and dust masses are apparent and have not been corrected for gravitational amplification, , and should therefore be considered strict upper limits. For the sources with only photometric redshifts, the errors of the FIR luminosities, star formation rates, and dust masses have been derived assuming K