Warm HCN in the planet formation zone of GV Tau N 111Based on observations carried out with the IRAM Plateau de Bure Interferometer. IRAM is supported by INSU/CNRS (France), MPG (Germany) and IGN (Spain).
Abstract
The Plateau de Bure Interferometer has been used to map the continuum emission at 3.4 mm and 1.1 mm together with the J=10 and J=32 lines of HCN and HCO+ towards the binary star GV Tau. The 3.4 mm observations did not resolve the binary components and the HCN J=10 and HCO+ J=10 line emissions trace the circumbinary disk and the flattened envelope. However, the 1.1 mm observations resolved the individual disks of GV Tau N and GV Tau S and allowed us to study their chemistry. We detected the HCN 32 line only towards the individual disk of GV Tau N, and the emission of the HCO+ 32 line towards GV Tau S. Simple calculations indicate that the 32 line of HCN is formed in the inner R12 AU of the disk around GV Tau N where the HCN/HCO+ abundance ratio is 300. On the contrary, this ratio is 1.6 in the disk around GV Tau S. The high HCN abundance measured in GV Tau N is well explained by photo-chemical processes in the warm (400 K) and dense (n107 cm-3) disk surface.
Subject headings:
ISM: individual objects (GV Tau N, GV Tau S) — ISM: lines and bands — radio continuum: ISM — stars:formation1. Introduction
A fraction of the gas and dust in protoplanetary disks will end up in planets and may constitute the basis to form prebiotic species. A large effort has been done aiming to detect the warm gas in the planet formation zone using Spitzer and NIR ground-based facilities. In a pionering work, Lahuis et al. (2006) detected strong HCN and C2H2 absorption features toward one source, IRS 46, from a sample of more than 100 Class I and II sources located in nearby star-forming regions. Later, Gibb et al. (2007, 2008) detected the HCN and C2H2 absorption lines in GV Tau. Carr & Najita (2011) detected the rotational transitions of H2O and OH and the rovibrational bands of simple organic molecules (CO2, HCN, C2H2) in 11 classical T Tauri stars showing that these molecules are not uncommon in the inner region of the T Tauri disks. Thus far, only NIR spectroscopy has provided information about the chemical composition of the gas in the inner disk region. Interferometric mm and submm observations are key to derive the kinematics and physical conditions of the gas, as well as the molecular abundance radial profiles that NIR studies cannot provide.
GV Tau (Haro 6-10) is a T Tauri binary system embedded in the L1524 molecular (d=140 pc) cloud. It is one of a small number of young binaries for which the primary (GV Tau S) is optically visible and the companion (GV Tau N), located 1.2 to the North, is strongly embedded. It is associated with a parsec-scale Herbig-Haro flow which extends to 1.6 pc to the north at a position angle of about 222∘ and 1 pc to the south (Devine et al. 1999; see also Movsessian & Magakian 1999). This region has been extensively studied in the NIR and all the studies pointed to the existence of a complex system composed of two circumstellar disks associated with GV Tau N and GV Tau S respectively that are themselves surrounded by a circumbinary disk and/or flattened nebula (Ménard et al. 1993, Koresko et al. 1999, Leinert et al. 2001). Doppmann et al. (2008) and more recently Wilking et al. (2012) proposed that GV Tau N and possibly GV Tau S could be binary systems themselves. The two individual disks GV Tau N and GV Tau S are misaligned and present different inclination angles. The GV Tau N disk has an edge-on geometry, while the GV Tau S disk is closer to a face-on orientation which allows the stellar radiation to escape forming a visible nebula ( Roccatagliata et al. 2011). Only the GV Tau N disk has been detected in the H2 2.12 m ro-vibrational line (Herbst et al. 1995). The HCN and C2H2 absorption ro-vibrational lines are detected towards GV Tau N (Gibb et al. 2007, 2008) which proves the existence of a rich organic chemistry in the inner disk of this star. The non-detection of these lines towards GV Tau S did not allow, however, to conclude about its disk chemistry since it could be due to the different disk inclination.
We present 3.4 mm and 1.1 mm interferometric images of GV Tau using the IRAM Plateau de Bure Interferometer (PdBI). The highest spatial resolution observations at 1.1 mm allowed us to resolve the GV Tau N and GV Tau S individual disks and have a first glance of the chemical differences between them.
2. Observations
The HCN 10 and HCO+ 10 lines were observed using the PdBI in its CD configuration during 2009 October-November. This configuration provided an angular resolution of 3.073.05 PA 17∘ (432 AU429 AU at the distance of Taurus). During the observations two 40 MHz bandwidth correlator units were placed at the frequencies of the HCN 10 (88631.85 MHz) and HCO+ 10 (89188.52 MHz) lines providing a spectral resolution of 78 kHz. These lines were also observed with the 320 MHz units which provided a spectral resolution of 2.5 MHz. Other two 320 MHz units were placed in a frequency range free of lines to measure the continuum and subtract it from the spectral line maps.
In 2011 February, we performed sub-arcsecond imaging of this region in the HCN 32 and HCO+ 32 lines using the PdBI in its A configuration, which provides a beam of 0.490.26 PA 16∘ (69 AU36 AU). Two 40 MHz correlator units were placed at the frequencies of the HCN 32 (265886.18 MHz) and HCO+ 32 (267557.526 MHz) lines. We used the correlator WIDEX to cover the 4 GHz bandwidth of the receivers (264.58 - 268.18 GHz). Only HCO+ 32 and HCN 32 were detected down to an rms of 6 mJy/beam with a spectral resolution of 2 MHz. The channels without line emission in WIDEX were used to create the continuum 1.1 mm map which was subtracted from the spectral maps. The resulting 3.4 mm and 1.1 mm continuum images are shown in Fig. 1. The spectral maps are shown in Fig. 2 and Fig. 3. The phase center in our observations was RA(J2000)=04:29:23.73 Dec(J2000)=24:33:00.30, in between the two stars.
3. Results
3.1. Continuum
Our 3.4 mm image does not resolve the two components of the binary. An elliptical Gaussian was fit to the uv table and the parameters are shown in Table 1. The size of the emission, 280 AU in diameter, is slightly smaller than the size of the NIR nebula observed by Ménard et al. (1993). The 3.4 mm continuum emission peaks in the middle of the two stars, suggesting a similar contribution to the total flux from the two disks. The total flux, 16.10.4 mJy is consistent with that measured by Guilloteau et al (2011).
Our 1.1 mm observations clearly resolve the two components which present similar intensity. Gaussian fits to the uv tables were done and the parameters are shown in Table 1. Because of our elongated beam, the disks are resolved in only one direction. Our fit gives a radius of 0.07 (10 AU) for the emission of the two disks. Guilloteau et al. (2011) observed this target using the PdBI with a larger beam of 0.890.56 and derived a size twice larger than ours. After modeling the emission, they concluded that the two disks are, very likely, optically thick and the size was overestimated because of the atmospheric seeing. This could be a reason for our disagreement. Another possibility is that we have filtered out part of the disk emission. The filtering effect would be more severe towards GV Tau S disk because of the face-on orientation. With the sizes derived from our observations, we estimate a brightness temperature of 69 K for the N and 56 K for the S components respectively (we give a lower limit because the emission is essentially unresolved in one direction), consistent with the emission arising from the R10 AU region of a T Tauri disk (Pinte et al. 2006).
| Source | HPBW() | Flux (mJy) | Major () | Minor() | PA | |||
|---|---|---|---|---|---|---|---|---|
| GV Tau N+S | 04:29:23.733 | 24:33:00.56 | 3.4mm1 | 3.073.05 | 16.1 (0.4) | 2.02 ( 0.08) | 1.06 ( 0.13) | -14 (3) |
| GV Tau N | 04:29:23.731 | 24:33:01.30 | 1.1mm1 | 0.490.26 | 49.8 ( 1.1) | 0.14 ( 0.03) | 0.03 (0.04) | 52 (1) |
| 1.3mm2 | 0.890.56 | 43.8 (3.1) | 0.24 (0.11) | 0.09 (0.06) | 53 (18) | |||
| HCN 321 | 0.500.25 | 3.64(0.21)3 | 0.32(0.04) | 0.25(0.05) | -41(20) | |||
| GV Tau S | 04:29:23.743 | 24:32:59.99 | 1.1mm1 | 0.490.26 | 38.0 ( 1.1) | 0.12 ( 0.02) | 0.03 (0.05) | -34 (1) |
| 1.3mm 2 | 0.890.56 | 46.7 (3.2) | 0.37 (0.05) | 0.11 (0.07) | -2(8) | |||
| HCO+ 321 | 0.490.28 | 9.24(1.1)3 | 1.26(0.06) | 0.73(0.09) | -74(5) | |||
1 This work; 2 Guilloteau et al. (2011); 3 Total flux in Jykm s-1.
3.2. Spectral Observations
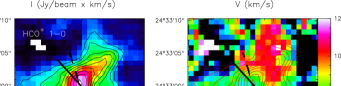
We have detected intense emission of the HCN 10 and HCO+ 10 lines towards GV Tau. The integrated emission of the HCO+ 10 line is composed of a compact source centered at the phase center and an envelope elongated in the south-east north-west direction. In Fig. 2 we show the velocity map of the HCO+ 10 line. A clear velocity gradient is detected in the south-east north-west direction. The direction of this gradient is close to orthogonal to the main Herbig Haro outflow, and consistent with the existence of a rotating circumbinary disk. The integrated emission of the HCN 10 line is composed of a compact source and an extended envelope. The compact source peaks 1 to the North of the phase center suggesting a larger contribution of GV Tau N to the total emission. The extended emission is very asymmetric, being more extended towards the south-east than towards the north-west. Moreover, the HCN 10 emission has an elongation in the outflow direction (see Fig. 2). There is some hint of velocity gradient in the HCN 10 line although in this case the gradient is less clear than in the case of HCO+ 10.
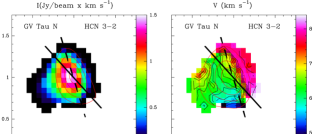
In Fig. 1 we show the spectra of the HCN 32 and HCO+ 32 lines towards GV Tau N and S. The HCN 32 line is only detected towards the N component. The HCO+ line is clearly detected towards the S component and tentatively detected towards the N. The velocity integrated intensity map of the HCN 32 line is well fitted with an elliptical Gaussian of 0.320.040.250.05 centered at the star position, a size slightly larger than that of the 1.1 mm continuum emission. The emission of the HCO+ 32 line is clearly more extended than the 1.1 mm continuum suggesting some contribution from the circumbinary disk and/or the nebula. Fitting a elliptical Gaussian in the uv plane, we obtain a size of 1.260.060.730.09. The zero and first momentum maps of the HCN 32 and HCO+ 32 line emissions are shown in Fig. 3. A clear velocity gradient is detected in GV Tau N. The velocity gradient defines a rotation axis that is in between that of the main Herbig Haro outflow and the Herbig jet (Devine et al. 1999, Movsessian & Magakian 1999). In GV Tau S we detect a velocity gradient in the north-south direction but it cannot be interpreted as a disk rotation. The kinematics of the HCO+ 32 line is very likely affected by the outflow motion.
3.3. HCN and HCO+ Column Densities
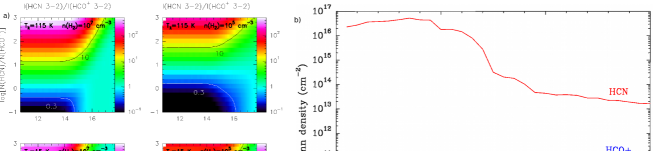
Gibb et al. (2007, see also erratum 2008) detected absorption due to the HCN towards GV Tau N. The estimated column density and rotational temperature were 3.70.3 1016 cm-2 and 11510 K for HCN assuming a linewidth of 12 km s-1. With these physical conditions the HCN 32 line is optically thick and the expected brightness temperature is 110 K. We measured a peak intensity of 192 mJy/beam (26 K) towards GV Tau N which implies that the size of the emitting region is 24 AU, so that the warm HCN is present in the inner 12 AU from the star. The HCN 32/HCO+ 32 flux ratio towards GV Tau N is 10. LVG calculations show that assuming that both molecules arise in the same region with the physical conditions derived by Gibb et al. (2007), the HCN/HCO+ column density ratio is 300 (see Fig. 4a). The brightness temperature of the HCN 10 line in this small region would then be 94 K, which diluted in the 3.4 mm beam would give a main beam brightness temperature of 0.28 K. The main beam brightness temperature we measure is larger, 0.85 K, consistent with the fact that the emission is extended and mostly arises from the outer part of the disk and the circumbinary disk/nebula.
Towards GV Tau S, only the HCO+ 32 line is well detected and the HCN 32/HCO+ 32 flux ratio is 0.3. Assuming n(H2)=107 cm-3 and a kinetic temperature of 18 K, we derive a beam averaged column density of N(HCO+)=1.01014 cm-2 in a linewidth of 8.6 km s-1 and the HCN/HCO+ column density ratio would be 0.6 (see Fig. 4a). Other possibility is that the emission arise in the lower density and warmer disk surface. In Fig. 4a, we explored this possibility (n(H2)=105 cm-3, Tk=115 K) and conclude that in this case we would obtain N(HCN)/N(HCO+)1.6.
We use the 3.4 mm lines of HCN and HCO+ to have an estimate of the HCN/HCO+ column density ratio in the nebula surrounding the binary. Using the integrated line intensity of the weakest satellite component of the HCN 10 line, assuming Local Thermodynamic Equilibrium and Trot=15 K, we estimate a beam averaged column density of 1.71013 cm-2. With the same assumptions, we derive a HCO+ column density of 11013 cm-2. Therefore the average HCN/HCO+ column density in this region is 1.7. This ratio is not dependent on the assumed rotation temperature as long as it is the same for the two molecules, which is a reasonable assumption taking into account their similar dipole moments.
4. Discussion and Conclusions
Our millimeter data allow for the first time to sample the planet formation zone of the disks GV Tau N and GV Tau S and evidence a dramatic chemical differentiation in the molecular gas associated with GV Tau N and GV Tau S. Previous NIR observations did not allow to conclude because the absorption lines are strongly dependent on the disk orientation. Our observations show that the HCN/HCO+ ratio must be 300 in the planet formation zone of GV Tau N. In contrast, the HCN/HCO+ must be 1.6 in GV Tau S. The huge HCN column density found in the inner R12 AU disk of GV Tau N is consistent with the chemical calculations by Agúndez Cernicharo & Goicoechea (2008). They predicted an HCN abundance as large as 510-5 in the inner R3 AU of circumstellar disks (see Fig. 4b). The HCN is not arising from the disk mid-plane but from the photon-dominated region in the disk surface. The high densities and temperatures in this region are essential to achieve a huge HCN abundance (Cernicharo 2004). The synthesis of organic molecules in the gas requires that atomic carbon, produced by the dissociation of CO, incorporates into C-bearing species faster than reverting to CO. For example, C2H2 and HCN reach low abundances at 100 K because the reactions of C2H and CN with H2 have activation barriers (Cernicharo 2004). At temperatures above 400 K atomic oxygen is efficiently converted into OH, which may react with C to form CO but reacts faster with H2 to form water. Thus, most of the oxygen forms H2O, and CO does not reach its maximum abundance allowing atomic carbon to form C-bearing molecules. The key reactions for the HCN formation such that C+NOCN+O, or H2+CNHCN+H, proceed very rapidly at these large gas densities (107 cm-3) and temperatures (Cernicharo 2004). This mechanism also works for any dense PDR such as those found around protoplanetary nebula where the photodissociation of CO and HCN allows a fast photo-polymerization towards longer carbon chains (Cernicharo 2004).This same result was found by Walsh et al. (2010) in their disk chemical model which included a grain-surface network. In that model the [HCN]/[HCO+] ratio was 1000 at R1 AU and always 10 for R10 AU. Although not essential, accretion shocks could contribute to enhance the density and gas kinetic temperature and make the HCN formation more efficient.
One puzzling question then is the non-detection of HCN in GV Tau S. This can only be explained by a different disk morphology (flatter disk, an inner gap), different dust properties and/or a different gas/dust ratio in the inner disk. Higher spatial resolution interferometric observations are required to unveil the hidden structure of this interesting binary.
References
- (1) Agúndez, M., Cernicharo, J., & Goicoechea, J. R. 2008, A&A, 483, 831
- (2) Carr, J. S., & Najita, J. R. 2011, ApJ, 733, 102
- (3) Cernicharo, J., 2004, ApJ, 608, L41
- (4) Cernicharo, J., 2012, ECLA-2011: Proceedings of the European Conference on Laboratory Astrophysics, European Astronomical Society Publications Series, 2012, Editors: C. Stehlé, C. Joblin and L. d’Hendecourt
- (5) Devine, D., Reipurth, B., Bally, J., & Balonek, T. J. 1999, AJ, 117, 2931
- (6) Doppmann, G. W., Najita, J. R., & Carr, J. S. 2008, ApJ, 685, 298
- (7) Gibb, E.L., Van Brunt, K.A., Brittain, S.D.,& Rettig, T.W., 2007, ApJ, 660, 1572
- (8) Gibb, E.L., Van Brunt, K.A., Brittain, S.D., & Rettig, T.W., 2008, ApJ, 686, 748
- (9) Guilloteau, S., Dutrey, A., Piétu, V., & Boehler, Y. 2011, A&A, 529, A105
- (10) Herbst, T. M., Koresko, C. D., & Leinert, C. 1995, ApJ, 444, L93
- (11) Koresko, C. D., Blake, G. A., Brown M.E., et al., 1999, ApJ, 525, L49
- (12) Lahuis, F., van Dishoeck, E. F., Boogert, A. C. A., et al. 2006, ApJ, 636, L145
- (13) Leinert, C., Beck, T. L., Ligori, S., et al. 2001, A&A, 369, 215
- (14) Ménard, F., Monin, J.-L., Angelucci, F., & Rouan, D. 1993, ApJ, 414, L117
- (15) Movsessian, T. A., & Magakian, T. Y. 1999, A&A, 347, 266
- (16) Pinte, C., Ménard, F., Duchêne, G., & Bastien, P. 2006, A&A, 459, 797
- (17) Roccatagliata, V., Ratzka, T., Henning, T., et al. 2011, A&A, 534, A33
- (18) Walsh, C., Millar, T. J., & Nomura, H. 2010, ApJ, 722, 1607
- (19) Wilking, B. A., Marvel, K. B., Claussen, M. J., et al. 2012, arXiv:1205.5760