Bars in hydrodynamical cosmological simulations
Abstract
We study the properties of two bars formed in fully cosmological hydrodynamical simulations of the formation of Milky Way-mass galaxies. In one case, the bar formed in a system with disc, bulge and halo components and is relatively strong and long, as could be expected for a system where the spheroid strongly influences the evolution. The second bar is less strong, shorter, and formed in a galaxy with no significant bulge component. We study the strength and length of the bars, the stellar density profiles along and across the bars and the velocity fields in the bar region. We compare them with the results of dynamical (idealised) simulations and with observations, and find, in general, a good agreement, although we detect some important differences as well. Our results show that more or less realistic bars can form naturally in a CDM cosmology, and open up the possibility to study the bar formation process in a more consistent way than previously done, since the host galaxies grow, accrete matter and significantly evolve during the formation and evolution of the bar.
keywords:
galaxies: kinematics and dynamics - galaxies: structure - cosmology: theory - galaxies: photometry - methods: numerical1 Introduction
Bars are present in roughly two thirds of all galactic discs (Eskridge et al., 2000; Barazza et al., 2008) and can drive the secular evolution of their host galaxies. They have thus been the subject of a number of studies based on dynamical simulations, i.e. simulations aimed towards an understanding of the main relevant dynamical mechanisms (e.g. Combes et al. 1990; Debattista & Sellwood 2000; Athanassoula & Misiriotis 2002; Athanassoula 2003; Martinez-Valpuesta et al. 2006). These use idealised initial conditions, made specifically for the question under study, and set aside all other effects, at least until an understanding of the basic mechanism is achieved. The initial conditions correspond to a fully developed disc plus halo system which is as near equilibrium as possible, so that the bar formation can be studied uninfluenced by other instabilities. Furthermore, interactions with other galaxies, major or minor, as well as inflow from the environment has been seldom taken into account (see, however, Curir et al. 2006), while the halo is usually assumed to be initially spherical. Moreover, the gas is generally neglected or modelled without taking into account star formation, feedback or cooling.
In this letter, we take a different approach, i.e. we study bar formation in the context of the CDM cosmology. In this way, we include important external effects, such as accretion and interactions and, more important, the bars do not wait for the galaxy to be fully formed to start their own formation. The disc and even the dark matter halo keep growing while the bar forms. Also, our galaxies do not have preset halo-to-disc mass ratios, velocity dispersions, or other properties, and all their properties directly result from the simulations. This of course implies that we will not be able to address the same questions as the dynamical simulations. For example, we can not examine how a given property of the host galaxy, e.g. the halo radial density profile, will influence the formation and evolution of the bars. On the other side, we will include in our simulations more physics that in any other single bar formation simulation. Our main goal is to investigate if bars can naturally form in CDM, and compare their properties with those of dynamic simulations and with observations.
The layout of the paper is as follows. In Section 2 we describe the simulations, in Section 3 we present and discuss our results, and we conclude in Section 4.

2 Simulations and analysis
We study the present-day properties of bars formed in two hydrodynamical simulations of galaxy formation in a CDM universe. The simulations correspond to galaxies that, at redshift , are similar in mass to the Milky Way and are mildly isolated. They are a sub-sample of the eight simulations extensively described in Scannapieco et al. (2009, 2010, 2011, hereafter S09, S10 and S11, respectively). We analyse here the galaxies named Aq-C (Aq-C-5 in S09, M⊙) and Aq-G (Aq-G-5 in S09, M⊙), where bars are clearly present at . Two other galaxies, Aq-A and Aq-E, have bars at (S10); however, we defer their analysis to a separate work since the evolution of these systems is far more complicated. Aq-A has two stellar misaligned discs at , while Aq-E has a rotating bulge and a recent interaction with a satellite galaxy which strongly disturbs the system (S11).
We assume a CDM cosmology with , , , and km s-1 Mpc-1. The mass resolution is M⊙ for dark matter and M⊙ for baryons (S09). The gravitational softening is kpc, it is fixed in comoving coordinates and is the same for gas, stars and dark matter particles.
The simulations were run with the Tree-PM SPH code GADGET-3 (Springel et al., 2008), with the additional modules of Scannapieco et al. (2005, 2006). It includes star formation, chemical enrichment and (type II and Ia) supernova feedback, metal-dependent cooling, an explicit multiphase model for the gas component, and the effects of a UV background. We refer the reader to S09 and S11 for full details on the initial conditions, simulation code and resolution effects.
Our analysis methods largely follow those in Athanassoula & Misiriotis (2002, hereafter AM02), to easily compare our results to dynamic simulations and to observations. There are, however, two differences. First, unlike in dynamic simulations where it is possible to analyse discs separately from bulges (all through this paper, by bulge we mean classical bulge, Kormendy & Kennicutt 2004), here they constitute together the stellar component and any attempt to distinguish between them is approximate. The second difference is that in dynamic simulations the softening is about one tenth of that used here. Consequently, our results will be more smoothed out than those of dynamical simulations.
We will also follow the terminology introduced in AM02, where MH denotes simulations with strong bars, in which the near-resonant material in the bar region emits a considerable amount of angular momentum, which is absorbed mainly by the near-resonant material in the halo. Simulations in which considerably less angular momentum has been redistributed, and which therefore have less strong bars (Athanassoula 2003, hereafter A03), are called MD.
3 Results
3.1 Morphology
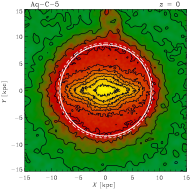
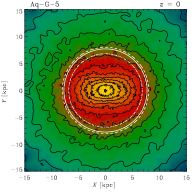
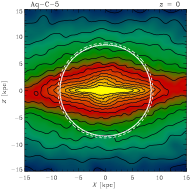
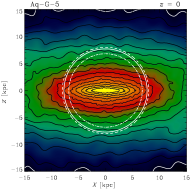
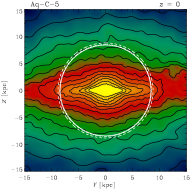
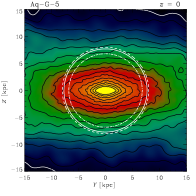
Fig. 1 shows maps of projected surface stellar mass density for Aq-C and Aq-G. The projection is such that is the disc’s equatorial plane, with angular momentum in the positive direction and with the bar major, intermediate and minor axes lying along the , and axes, respectively.
Aq-C has a significant well-defined disc, a bulge-like component and a bar. The bar looks very strong, very thin and rectangular-like. Seen face-on, the bulge has a rather peculiar shape. In contrast, Aq-G does not have a significant bulge (S10), but has an important bar and a clearly identifiable disc. Its bar is very symmetric and, viewed face-on, much fatter than that of Aq-C.
We find some differences between our simulated galaxies and both real galaxies and galaxies in dynamic simulations, in particular in the face-on views. We find that Aq-C has a bizarre shaped bulge, unlike what is usually observed. Note however that, in a CDM cosmology, the shape of galaxies can change very rapidly particularly during and/or after interactions with satellites and mergers. In the case of Aq-G, the disagreement is quantitative, rather than qualitative. Rectangular-shaped bars have been many times observed, but always in strong bars (Athanassoula et al., 1990; Athanassoula & Misiriotis, 2002; Gadotti, 2011). On the other hand, the bar in Aq-G is fat, more like an oval (i.e. weak), but still has a clear rectangular outline. Aq-G then looks like a hybrid between strong and weak bars.
3.2 Bar strength
In order to quantify the bar strength we Fourier analysed the projected face-on mass density (), i.e.:
| (1) |
with being the azimuthal angle and the cylindrical radius. In practice, we calculate and as:
| (2) |
| (3) |
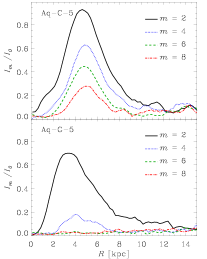
where is the mass of the stellar particle and the summation is over all particles in an annulus around radius . We define the amplitudes of the Fourier components as () and , and use their ratio as a measure of the bar strength (note that several dynamical simulation studies and observations use the ratios instead of .). We show for Aq-C and Aq-G (up to ) in Fig. 2 (left-hand panels).
Aq-C, the strongest of our two bars, has a large component. Its maximum, , occurs at kpc and is similar to those found in dynamical simulations with gas but no star formation (Villa-Vargas et al. 2010 and references therein). Compared to dynamical simulations with star formation, feedback and cooling, Aq-C corresponds roughly to simulations with most baryons initially in a gaseous component and reaching about 6 to 10% gas in the disc at times comparable to (Athanassoula et al., in prep.). The shape of the radial profile is more reminiscent of that found in gas-rich dynamical simulations. Some of the differences could, nevertheless, be due to the fact that we are including in the Fourier analysis all stars, i.e. from the disc, the bar and the bulge. This will necessarily lower the components, though, in this case at least, not all in the same way since the bulge has a clear rectangularity. Also, = 4 aside, this lowering must be stronger in the inner parts, where the bulge contribution is larger.
The higher order even moments () have maxima of , and , in very good agreement with MH-type simulations. These maxima occur at radii roughly equal to that of the , while in MH-type dynamical simulations they occur considerably further out. This also could be due to the strong rectangularity of the bulge (Fig. 1).
The bar of Aq-G is less strong, with that occurs at kpc. The moments are very small () at all radii, in good agreement with the more elliptical-like bar outline. In fact, the components are within the noise. Thus they are in many ways similar to those from MD simulations, where less angular momentum has been redistributed within the galaxy than in MH-types (AM02, A03). The fact that is shorter in Aq-G than in Aq-C indicates that the bar is shorter, as already inferred from Fig. 1. Note, however, that the two galaxies have neither the same mass, nor the same extent, as seen in Fig. 1 (see also Section 3.4).
Another important difference between the two bars is the shape of the amplitude for and . In Aq-C, the declines on the two sides of are similar, whereas in Aq-G the decline is clearly steeper inwards. In dynamical simulations, the norm is an asymmetrical decline on the two sides of the maximum (but see simulations MH1 in Athanassoula et al. 2005, which has a strong central mass concentration).
Finally, the odd Fourier components () are, both for Aq-C and for Aq-G, very small () at all radii indicating that both bars are quite symmetric.
Our results are in relatively good agreement with observations, that find a great variety of profiles and of maximum values, typically between and (Ohta et al. 1990; Aguerri et al. 2001; Aguerri et al. 2003; Buta et al. 2006). In Aq-C, is very high, but values as high as have also been observed (Buta et al., 2006).
3.3 Density profiles along major and minor axes
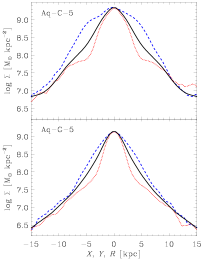
Fig. 2 (right panels) shows the stellar density profiles viewed face-on, along the major () and minor () axes of the bar, as well as azimuthally averaged (note that we include here all stars in the simulations, i.e. bulge, disc and bar).
The profiles of the two simulations differ significantly between them, while having a number of similarities with those of dynamic simulations. The profile of Aq-G along the bar major axis shows a clear near-exponential drop; a behaviour similar to that of MD models, and to the ‘exponential’ bars often observed in late-type galaxies (Elmegreen & Elmegreen, 1985). In contrast, Aq-C has a less typical profile. It shows a flattish section, but of short extent, arguing that it is linked to the bulge rather than the bar, contrary to the flattish parts of MH bars (Fig. 5 in AM02) and of ’flat’ bars in observed early-type galaxies (Elmegreen & Elmegreen, 1985). Furthermore, and contrary to MH-type bars in dynamic simulations, there is no abrupt fall of the density profile at the position of the bar end, presumably due to the fact that the softening in the cosmological simulations is much larger and so washes out the relatively steep drop at the end of the bar.
The density profiles along the minor axis of the two galaxies also show significant differences. In Aq-C, the profile shows a clear change in slope at the position where the bar ends. This behaviour is also found in MH-type bars and means that the bar is sufficiently strong to clear out the region around the Lagrangian points, as one sees in many observed strong barred galaxies. Aq-G also shows a change in the slope of the density profile along the bar minor axis; but much less pronounced than Aq-C. Fig.2 also shows that the difference between the cuts along the major and minor axes in the bar region is considerable larger in Aq-C than in Aq-G, confirming that the bar is much stronger in the former case.


3.4 Bar length
AM02 presented a number of ways to measure bar length and discussed their advantages and disadvantages. Whenever possible or useful, these methods were extended to observed bars (Gadotti et al., 2007). As not all of these methods are well adapted to cosmological simulations, we will here use three of them, of which one after a small modification.
The first method (iii in AM02, bar length ) uses the radial profile of the phase of the component which, in the bar region, should be approximately constant. Outside it, the phase either shows a coherent increase or decrease due to a spiral, or large variations in the absence of clear structures. Following AM02, we calculate the phase of the Fourier component of: (i) the whole bar-disc system and (ii) as a function of radius, and define the bar length as the maximum radius where these two quantities differ by less than arcsin(0.3). In this way, we obtain bar lengths of kpc for Aq-C and kpc for Aq-G (see Fig. 3 and dashed circles in Fig. 1).
For the second method (iv in AM02, bar length ) we use the relative Fourier component. If the disc and bar were rigid, the length of the bar would be the radius at which the component goes to zero. This is not the case in simulated bars, but we can still get an estimate of the bar length from the radius where the amplitude drops to a given (arbitrary) fraction of the maximum, that we take to be . In this way, we obtain lengths of kpc for Aq-C and of kpc for Aq-G (solid circles in Fig. 1).
The third method (v in AM02, bar length ) uses the density profiles shown in Fig. 2. Namely, we take the difference between the profiles along the major and minor axes, which is zero at the centre, increases until a maximum and then drops again. If the disc and bar were rigid, the end of the bar would be where the two projected density profiles become equal again. In simulated bars, the bar length is defined as the radius where the difference between the profiles drops to per cent of the maximum. This method yields bar lengths of kpc for Aq-C and of kpc for Aq-G (dot-dashed circles in Fig. 1).
The bar lengths obtained by our three methods agree very well between them for Aq-C and reasonably well for Aq-G. For Aq-C we get a mean value of kpc and for Aq-G of kpc.
We can compare our results to the observations of barred galaxies presented in Gadotti (2011, hereafter G11). By applying bulge-disc-bar decompositions with the BUDDA code (Gadotti, 2008), G11 obtained bar lengths () and ratios between the bar length and the disc scale-length (). We have applied the same method to our simulated galaxies (S10), obtaining the values of the disc scale lengths. We find values of for Aq-C, and of for Aq-G (depending on the bar length estimation). These are at the low end of the distribution given in G11, but still compatible with it. On the other hand, if we make comparisons directly with the values of bar length in kpc, we find that they are at the high end of the distribution in G11 but, again, still compatible with it.
3.5 Kinematic properties
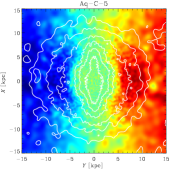
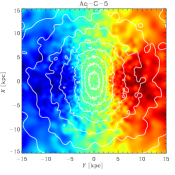
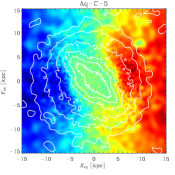
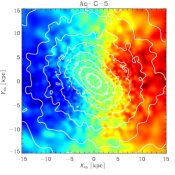
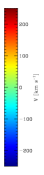
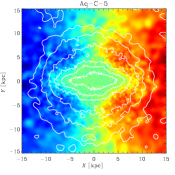
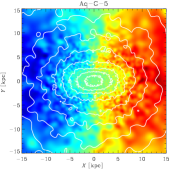
The most telling characteristics of a bar in a radial velocity field are the presence of kinematical axes which are not perpendicular to each other, as well as a zigzag (Z) behaviour of the isovelocity curves corresponding to the systemic velocity of the galaxy. This Z aspect is best seen in velocity fields where the bar makes an angle of 45 degrees with the major axis of the galaxy (e.g. Athanassoula 1984). To investigate the kinematic structure of our simulated galaxies, we show in Fig. 4 their stellar velocity fields, obtained as in AM02, i.e. in a way that is the most convenient for comparing with observations of galaxies at intermediate inclinations, and also allows direct comparison with the AM02 results. For Fig. 4, we rotate the galaxy according to the desired viewing angles, project all particles on the equatorial plane, and observe their line-of-sight (i.e. along the corresponding plotted ordinate axis) velocity component. For the three views shown in the figure, this is equivalent to observing along the bar major axis, at 45 degrees to it and along the bar minor axis, respectively. Note that Fig. 4 shows the stellar velocity fields, which are not directly comparable to gaseous ones.
The zigzag (Z) behaviour mentioned above is clearly seen in our two simulated galaxies. The effect in Aq-C is quite strong, and is comparable to that in model MH of AM02. The effect is weaker in Aq-G, but still stronger than the corresponding MD model of AM02. When we observe along the bar major axis, the isovelocities show the standard spider diagram form. The central concentration is less than in the dynamical simulations of AM02, but this is due to our larger softening. Finally, when we view along the bar minor axis, the velocity fields have an inner region which roughly delineates the bar and where the velocity is lower. This was also found in AM02 and is due to the fact that near the ends of the bar the particles are at their apocenters, i.e. the velocities are lower. The mean velocities in those regions can be further lowered if the corresponding periodic orbits have loops at their apocenters (Athanassoula, 1992).
4 Conclusions
We presented the first study of bars formed in fully cosmological, hydrodynamical simulations of Milky Way-sized haloes. The simulations include star formation, metal-dependent cooling, feedback from supernova and a UV background field. In particular, we investigated the morphology, strength and length of the bars, their projected density profiles and kinematical properties.
The strongest of our two bars formed in a bulge-disc-halo system (Aq-C), while the weakest in a galaxy with a disc but no significant bulge (Aq-G). Compared to dynamical simulations, the strongest bar is similar to those found in systems where a considerable amount of angular momentum is exchanged between the bar and the halo. In contrast, the weakest bar is more reminiscent of dynamical simulations where considerably less angular momentum has been redistributed. The bar strength difference between our two simulated bars could be due to the effect of the bulge on the angular momentum exchange (which is negligible in Aq-G), as found in pure N-body dynamical simulations of isolated discs (AM02, A03), but the effect of interactions and/or of the gas component could also be decisive.
The Aq-C (strongest) bar is very thin and rectangular-like, while that of Aq-G (weakest bar) is very fat, and also rectangular-like. Rectangular shapes are observed in strongly barred galaxies, so Aq-G is, in this respect, like an hybrid between strong and weak bars. Another difference is that the bulge of Aq-C has a rather peculiar shape which has so far not been observed. The peculiar shape is presumably a result of the cosmological formation of our galaxies, where mergers and/or interactions are common at all times.
The lengths of our bars are in relatively good agreement with observations of G11, although in the long tail of the distribution. The strongest bar, formed in our most massive galaxy, is also the longest. On the other hand, the ratios between bar length and disc scale-lenght are at the low end of the observed distribution, but still compatible with it.
The density profiles are similar to those found in dynamical simulations; however, we detect some differences particularly in Aq-C and in the very central regions, probably because we include stars from all components in our analysis, unlike in dynamical simulations. Finally, the kinematic properties of our bars are similar to those observed and to those found in dynamic simulations.
The fact that the bars were obtained in a cosmological setting, and that their properties agree relatively well with known properties of bars, is not minor. Our galaxies grow significantly from to , where the bars are first detected in the simulations. Moreover, external (accretion, interactions and mergers) and internal (cooling, star formation and feedback) effects strongly affect the galaxies during their evolution. For these reasons, our results are quite satisfactory and very encouraging, and should incite more work on the study of bar formation in a cosmological context.
References
- Aguerri et al. (2001) Aguerri J. A. L., Beckman J. E., Prieto M., 2001, ApSS, 276, 691
- Aguerri et al. (2003) Aguerri J. A. L., Debattista V. P., Corsini E. M., 2003, MNRAS, 338, 465
- Athanassoula (1992) Athanassoula E. 1992, MNRAS, 259, 328
- Athanassoula (2003) Athanassoula E. 2003, MNRAS, 341, 1179 (A03)
- Athanassoula et al. (2005) Athanassoula E., Lambert J. C., Dehnen W., 2005, MNRAS, 363, 496
- Athanassoula & Misiriotis (2002) Athanassoula E., Misiriotis A., 2002, MNRAS, 330, 35 (AM02)
- Athanassoula et al. (1990) Athanassoula E., Morin S., Wozniak H., Puy D., Pierce M. J., Lombard J., Bosma A., 1990, MNRAS, 245, 130
- Barazza et al. (2008) Barazza F. D., Jogee S., Marinova I., 2008, ApJ, 675, 1194
- Buta et al. (2006) Buta R., Laurikainen E., Salo H., Block D. L., Knapen J. H., 2006, AJ, 132, 1859
- Combes et al. (1990) Combes F., Debbasch F., Friedli D., Pfenniger D., 1990, A&A, 233, 82
- Curir et al. (2006) Curir A., Mazzei P., Murante G., 2006, A&A, 447, 453
- Debattista & Sellwood (2000) Debattista V. P., Sellwood J. A., 2000, ApJ, 543, 704
- Elmegreen & Elmegreen (1985) Elmegreen B. G., Elmegreen D. M., 1985, ApJ, 288, 438
- Eskridge et al. (2000) Eskridge P. B., Frogel J. A., Pogge R. W. et al., 2000, AJ, 119, 536
- Gadotti (2008) Gadotti D. A. 2008, MNRAS, 384, 420
- Gadotti (2011) Gadotti D. A. 2011, MNRAS, 415, 3308 (G11)
- Gadotti et al. (2007) Gadotti D. A., Athanassoula E., Carrasco L., Bosma A., de Souza R. E., Recillas E., 2007, MNRAS, 381, 943
- Kormendy & Kennicutt (2004) Kormendy J., Kennicutt Jr. R. C., 2004, ARA&A, 42, 603
- Martinez-Valpuesta et al. (2006) Martinez-Valpuesta I., Shlosman I., Heller C., 2006, ApJ, 637, 214
- Ohta et al. (1990) Ohta K., Hamabe M., Wakamatsu K.-I., 1990, ApJ, 357, 71
- Scannapieco et al. (2010) Scannapieco C., Gadotti D. A., Jonsson P., White S. D. M., 2010, MNRAS, 407, L41 (S10)
- Scannapieco et al. (2005) Scannapieco C., Tissera P. B., White S. D. M., Springel V., 2005, MNRAS, 364, 552
- Scannapieco et al. (2006) Scannapieco C., Tissera P. B., White S. D. M., Springel V., 2006, MNRAS, 371, 1125
- Scannapieco et al. (2009) Scannapieco C., White S. D. M., Springel V., Tissera P. B., 2009, MNRAS, 396, 696 (S09)
- Scannapieco et al. (2011) Scannapieco C., White S. D. M., Springel V., Tissera P. B., 2011, MNRAS, 417, 154 (S11)
- Springel et al. (2008) Springel V., Wang J., Vogelsberger M. et al., 2008, MNRAS, 391, 1685
- Villa-Vargas et al. (2010) Villa-Vargas J., Shlosman I., Heller C., 2010, ApJ, 719, 1470