NA49 Collaboration
System-size and centrality dependence of charged kaon and pion production in nucleus-nucleus collisions at 40 GeV and 158 GeV beam energy
Abstract
Measurements of charged pion and kaon production are presented in centrality selected Pb+Pb collisions at 40 GeV and 158 GeV beam energy as well as in semi-central C+C and Si+Si interactions at 40 GeV. Transverse mass spectra, rapidity spectra and total yields are determined as a function of centrality. The system-size and centrality dependence of relative strangeness production in nucleus-nucleus collisions at 40 GeV and 158 GeV beam energy are derived from the data presented here and published data for C+C and Si+Si collisions at 158 GeV beam energy. At both energies a steep increase with centrality is observed for small systems followed by a weak rise or even saturation for higher centralities. This behavior is compared to calculations using transport models (UrQMD and HSD), a percolation model and the core-corona approach.
pacs:
25.75.-qI Introduction
Strangeness production has always been an important observable for probing the state of matter created in heavy-ion collisions. The yields of the various strange hadrons, properly normalized to those in elementary nucleon-nucleon interactions, are expected to exhibit different behavior in partonic than in hadronic environments rafelski-mueller . The number of created strange quark-antiquark pairs per participating nucleon is significantly higher in central Pb+Pb collisions than in p+p interactions at all collision energies. A maximum in the yield of the relative to that of the in central Pb+Pb collisions was observed by NA49 at about 30 GeV beam energy na49_energy ; na49_20-30 and interpreted as evidence for the onset of deconfinement. Microscopic models such as HSD and UrQMD do not predict a maximum. In the statistical model this structure can only be reproduced by including additional features like those introduced in ABS , i.e. high mass resonances beyond the ones listed in PDG and a significant contribution by meson states. There are no indications for a similar non-monotonic energy dependence of this ratio in p+p interactions. In order to better understand the observed maximum in the energy dependence observed in central Pb+Pb collisions, measurements of the system size dependence of strangeness production are needed for different strangeness carriers and at various energies.
NA49 has published data on the system-size dependence of hyperon ( and ) na49_multis and (anti-)proton yields and distributions Milica in Pb+Pb collisions at 40 GeV and 158 GeV beam energy. Results on pions, kaons, mesons and hyperons in C+C and Si+Si at 158 GeV were reported in Ref. na49_size . Pion and kaon production was also studied in p+p interactions at 158 GeV Fischer_pi ; Fischer_K . The present study completes these results by a measurement of the centrality dependence of pion and kaon production in Pb+Pb collisions at 40 GeV and 158 GeV beam energy as well as for C+C (66% most central) and Si+Si (29% most central) interactions at 40 GeV. These results provide a link between the centrality selected data on pion and kaon production at lower (SIS, AGS) and higher (RHIC) energy. At SIS and AGS energies kaon and pion production was studied in centrality selected Au+Au collisions as well as in collisions of smaller systems such as Si+Al sis ; ags ; Wang . Here, a rather linear increase is observed for relative kaon production with the number of participants. On the other hand, at RHIC energies a clear saturation behavior is found for collisions with more than approximately 60 nucleons participating in the collision phenix ; star . The same observation has also been made at top SPS energies comparing central C+C, Si+Si and Pb+Pb collisions na49_size .
Statistical models based on the grand-canonical ensemble (G-CE) have been used to describe strange particle yields in central collisions of heavy nuclei at high energies BGKMS ; ABS ; BMG . For smaller reaction volumes, because of the lower number of produced strange quarks, restrictions due to strangeness conservation arise, which suppress strangeness production with respect to the infinite volume limit. This is taken into account by using canonical ensembles in the statistical model calculations. The transition from the canonical to the grand-canonical ensemble would thus result in a characteristic volume dependence of strangeness production rafelski-danos ; redlich . When comparing statistical model results to experimental data in terms of reaction volume, the latter has to be related to an experimental observable. In Refs. redlich ; Cle98 the reaction volume was assumed to be proportional to the number of wounded nucleons (see section III). However with this approach the data at SPS energies and above could not be described satisfactorily percolation . Good agreement can be achieved, if the relevant volume is subject to additional geometric constraints which restrict strangeness conservation to subvolumes, as realized for example in the percolation models. The corresponding calculations suggest that not only for small systems several subvolumes are formed, but that also in central collisions not all nucleon-nucleon collisions are included in the central volume percolation . A simpler implementation of this ansatz is realized in the so-called core-corona model core-corona ; Bozek . It is built on the assumption that the fireball created in nuclear collisions is composed of a core, which has the same properties as a very central collision system, and a corona, which is a superposition of independent nucleon-nucleon interactions. The sizes of core and corona can be defined by the condition that the corona is formed by those nucleon-nucleon collisions in which both partners interact only once during the whole collision process. The fraction of single scatterings is calculated using straight line geometry as described in the Glauber model glauber . This approach was recently successfully applied to the system-size dependence of strangeness production at RHIC energies becattini ; werner-rhic and for the above mentioned hyperon production at SPS na49_multis . The common features of such model calculations at fixed energy are a fast increase of relative strangeness production with system size for small reaction volumes (below approximately 60 participating nucleons) and eventual saturation for large system sizes.
II The NA49 experiment
The NA49 detector is a large acceptance hadron spectrometer at the CERN SPS NA49NIM . The main components are four large time projection chambers (TPCs) and two super-conducting dipole magnets with a one meter vertical gap, aligned in a row, and a total bending power of 9 Tm. The magnetic field was set a factor of four lower for data taking at 40 GeV than at 158 GeV. Two two-meter long TPCs (VTPCs) inside the magnets each with 72 pad-rows along the beam direction allow for precise tracking, momentum determination, vertex reconstruction, and particle identification (PID) by the measurement of the energy loss () in the detector gas with a resolution of 6%. The other two TPCs (MTPCs) downstream of the magnets have large dimensions (4 m x 4 m x 1.2 m, 90 pad-rows) and provide additional momentum resolution for high momentum particles as well as PID by measurement with a resolution of around 4%. A momentum resolution in the range is achieved. Two time-of-flight scintillator arrays of 891 pixels each (TOF), situated just behind the MTPCs symmetrically on either side of the beam axis, add additional K/ separation power in the laboratory momentum range from one to ten GeV (near mid-rapidity for kaons). A veto-calorimeter (VCAL) placed 20 meters downstream of the target accepts all beam particles and projectile fragments as well as most of the spectator neutrons and protons NA49NIM . The geometrical acceptance of VCAL was readjusted for each beam energy by means of a collimator for optimum projectile spectator coverage. VCAL is used for off-line (on-line) selection of event centrality in Pb+Pb (C+C and Si+Si) collisions. The NA49 detector is described in detail in reference NA49NIM .
For Pb+Pb collisions a primary SPS beam of 40 GeV and 158 GeV was directed onto a Pb target while for C+C and Si+Si interactions a fragmented Pb beam of 40 GeV was used. The fragments were identified by magnetic rigidity () and by a pulse-height measurement in a scintillation counter in the beam. For C+C and Si+Si interactions beam particles with around 6 and around 14, respectively, were selected online. A refined selection was done offline, which yielded a pure C-beam, whereas for the ”Si-beam” the different charges could not be separated well enough, thus a mixture of ions with = 13, 14, and 15 (intensity ratio 34:44:22) were accepted. The target disks had thicknesses of 10 mm (carbon), 5 mm (silicon) and 200 m (lead) corresponding to 7.9%, 4.4%, and 0.5% interaction lengths for the respective beam particles.
The Pb (light ion) beam passed through a quartz Cherenkov (scintillator) detector, from which the start signal for the time-of-flight measurement was obtained, and three stations of multi-wire proportional chambers which measured the trajectory and energy loss of individual beam particles. A minimum bias trigger for Pb+Pb interactions was derived from the signal of a gas Cherenkov device right behind the target. Only interactions which reduce the beam charge and thus the signal seen by this detector by at least 10% were accepted. The interaction cross section thus defined is 5.7 b at both energies. The trigger for the C+C and Si+Si data taking at 40 GeV was based on the energy deposited in VCAL. The 66% most central C+C and 29% most central Si+Si interactions were selected by requiring an energy in VCAL below the imposed threshold. These fractions are determined using the inelastic A+A cross sections (10% uncertainty), the trigger cross sections (5% uncertainty), and a simulation of the VCAL response.
III Data analysis
The data sample used for this analysis was collected in specific minimum bias runs of the NA49 experiment and thus are different from the central data presented earlier [2]. The recorded minimum bias Pb+Pb collisions were divided into five consecutive centrality bins: C0 - C4 (see Tab. 1 and Ref. ALaszlo ). The centrality selection is based on the forward going energy of projectile spectators as measured in VCAL. We quantify centrality by the fraction of cross-section according to intervals of forward going spectator energy. For each centrality interval a characteristic quantity, the mean value of ”wounded nucleons” is calculated. A nucleon is considered wounded, if its interaction occurs in the nuclear overlap volume. is determined by generating VCAL spectra with events from the VENUS 4.12 Monte Carlo code venus . The simulation took into account the energy resolution of the calorimeter and contributions of participants to the energy recorded by VCAL. After cross calibration of experimental and simulated spectra for effects of the experimental trigger in the most peripheral centrality bin the meqan number of interacting (wounded) nucleons () was extracted from the model data for each of the selected cross section fractions Laszlo_method . The latter were selected to be identical at 40 GeV and 158 GeV. Thus only insignificant differences of are observed between both energies except for the 10% discrepancy in the most peripheral centrality interval which we attribute to the slightly different online trigger conditions. Table 1 summarizes these numbers together with the number of analyzed events. For convenience we quote here the centrality of the C+C and Si+Si collisions at 158 GeV na49_size which are used for comparison in this paper: the most central 15.3% (2) and 12.2% (3), respectively.
| Class | Centrality | |||
|---|---|---|---|---|
| (GeV) | (%) | |||
| 40 | C+C | 0-66 | 8.8 1.1 | 135 |
| 40 | Si+Si | 0-29 | 30.5 3.5 | 65 |
| 40 | C0 | 0-5 | 356 1 | 13 |
| 40 | C1 | 5-12.5 | 292 2 | 23 |
| 40 | C2 | 12.5-23.5 | 212 3 | 34 |
| 40 | C3 | 23.5-33.5 | 144 4 | 33 |
| 40 | C4 | 33.5-43.5 | 93 7 | 32 |
| 158 | C0 | 0-5 | 357 1 | 15 |
| 158 | C1 | 5-12.5 | 288 2 | 24 |
| 158 | C2 | 12.5-23.5 | 211 3 | 37 |
| 158 | C3 | 23.5-33.5 | 146 4 | 35 |
| 158 | C4 | 33.5-43.5 | 85 7 | 35 |
The recorded Pb+Pb events are contaminated by background due to non-target interactions. This contamination was minimized by cuts on the fitted vertex position and the quality of the fit. It is negligible for near central collisions and amounts to less than 5% for the most peripheral collisions (see ALaszlo ). Similar cuts were applied to the C+C and Si+Si collision events. Details for the latter are given in Table 4.1 of Benjamin_diploma .
The track finding efficiency and resolution were optimized by track quality criteria, some of which are different for pions and kaons. These criteria are meant to select phase space regions with low track densities, where the background and efficiency corrections are small and approximately uniform. Only those particles were considered for which the transverse momentum kick due to the magnetic field points into the same direction as the azimuthal angle projected onto the deflection plane. In addition the number of reconstructed points on the particle track had to exceed 50% of all measurable points. Further track cuts on azimuthal angles with respect to the bending plane and for a minimum of measured and/or measurable points are meant to obtain high quality track samples. These track cuts were chosen differently for different particle species and data samples to optimize phase space coverage: For negatively charged hadrons and kaons azimuthal angles within 30 degrees with respect to the bending plane were selected except for kaons in the C+C and Si+Si events where 45 degrees were allowed to enhance statistics. Tracks of negatively charged hadrons in C+C and Si+Si events were required to have at least 10 potential points in the TPCs, while in Pb+Pb events a minimum of 30 measured points was asked for. Kaon tracks in C+C and Si+Si events had to have a minimum of 50 measured points in all TPCs and at least 1 potential point in the VTPCs. In Pb+Pb events they were required to have a minimum of 50 measured points in the MTPCs and at least 1 measured point in the VTPCs, if the number of measurable points was larger than 10. Finally kaon candidate tracks in the sample of Pb+Pb events were required to point to the main interaction vertex with a precision of 2 cm in the - (bending) and 1 cm in the -direction.
While kaon spectra were determined by means of particle identification, pion spectra were obtained by subtracting from all negatively charged particles the contributions from electrons, kaons, and anti-protons (see below). Kaons were identified using the energy loss () information from the TPCs and time-of-flight measurements in the phase space covered by the TOF walls. For the analysis based on information alone, raw yields of K+ and K- were extracted from fits to the distributions in bins of laboratory () momentum (11 bins from 5 to 50 GeV in logarithmic scale for the 158 GeV data set and 10 bins from 4 to 32 GeV in logarithmic scale for the 40 GeV data set), and of transverse momentum () in 20 bins from 0 to 2 GeV/ in linear scale. See p-ap_paper for a detailed description of the fitting method. The energy loss information from the MTPCs (VTPCs and MTPCs) was used in the analysis of minimum bias Pb+Pb (C+C and Si+Si) collisions. Bins with less than 500 particles were not used in the further analysis to ensure sufficient statistics for the fits to the distributions. This cut limits the accessible range in to values below 1 to 1.5 GeV depending on . The phase space in and thus the acceptance in rapidity is limited by the fact that only for momenta from = 4 GeV/ to = 50 GeV/ the mean energy loss of kaons is sufficiently separated from those of pions and protons to allow for the extraction of their yield by unfolding of the distributions. This restriction limits the acceptance of kaons to forward rapidities. The resulting distributions were corrected for geometrical acceptance, in-flight decay of kaons, and reconstruction efficiency. The first two corrections were determined by detector simulations using GEANT geant . The reconstruction efficiency is track density dependent only for Pb+Pb collisions. It was shown earlier na49_size that the corrections are negligible for C+C and Si+Si interactions. The correction factor was determined by embedding simulated tracks into real events in three centrality bins ranging from (0-12.5) %, (12.5-33.5) %, and %. Track losses are of order (5-10) % for central collisions at 158 GeV and drop to only (1-2) % in the most peripheral collisions and for 40 GeV beam energy. Systematic errors were determined by varying track selection criteria and the parameters in the unfolding procedure. In particular we decreased the minimum number of measured points from 50 to 30 and used an azimuthal cut of 50 instead of 30 degrees. The asymmetry parameter in the unfolding procedure, which accounts for the asymmetry of the distributions of the truncated mean (for details see p-ap_paper ), was varied within the limits 0.6 and 0.8. Different combinations of these parameter settings resulted in the systematic errors indicated in Tables II and III. The spectra at mid-rapidity were obtained using the combined and TOF information (Pb+Pb only; statistics were not sufficient for C+C and Si+Si). The distributions of calculated from the recorded time of flight ( ps) were parametrized in bins of laboratory momentum as the sum of three Gaussians for pions, kaons and protons plus exponential tails stemming from unresolved double hits or coincidence with conversion in the scinitillators. For laboratory momenta below 2.5 GeV, this measurement is sufficient to separate kaons from pions and protons with high efficiency (%) and high purity (%). For higher momenta, the independent measurements of time of flight and specific energy loss are used simultaneously. In the two-dimensional plane of and , kaons were identified by an elliptical region centred at the expectation values and with half-axes equal to and , respectively. In addition, regions where the local kaon contribution, according to the parametrisations of and , is below 0.7 were excluded. Each track in the kaon identification area entered the transverse monentum spectrum with a specific weight accounting for the efficiency of particle identification and for the efficiency of the time-of-flight detector. The identification efficiency is defined by the ratio of the integral of the two-dimensional kaon distribution in and inside the identification area to its total integral. It does not depend on the centrality class and is determined as function of track momentum. For the kaon identification employed here, the efficiency is about 95% and varies only slightly with momentum. The contamination by pions and protons is below 1% for all momenta and is not corrected for. Efficiency losses of the time-of-flight detectors are caused by multiple hits in one scintillator and quality cuts on the deposited charge. They were determined from the data themselves for each channel and in each centrality class separately. The average efficiency is 82% and varies slightly with centrality. Finally, the transverse mass spectra were corrected for the geometrical acceptance and the in-flight kaon decay, which was obtained by a detector simulation with GEANT.
The separation of negatively charged pions from kaons and anti-protons in the acceptance of the NA49 detectors by means of the energy loss measurement is limited to high transverse momenta ( larger than 500 MeV/ at mid-rapidity and larger than 200 MeV/ at =1 for 158 GeV beam energy). Therefore a different method was chosen for the evaluation of production (see na49_20-30 ). Yields of all negatively charged hadrons (h- from the primary vertex were extracted in bins of rapidity and assuming the pion mass. The contamination by K-, e-, and by particles from the decay of strange particles and from secondary interactions, both reconstructed at the primary vertex, was estimated by simulation and subtracted. The calculation of theses corrections is based on events generated by the VENUS model venus , propagated through the NA49 detector using GEANT, and processed by the standard reconstruction chain. The ratio of reconstructed to all simulated particles yields correction factors in all bins of rapidity and which account for all background tracks in the negatively charged hadron yields. Care was taken to account for differences between simulated and measured hadron yields by appropriate scaling factors. These were obtained from a comparison of the simulated yields with measured data. Where measured yields are not available, particle ratios from statistical model calculations were used to infer the corresponding yields. In general distributions of background particle from VENUS events were scaled by a global factor. The largest corrections to the pion yields arise from K- in Pb+Pb collisions (158 GeV) at high (30% for 1.2 GeV/) where pion yields are low and kaons prevail. The K- distributions were therefore scaled differentially (and iteratively) in rapidity and in order to reproduce the shapes of the measured spectra. The differences in the correction factors on the negatively charged particles from K- was found to be in the range of 1-3%. As this is a very small change, we found it justified to use global factors for the other contributions. At mid-rapidity and low ( 0.1 GeV) corrections amount to 30% - 40% due to contributions from (secondary) electrons (158 GeV). This large correction requires a careful evaluation as the contribution relies fully on the GEANT calculation. We therefore identified and removed electrons from the track samples in both the simulation and in the data (for the latter based on measurements). Results agree within 5% - 10% in the corresponding bins of rapidity and transverse momentum and within 2% - 3% for the overall pion yield. For the overall evaluation of systematic errors on the pion yield we performed further analyses with different track selection parameters (minimum of 50 instead of 30 measured points), reversed magnetic field, and a different data set with slightly varied settings for the online selection of minimum bias events. Variations of the pion yield are less than 5% in centrality bins C0-C3 and 10% in bin C4. This higher error in the latter bin is due to the uncertainty of the event selection for the most peripheral bin. In C+C and Si+Si collisions at 40 GeV were analyzed with both methods (h- and ). The differences were found to be below 5%.
The subtraction method is not well suited for the determination of the yields at our energies, because positively charged particles have a large contribution of protons. However, for Pb+Pb collisions yields at mid-rapidity and full phase space can be inferred using the feed-down corrected ratio from the combined and TOF analysis in an acceptance which is a banana shaped region in the rapidity- plane within MeV and MeV and ) at 40 GeV (158 GeV). This method relies on the assumption that the and rapidity distributions of and have the same shapes. In VENUS events this assumption leads to differences of 2% between the direct and scaled multiplicities. The extracted ratios are and at 158 GeV and 40 GeV beam energies, respectively and are subject to a 4% systematic uncertainty, which is derived from the difference between two different methods (see na49_energy and na49_20-30 ). We assume that this ratio is centrality independent. For C+C and Si+Si collisions the ratios were determined at 158 GeV beam energy (0.99 and 1.02) in na49_size . We use these same values at 40 GeV. More details on the analysis of minimum bias Pb+Pb collisions can be found in peter_phd . The C+C and Si+Si analyses of pion and kaon yields at 40 GeV are described in Benjamin_diploma and Michael , respectively.
IV Results
IV.1 Transverse mass spectra
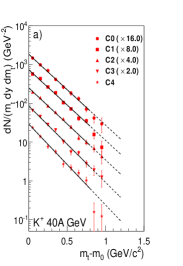
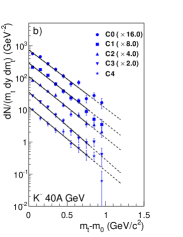
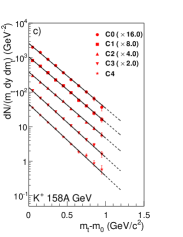
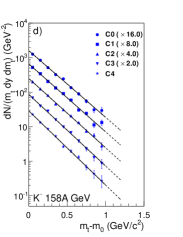
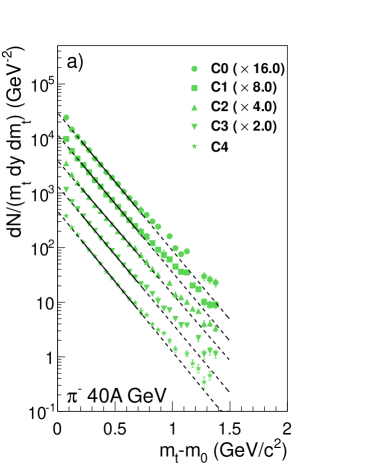
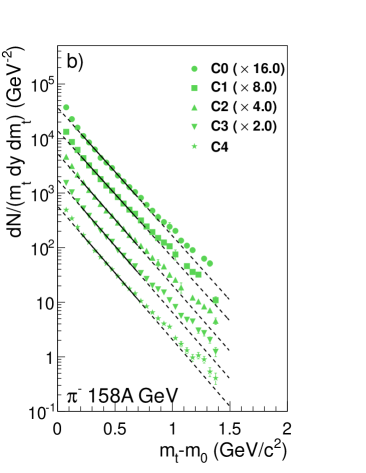
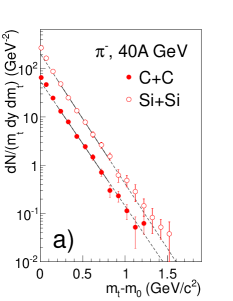
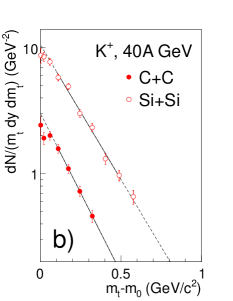
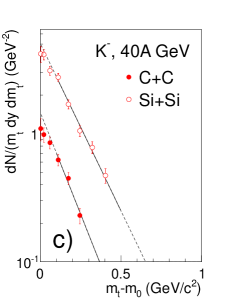
Transverse mass spectra at mid-rapidity are shown in Figs. 1 and 2 for kaons (combined and TOF analysis) and pions for different centrality classes in Pb+Pb collisions at 40 GeV and 158 GeV beam energy. Fig. 3 presents results for kaons and pions near mid-rapidity in C+C and Si+Si collisions at 40 GeV. The spectra ( ) were fitted by an exponential function with inverse slope
| (1) |
in ranges as given in the figure captions. In Pb+Pb collisions the transverse mass spectra of kaons are well described by this functional form, while pion spectra deviate at high and low transverse masses. The spectra of kaons in the light systems exhibit a two to three times statistical error downward deviation at low . For a model independent study of the transverse mass spectra, the average transverse mass was therefore calculated. To account for the small unmeasured high part of the kaon spectra, which is on a percent level only, the spectra were extrapolated by the exponential functions shown in Figs. 1 and 3. For the pion spectra in Pb+Pb collisions an exponential function with two slope parameters was used (not shown), to account for the concave shape of the distributions (in logarithmic representation). An estimate of systematic errors was derived from using different fit ranges for the extrapolation or a single exponential for pions. The resulting average transverse masses and inverse slope parameters are summarized in Tables 2, 3, and 4. Figure 4 shows the dependence of on the mean number of wounded nucleons for the investigated collision systems at 40 GeV and 158 GeV beam energy. Results from central Pb+Pb na49_energy ; na49_20-30 , p+p at 158 GeV/ Fischer_K , C+C and Si+Si collisions na49_size at 158 GeV are also shown.
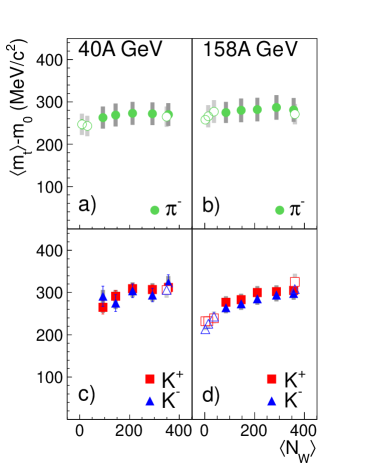
Owing to the mass difference and well known radial flow effect, values are larger for kaons than for pions. For central collisions na49_energy ; na49_20-30 mean transverse masses do not change significantly from 40 GeV to 158 GeV. For pions, if any, only a weak centrality dependence is observed at 40 GeV and none at 158 GeV beam energy, while kaons show an increase of mean transverse masses towards central Pb+Pb collisions. This increase is particularly pronounced when comparing to the much smaller C+C and Si+Si collision systems with .
IV.2 Rapidity spectra
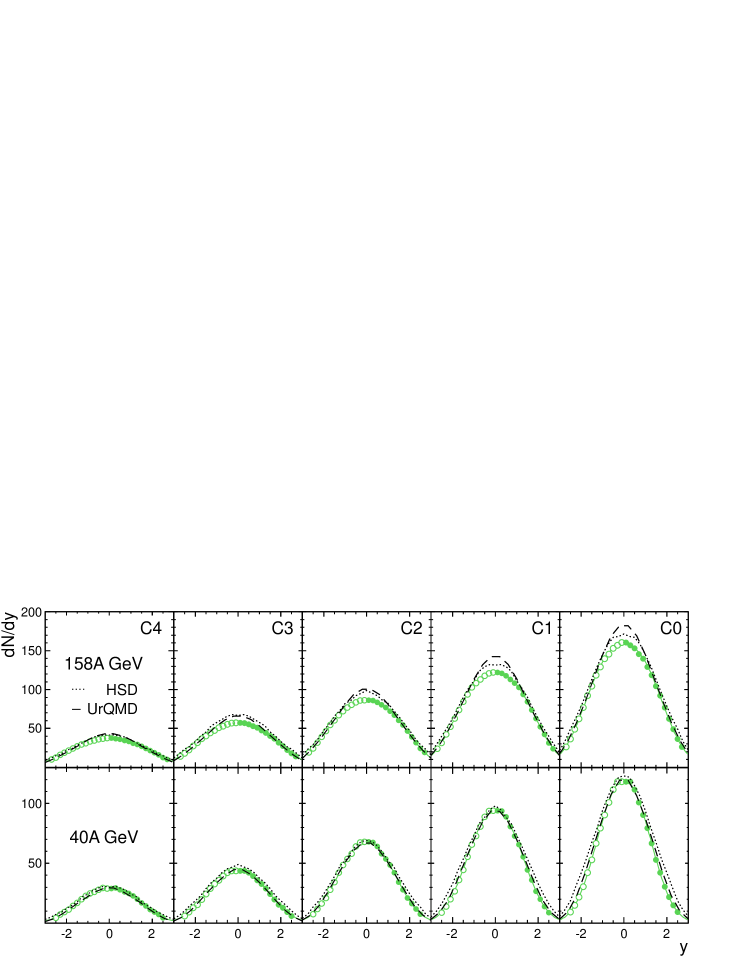
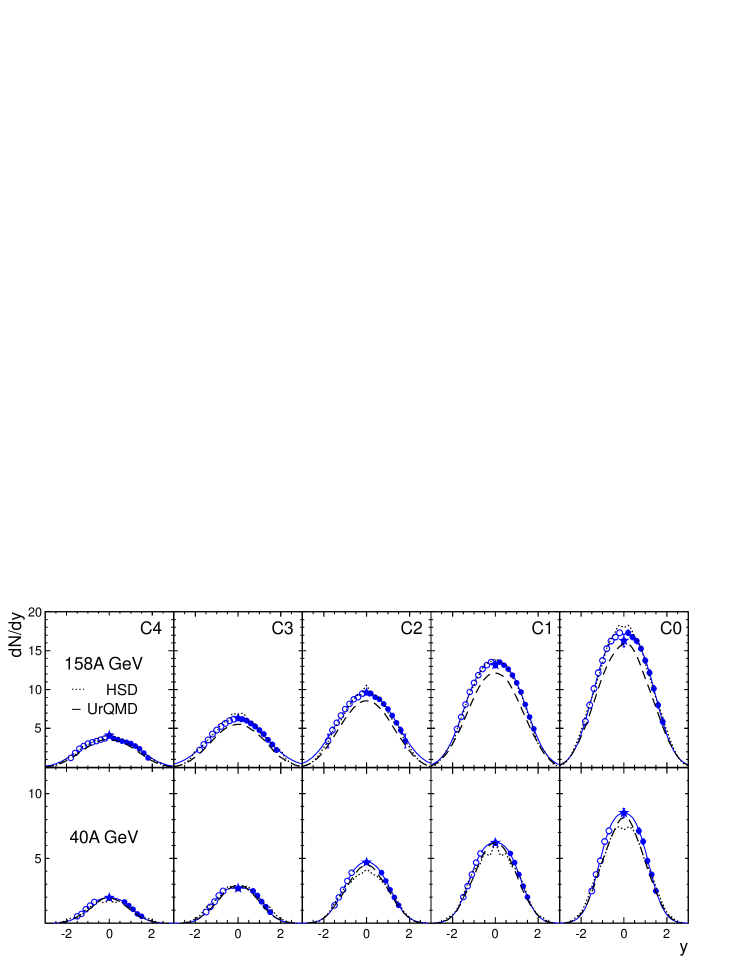
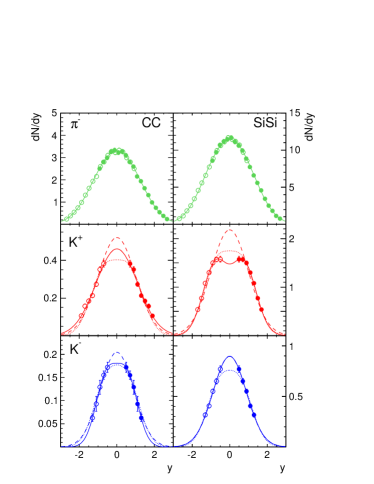
Transverse momentum spectra were measured in bins of rapidity in order to extract the rapidity dependence of -integrated yields. The measured -spectra were extrapolated into unmeasured regions by a single exponential for both kaons and pions in C+C and Si+Si interactions. A double exponential had to be used for pions in Pb+Pb collisions because of the concave shape of their -spectra. Rapidity distributions of -integrated yields for the particles, collision systems and energies under study are shown in Figs. 5, 6, 7, and 8. They are well described by two Gaussians of equal widths which are displaced symmetrically around mid-rapidity by a constant :
| (2) |
Using this functional form the measured rapidity spectra can be extrapolated into the unmeasured regions, and particle yields in full phase space can be extracted. For C+C and Si+Si collisions at 40 GeV beam energy no combined and TOF measurement is available at mid-rapidity. The resulting uncertainties in the shapes and integrals of the rapidity distributions of kaons were evaluated by applying three different fit functions (Eq. 2): with two free parameters ( and ), with these parameters fixed to values obtained from fits to the corresponding distributions from central Pb+Pb collsions at 40 GeV, and with a single Gaussian with its root mean square (RMS) again taken from the 40 GeV Pb+Pb data. These fits are indicated in Fig. 8 by the solid, short-dashed and dashed lines and were used to extrapolate into the unmeasured rapidity regions. Differences in the total yields between extremes are not exceeding 12% and are included in the systematic errors. The quoted total and mid-rapidity yields are the means of the values obtained from the three fits.
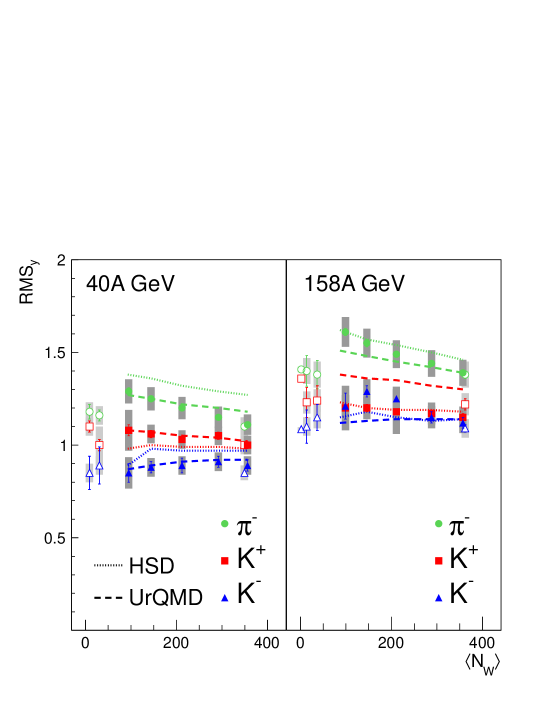
The widths of the rapidity distributions are quantified by . These values are tabulated together with mid-rapidity and full phase space yields in Tables 2, 3 and 4. Figure 9 presents the system-size dependence of the widths of the rapidity distributions. While kaons show no significant change of the width as a function of the number of wounded nucleons, rapidity distributions of pions are significantly wider in peripheral than in central Pb+Pb collisions. In fact, it turns out that the width of the pion rapidity distribution in central Pb+Pb collisions is the same as in C+C and Si+Si reactions as well as in p+p interactions at 158 GeV. Only non-central Pb+Pb collisions deviate from this common behavior exhibiting a wider distribution. The widening of the pion rapidity distribution for peripheral collisions is probably due to pion production in interactions of participants with spectator matter which had been already invoked to explain the proton rapidity spectra in the same data sets Milica .
IV.3 Particle yields
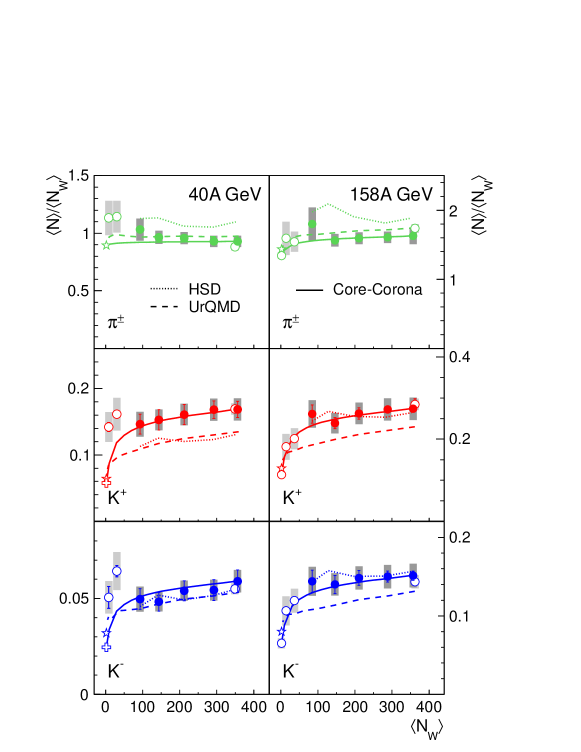
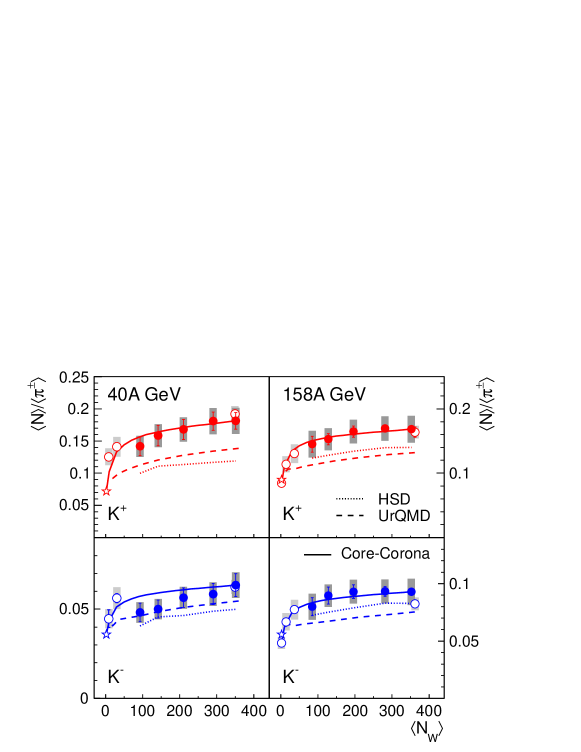
Fig. 10 shows the system-size dependence of particle yields normalized to the mean number of wounded nucleons. Earlier data on central C+C, Si+Si and Pb+Pb collisions are plotted as well na49_size ; na49_energy ; na49_20-30 . Data for p+p collisions are taken from NA49 where available Fischer_pi ; Fischer_K and from parametrizations by Rossi et al. rossi . At 40 GeV we include results from a new study of the energy dependence of kaon production reported in Fischer_K . Also shown are calculations by the HSD HSD and UrQMD2.3 UrQMD transport models, as well as by the core-corona model (the latter for the Pb+Pb collision system only, see also Fig. 12) blume . Normalized pion yields are rather independent of centrality or system size while the normalized yields of kaons show a steep increase for small system sizes followed by a slow rise or even saturation for higher centralities. The mean number of wounded nucleons () introduces a model dependence in these ratios, in particular for small systems, as for the semi-central C+C and Si+Si collisions the calculations have large uncertainties. Yields are therefore alternatively normalized to the number of pions. In Fig. 11 these ratios are presented. Normalized kaon yields at both energies exhibit the same dependence as seen in Fig. 10. A closer look reveals that at 158 GeV the K/ ratios in the small collision systems C+C and Si+Si seem to follow the trend set by the centrality dependence of the Pb+Pb data, whereas at 40 GeV the normalized kaon abundance in peripheral Pb+Pb collisions is lower than expected from the extrapolation of the K/ ratio in C+C and Si+Si collisions.
V Discussion
V.1 Comparison to transport models (HSD and UrQMD)
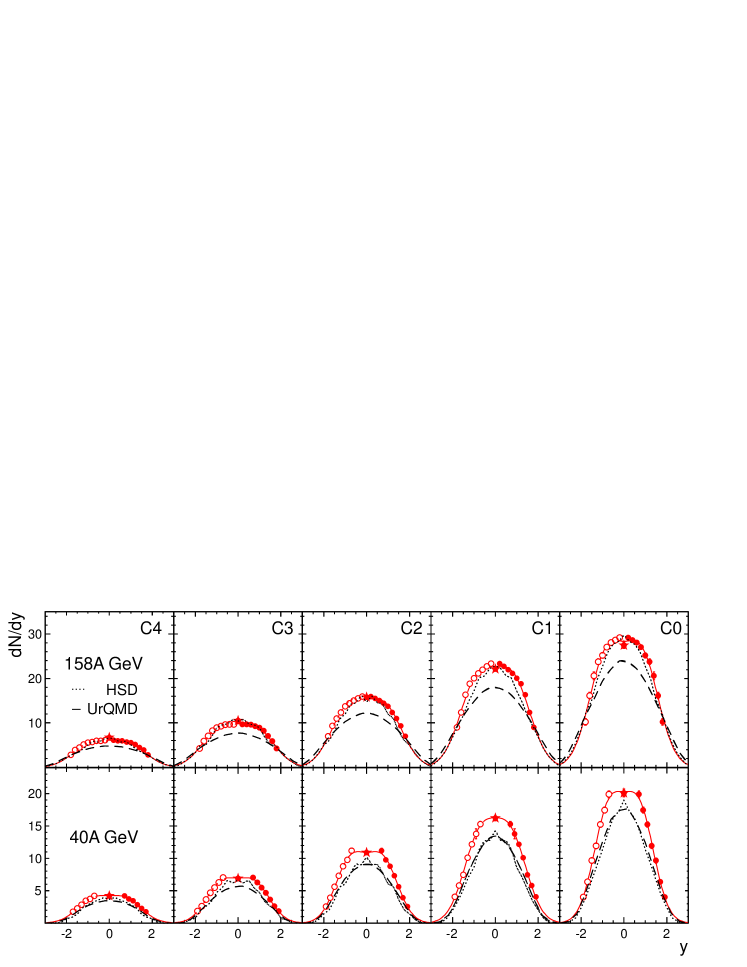
The centrality of the events generated by the models was derived from the corresponding fraction of the total (geometrical) cross section with the impact parameter as order parameter. The corresponding values were those derived from the experimental data for HSD. For the UrQMD events the number of nucleons in the nuclear overlap volume was calculated event-by-event based on the chosen impact parameter. Pion rapidity distributions (Fig. 5) are well reproduced by both models at 40 GeV, whereas their predictions give slightly higher yields than the data at 158 GeV. For K+ mesons (Fig. 6) the distributions from both models are 20% low at 40 GeV. For kaons at 158 GeV HSD calculations agree well with experiment, whereas UrQMD2.3 underestimates our data. The overall agreement betweeen model calculations and data for the K- mesons (Fig. 7) is generally good for both models, even though there is a small underestimation of the data by UrQMD2.3 at 158 GeV and by HSD at 40 GeV. No model data were provided for comparison to our C+C and Si+Si data. As to the shapes of the rapidity distributions both models describe well the increase of RMSy with increasing impact parameter at both energies (Fig. 9). This increase is most (least) pronounced for the pions (K-). We interpret this rise as due to interactions of fireball particles with spectator remnants.
Normalized multiplicities are studied in Figs. 10 and 11. / for pions is reproduced by UrQMD2.3 at both energies. HSD is 10% high, which is due to larger widths rather than higher amplitudes of the corresponding distributions (cf. Fig. 5). We now turn to the normalized yields of the K+ meson. At 40 GeV the results from both models are low by 20%. At 158 GeV HSD results agree with our data, wheras UrQMD2.3 results underpredict them. The K- yields are well desribed by both models at 40 GeV. At 158 GeV K- mesons yields are reproduced by HSD, whereas they are underpredicted by UrQMD2.3 as was the case for K+ yields. The calculations of both models for the kaon to pion ratios yield values which are lower than the experimental data at both energies (see Fig. 11), although for different reasons. While UrQMD2.3 mainly underpredicts the kaon yields, HSD overpredicts the pions yields (see Figs. 10).
V.2 Transverse mass distributions and thermal freeze-out
Both the thermal freeze-out temperature and radial flow affect the observed distributions of produced particles. The centrality dependence of (near mid-rapidity), which is shown in Fig. 4, exhibits a clear trend of an increase of with centrality (for Pb+Pb) and system size (p+p and light versus heavy systems), which is most pronounced for kaons of both charges at 158 GeV. This finding is consistent with the picture that nuclear stopping and thus energy deposition increases with increasing centrality and from small to large collision systems, giving rise to higher temperatures or collective radial flow or both.
V.3 System size dependence of the K/ ratio
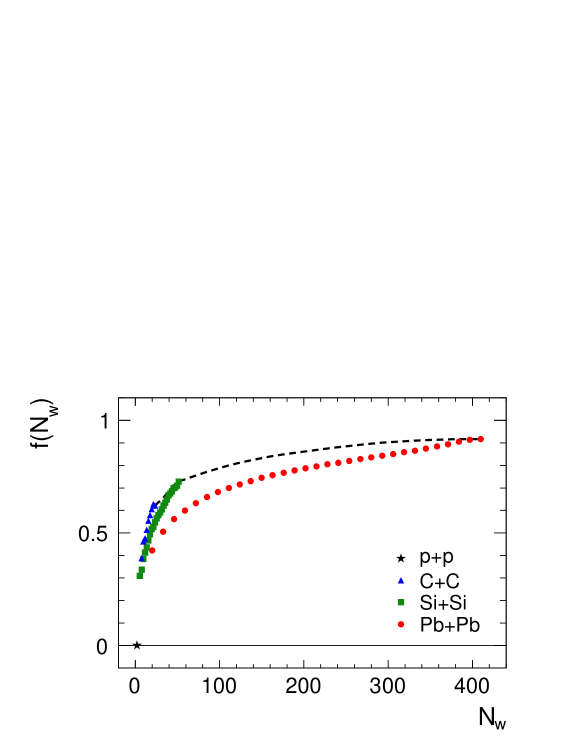
The system size dependence of the K/ ratios (see Fig. 11) hints at a behavior expected for the core-corona ansatz blume . However at 40 GeV there are significant deviations of the core-corona calculations from the experimental data. In peripheral Pb+Pb collisions the data tend to be below the model values, most pronounced for K-, and the ratios measured for the small collision system (C+C and Si+Si) tend to be above the values calculated for the Pb+Pb system. The latter finding is in line with the model prediction for different system sizes as shown in Fig. 12. It shows the core fraction obtained in the core-corona model for different collisions systems as function of the number of participating nucleons blume . Central collisions of small projectiles reach their maximum already for smaller volumes (number of wounded nucleons) than heavy systems like Pb+Pb. At 158 GeV (see right column of Fig. 11) the data points from peripheral Pb+Pb collisions follow nicely the core-corona prediction for the Pb+Pb system. Also the C+C and Si+Si points are consistent with this prediction (for Pb+Pb), although according to Fig. 12 they should be higher even for non-central collisions of the small C+C and Si+Si systems. However, here the core-corona approach is applied to small system sizes for which the simplification of separating the collision zone into one central cluster and p+p collisions in the periphery might not be valid anymore. Instead, percolation calculations suggest that for such collision systems several clusters of smaller size will be formed percolation .
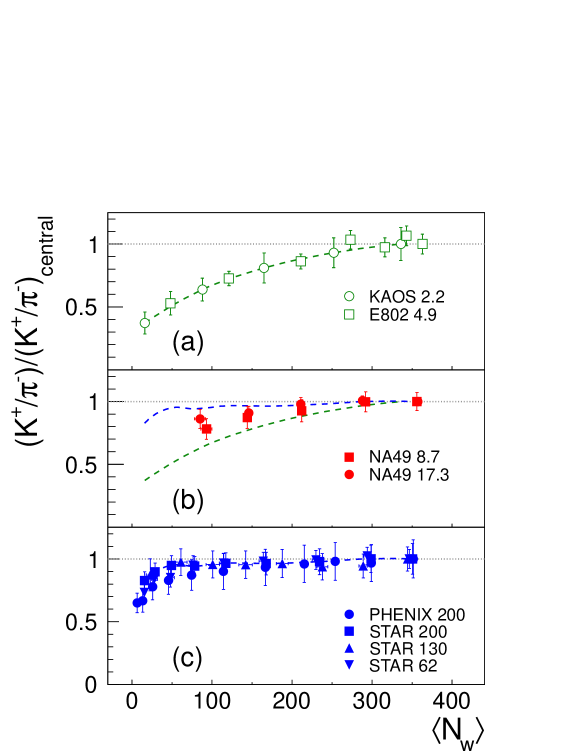
In Fig. 13 we summarize the K+/ ratios for centrality selected Au+Au (Pb+Pb) collisions at different beam energies. The ratios at the different centralities were scaled to the ratios measured in the most central collisions. The observed saturation of strangeness production at SPS energy and above can be understood in the context of statistical models by the approach to a grand-canonical description. Increasing the energy available for particle production does no longer change the multiplicities of strangeness carrying particles relative to pions na49_energy ; na49_20-30 , which means that strangeness becomes fully saturated. Saturation already sets in for rather peripheral collisions. The reduction of relative strangeness production towards even smaller system sizes has been discussed in the framework of the core-corona model in the previous paragraph. An implementation of this ansatz into the statistical model and a detailed comparison of model calculations to RHIC data can be found in becattini . In order to describe the data satisfactorily it is essential to use a volume dependence which is not just proportional to . The situation is different at low (SIS) energies. Here the K+/ ratio does not saturate and its dependence on the number of wounded nucleons is rather linear. In contrast to the situation at high energies, statistical models can describe the observed centrality dependence at low energy within a canonical ensemble and with a volume proportional to the number of wounded nucleons Cle98 . Such a behavior would also be expected in a hadronic rescattering scenario as realized in microscopic models Wang . The results obtained at 40 GeV are intermediate between those at top SPS and AGS energies. We thus observe a smooth transition between both scenarios which occurs in the SPS energy region.
V.4 as function of system size
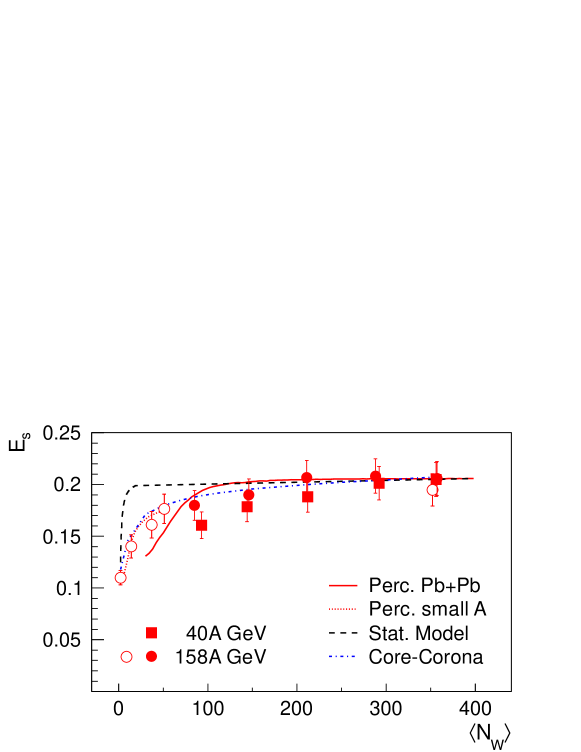
The strangeness to entropy ratio or total relative strangeness production described by the Wroblewski factor can be approximated by the measurable quantity = na49_energy . The data presented in this paper combined with earlier ones published in na49_multis ; na49_size allow to study the dependence of on system size for 40 GeV and 158 GeV beam energy with the 158 GeV data covering the whole range of possible sizes. This dependence is shown in Fig. 14 and can now be compared directly to the dependence obtained from statistical model calculations assuming for simplicity that , with being the canonical strangeness suppression factor, see for example Refs. rafelski-danos ; redlich . In statistical models the relative strangeness production depends on the volume of the ensemble. Assuming naively that the volume is proportional to the number of wounded nucleons (rafelski-danos ; redlich ) yields an increase of relative strangeness production (dashed line in Fig. 14) which is significantly steeper than the increase observed in the data. On the other hand, the smooth rise of with system size and the saturation around 60-100 wounded nucleons is reproduced within experimental errors by a percolation model percolation . In this model the volumes relevant for strangeness production by statistical hadronization are calculated within a percolation ansatz. This yields several smaller clusters in collisions of light nuclei or in peripheral Pb+Pb collisions, and a large cluster accompanied by small clusters (p+p interaction like) in the periphery for central Pb+Pb collisions. The latter finding justifies the simplified ansatz used in the core-corona approach, which is shown by the dash-dotted line. The functional dependences change slightly between light and heavy nuclei (dotted and solid lines in Fig. 14), both describing the data at 158 GeV beam energy well. The Pb+Pb data show a weaker increase at 40 GeV than at 158 GeV.
VI Summary
The NA49 collaboration measured the rapidity and transverse mass distributions of kaons and pions in Pb+Pb collisions at different centralities. These data are complemented by results from the small systems C+C and Si+Si. We find that the centrality dependence of kaon and pion production is reproduced by microscopic transport model calculations (HSD and UrQMD2.3) within 20% or better. The mean transverse mass evolves with centrality as expected for increased stopping and energy deposition. The centrality dependence of the widths of the rapidity distributions in Pb+Pb collisions does not smoothly connect to results from the small systems p+p, C+C, and Si+Si. We attribute this behavior to reinteractions of produced particles with spectator remnants, which is possible only in the heavy collision system. In Pb+Pb collisions the K/ ratios show a smooth increase with centrality at both beam energies with saturation setting in around 100-200 (60-100) wounded nucleons for 40 GeV (158 GeV). In particular at 40 GeV beam energy the ratios measured in C+C and Si+Si collisions tend to be higher than the ratios in peripheral Pb+Pb interactions. The strong rise for small systems can be understood in the framework of statistical models, if the relevant volume is not proportional to the number of participants but is a superposition of relatively small subvolumes for small system sizes and one large volume in central collisions accompanied by p+p like interactions in the corona.
| Centr. | ||||||
|---|---|---|---|---|---|---|
| class | MeV/c2 | MeV | ||||
| 0 | 158.8 0.7 16 | 602 4.7 42 | 1.39 0.01 0.07 | 281 2 28 | 184 2 9 | |
| 1 | 121.4 0.6 8.5 | 480 4.5 29 | 1.44 0.01 0.07 | 287 2 28 | 187 1 9 | |
| 2 | 86.2 0.5 4.3 | 349 4.2 17 | 1.49 0.01 0.08 | 282 2 28 | 180 1 9 | |
| 3 | 57.2 0.4 2.9 | 237 3.8 12 | 1.55 0.02 0.08 | 280 2 28 | 178 2 9 | |
| 4 | 37.2 0.3 1.9 | 159 3.4 7.9 | 1.61 0.02 0.08 | 275 228 | 177 2 9 | |
| K+ | 0 | 28.35 0.432.9 | 97.8 3 9.8 | 1.15 0.02 0.06 | 305 6 15 | 232 3 12 |
| 1 | 22.72 0.31 2.3 | 78.5 2.8 7.8 | 1.17 0.02 0.06 | 302 5 15 | 229 3 12 | |
| 2 | 15.86 0.23 1.6 | 57.1 2.9 5.7 | 1.18 0.02 0.06 | 300 5 15 | 227 2 12 | |
| 3 | 10.01 0.17 1.0 | 34.9 2 3.5 | 1.21 0.02 0.06 | 283 6 14 | 215 3 11 | |
| 4 | 6.39 0.13 0.6 | 23.2 1.9 2.3 | 1.22 0.02 0.06 | 277 7 14 | 209 3 11 | |
| K- | 0 | 16.8 0.43 1.7 | 53.95 2.15 4.3 | 1.12 0.03 0.06 | 298 9 15 | 225 5 11 |
| 1 | 13.38 0.24 1.3 | 43.18 2.03 3.5 | 1.15 0.03 0.06 | 294 7 15 | 221 4 11 | |
| 2 | 9.54 0.17 0.9 | 31.32 2.03 2.5 | 1.25 0.1 0.06 | 285 8 14 | 217 3 11 | |
| 3 | 6.26 0.12 0.6 | 20.45 1.69 1.6 | 1.29 0.03 0.07 | 273 8 14 | 210 4 11 | |
| 4 | 3.92 0.11 0.4 | 12.24 1.18 1.2 | 1.21 0.07 0.06 | 264 10 13 | 202 5 10 |
| Centr. | ||||||
|---|---|---|---|---|---|---|
| class | MeV/c2 | MeV | ||||
| 0 | 118 0.6 12 | 348 2.4 17.4 | 1.11 0.01 0.06 | 270 3 27 | 172 3 9 | |
| 1 | 93.8 0.5 9.4 | 286 2.4 14.3 | 1.15 0.01 0.06 | 272 3 27 | 172 3 9 | |
| 2 | 67.8 0.4 6.8 | 214 2.4 10.7 | 1.19 0.01 0.06 | 273 2 27 | 178 2 9 | |
| 3 | 43.7 0.3 4.4 | 146.3 2.2 7.3 | 1.25 0.01 0.06 | 269 3 27 | 172 3 9 | |
| 4 | 29.1 0.2 2.9 | 101.1 1.9 10 | 1.29 0.01 0.06 | 2633 26 | 168 3 9 | |
| K+ | 0 | 20.1 0.6 1.9 | 60.0 4.7 4.8 | 1.00 0.02 0.05 | 312 13 15 | 238 7 12 |
| 1 | 16.2 0.4 1.5 | 49.1 4.3 3.9 | 1.05 0.02 0.05 | 307 11 15 | 238 6 12 | |
| 2 | 10.9 0.3 1.0 | 34.2 3.5 2.7 | 1.03 0.01 0.05 | 309 12 15 | 234 6 12 | |
| 3 | 6.9 0.2 0.7 | 22.0 2.8 1.7 | 1.06 0.02 0.05 | 291 14 15 | 221 7 11 | |
| 4 | 4.2 0.2 0.4 | 13.6 2.3 1.4 | 1.08 0.03 0.05 | 265 16 13 | 208 9 11 | |
| K- | 0 | 8.5 0.30.7 | 21.0 3.1 2 | 0.89 0.03 0.05 | 323 19 15 | 239 10 12 |
| 1 | 6.2 0.20.5 | 15.9 2.7 1.3 | 0.91 0.03 0.05 | 294 16 15 | 231 9 12 | |
| 2 | 4.7 0.20.4 | 11.4 2.3 0.9 | 0.89 0.04 0.05 | 304 16 15 | 227 8 12 | |
| 3 | 2.7 0.1 0.2 | 7.0 1.8 0.6 | 0.88 0.03 0.05 | 275 20 14 | 207 10 11 | |
| 4 | 2.0 0.10.2 | 4.6 1.5 0.5 | 0.85 0.04 0.05 | 291 24 15 | 219 14 11 |
| Collision | ||||||
|---|---|---|---|---|---|---|
| MeV/c2 | MeV | |||||
| C+C | 3.25 0.06 | 10.0 1.4 | 1.18 0.04 0.1 | 247 11 25 | 169 8 9 | |
| Si+Si | 11.40 0.19 | 34.6 2.7 | 1.16 0.03 0.1 | 243 10 24 | 162 6 9 | |
| K+ | C+C | 0.46 0.06 | 1.26 0.78 | 1.10 0.11 0.15 | ||
| Si+Si | 1.82 0.30 | 5.1 1.2 | 1.01 0.15 0.15 | |||
| K- | C+C | 0.19 0.02 | 0.44 0.4 | 0.80 0.080.12 | ||
| Si+Si | 0.87 0.07 | 2.0 1.0 | 0.89 0.090.12 |
Acknowledgements.
Acknowledgements: This work was supported by the US Department of Energy Grant DE-FG03-97ER41020/A000, the Bundesministerium fur Bildung und Forschung (06F 137), Germany, the Virtual Institute VI-146 of Helmholtz Gemeinschaft, Germany, the Polish Ministry of Science and Higher Education (1 P03B 006 30, 1 P03B 127 30, 0297/B/H03/2007/33, N N202 078735, N N202 204638 ), the Hungarian Scientific Research Foundation (T032648, T032293, T043514), the Hungarian National Science Foundation, OTKA, (F034707), the Bulgarian National Science Fund (Ph-09/05), the Croatian Ministry of Science, Education and Sport (Project 098-0982887-2878) and Stichting FOM, the Netherlands.References
- (1) J. Rafelski and B. Müller, Phys. Rev. Lett. 48, 1066 (1982).
- (2) S.V. Afanasiev et al., (NA49 Collaboration) Phys. Rev. C 66, 054902 (2002).
- (3) C. Alt et al., (NA49 Collaboration) Phys. Rev. C 77, 024903 (2008).
- (4) A. Andronic, P. Braun-Munzinger, J. Stachel, Phys. Lett. B 673, 142 (2009).
- (5) C. Amsler, et al., Particle Data Group, Phys. Lett. B 667 (2008) 1.
- (6) T. Anticic et al., (NA49 Collaboration) Phys. Rev. C 80, 034906 (2009).
- (7) T. Anticic et al., (NA49 Collaboration) Phys. Rev. C 83, 014901 (2011).
- (8) C. Alt et al., (NA49 Colaboration) Phys. Rev. Lett. 94, 052301 (2005).
- (9) C. Alt et al., (NA49 Collaboration) Eur. Phys. J. C 45, 343 (2006).
- (10) T. Anticic et al., (NA49 Collaboration) Eur. Phys. J. C 68, 1 (2010).
- (11) A. Förster et al., J. Phys. G 31, S693 (2005).
- (12) L. Ahle et al., Phys. Rev. C 60, 044904 (1999).
- (13) F. Wang, H. Liu, H. Sorge, N. Xu, and J. Yang Phys. Rev. C 61, 064904 (2000).
- (14) S.S. Adler et al., (Phenix Collaboration) Phys. Rev. C 69, 034909 (2004).
- (15) B.I. Abelev et al., (STAR Collaboration) Phys. Rev. C 79, 034909 (2009).
- (16) F. Becattini, M. Gaździcki, A.Kerȧnnen, J. Manninen, and R. Stock, Phys. Rev. C 69, 024905 (2004).
- (17) F. Becattini, J. Manninen, M. Gaździcki, Phys. Rev. C 73, 044905 (2006).
- (18) J. Rafelski and M. Danos, Phys. Lett. B 97, 279 (1980).
- (19) A. Tounsi and K. Redlich, J. Phys. G: Nucl. Part. Phys. 28, 2095 (2002).
- (20) J. Cleymans, H. Oeschler, and K. Redlich, Phys. Rev. C59 1663, (1999).
- (21) C. Höhne, F. Pühlhofer and R. Stock, Phys. Lett. B 640, 96 (2006).
- (22) K. Werner, Phys. Rev. Lett. 98, 152301 (2007).
- (23) P. Bozek, Acta Phys. Pol. B36, 3071 (2005)
- (24) R.J. Glauber, Phys. Rev. 100, 242 (1955).
- (25) F. Becattini and J. Manninen, Phys. Lett. B 673, 19 (2009).
- (26) J. Aichelin and K. Werner, Phys. Rev. C 79, 064907 (2009).
- (27) S. Afanasiev et al., Nucl. Instr. Meth. A 430, 210 (1999).
- (28) A. Laszlo, Ph.D.Thesis, KFKI Research Institute for Particle and Nuclear Physics, Budapest; CERN EDMS Id 942284.
- (29) K. Werner, Phys. Rep. 232, 87 (1993).
- (30) C. Alt et al., (NA49 Collaboration) Phys. Rev. C 77 (2008) 034906. Details can be otained from https://edms.cern.ch/file/885329/1/vetocal2.pdf.
- (31) B. Lungwitz Diploma thesis, Goethe-Universität Frankfurt, (2004) CERN EDMS Id 1159529.
- (32) T. Anticic et al., (NA49 Collaboration) Phys. Rev. C 83, 014901 (2011).
- (33) R. Brun et al., GEANT User Guide, 1986, CERN/DD/EE84-1.
- (34) P. Dinkelaker, Ph.D. thesis, Goethe-Universität Frankfurt (2009) CERN EDMS ID 1142684/1.
- (35) M. Kliemant Diploma thesis, Goethe-Universität Frankfurt, (2005) CERN EDMS ID 1159527/1.
- (36) W. Ehehalt and W. Cassing, Nucl. Phys. A 602, 449 (1996); W. Cassing and E.L. Bratkovskaya, Phys. Rep. 308, 65 (1999). We thank Dr. E. Bratkovskaya for providing us with the results of the model calculations.
- (37) H. Petersen, M. Bleicher, S. A. Bass and H. Stöcker, arXiv:0805.0567 [hep-ph] and M. Mitrovski, private communication. We thank Dr. M. Mitrovski for providing us with the results of the model calculations.
- (38) A.M. Rossi et al., Nucl. Phys. B 84, 269 (1975). We calculated the multiplicities at 40 GeV and 158 GeV using Eq. 13.
- (39) C. Blume, J. Phys. Conf. Ser. 230, 012003 (2010).
- (40) T. Alber et al., Z. Phys. C 64, 195 (1994).