Lifshitz Transition in the Two Dimensional Hubbard Model
Abstract
Using large-scale dynamical cluster quantum Monte Carlo simulations, we study the Lifshitz transition of the two dimensional Hubbard model with next-nearest-neighbor hopping (), chemical potential and temperature as control parameters. At , we identify a line of Lifshitz transition points associated with a change of the Fermi surface topology at zero temperature. In the overdoped region, the Fermi surface is complete and electron-like; across the Lifshitz transition, the Fermi surface becomes hole-like and develops a pseudogap. At (or very close to) the Lifshitz transition points, a van Hove singularity in the density of states crosses the Fermi level. The van Hove singularity occurs at finite doping due to correlation effects, and becomes more singular when becomes more negative. The resulting temperature dependence on the bare -wave pairing susceptibility close to the Lifshitz points is significantly different from that found in the traditional van Hove scenarios. Such unambiguous numerical observation of the Lifshitz transition at extends our understanding of the quantum critical region in the phase diagram, and shines lights on future investigations of the nature of the quantum critical point in the two dimensional Hubbard model.
pacs:
74.40.Kb, 71.10.Fd, 74.72.-h, 71.10.HfI Introduction
The physical properties of high- cuprate superconductors are extremely sensitive to doping. Experiments, such as the angle-resolved photoemission spectroscopy Damascelli et al. (2003) (ARPES) and quantum oscillation measurements Vignolle et al. (2008), have clearly demonstrated a Fermi surface reconstruction as the doping concentration is varied. In the overdoped region, ARPES and quantum oscillation studies revealed a large Fermi surface that can be well captured by band theory. On the other hand, once the doping is reduced, the shape and size of Fermi surface change and photoemission data indicate that the Fermi surface breaks up into "Fermi arcs"Norman et al. (1998). More recent studies further indicate that the "Fermi arcs" are actually part of closed hole pockets Yang et al. (2008, 2011a). The formation of small Fermi pockets, as the doping is reduced from overdoped to underdoped region, has also been substantiated by quantum oscillation measurements LeBoeuf et al. (2007); Sebastian et al. (2010).
From a theoretical point of view, the change of the Fermi surface topology from a large surface to small "arcs" or "pockets" resembles a Lifshitz transition. Although proposed by Lifshitz in noninteracting Fermion systems decades ago Lifshitz (1960), the Lifshitz transition has only recently begun to be considered as a quantum phase transition in strongly correlated electron systems Yamaji et al. (2006); Misawa and Imada (2007); Yamaji et al. (2007); Imada et al. (2010); Okamoto et al. (2010); Imada et al. (2011); Bercx and Assaad (2012). It has been used to explain experimental data in high- cuprate superconductors Ovchinnikov et al. (2009); Norman et al. (2010) or heavy fermion systems Hackl and Vojta (2011).
Using large-scale dynamical cluster quantum Monte Carlo simulations Maier et al. (2005), a series of recent numerical works Macridin et al. (2006); Vidhyadhiraja et al. (2009); Khatami et al. (2010); Yang et al. (2011b); Galanakis et al. (2011); Chen et al. (2011) mapped out the phase diagram of the two dimensional Hubbard model near the quantum critical filling. Particularly, the superconducting dome in the proximity to the quantum critical doping has been identified Yang et al. (2011b). At positive , there is a first-order phase separation transition occurring at finite temperature. The two phases being separated are an incompressible Mott liquid and a compressible Mott gas; these two phases are adiabatically connected to the pseudogap and the Fermi liquid states at . The first-order line of coexistence terminates at a second order point where the charge susceptibility diverges Khatami et al. (2010); Galanakis et al. (2011). As , this critical point extrapolates continuously to zero temperature and thus becomes the quantum critical point (QCP) underneath the superconducting dome. Above the QCP, a V-shaped quantum critical region, characterized as a marginal Fermi liquid Varma et al. (1989); Varma (1999) with linear resistivity, separates the pseudogap and the Fermi liquid phases. Furthermore, when the next-nearest-neighbor hopping becomes negative, , there is indication of the Fermi surface topology changes at zero temperature, and the filling at which such changes occurs is an extension of the QCP at to negative Chen et al. (2011).
Other numerical works also found similar feature of the Fermi surface reconstruction at by varying the hole doping concentration from overdoped towards half-filling. These include results from both dynamical cluster approximation Gull et al. (2009); Werner et al. (2009); Lin et al. (2010); Gull et al. (2010) and the cellular dynamical mean-field theory Kotliar et al. (2001); Sakai et al. (2009); Liebsch and Tong (2009); Sordi et al. (2011); Sakai et al. (2010, 2012), although the finite temperature critical point in the hole-doped side of the phase diagram found in Ref [35] is inconsistent with other works and might suffer from the finite size effects of a small four-site cluster.
Following such evidence, and in light of viewing the Fermi surface reconstruction as a Lifshitz transition Yamaji et al. (2006); Misawa and Imada (2007); Yamaji et al. (2007); Ovchinnikov et al. (2009); Norman et al. (2010); Imada et al. (2011), we performed systematic numerical studies on the quantum critical phase diagram of the two dimensional Hubbard model at various , with special attention to the region of , which is relevant for the hole-doped cuprates. We find at , as the doping concentration varies from the overdoped to the underdoped regime, the Fermi surface changes its topology from electron-like with complete Fermi surface to hole-like with pseudogap at the anti-nodal direction. Such a topological transition in the Fermi surface is a Lifshitz transition. It is furthermore concomitant with a van Hove singularity in the density of states crossing the Fermi level at a doping which occurs very close to (if not at) the quantum critical point.
The van Hove singularity crossing and the concomitant quantum critical point occur at finite doping due to correlation effects even when . Interestingly, we find the quantum critical phenomena prevail for negative , and the van Hove singularity defines a line of quantum critical points which extends from the QCP at to higher doping for . The temperature dependence of correlation effects close to the van Hove singularities, and its influence on quantities like the quasiparticle fraction and the pairing polarization are very different from those found in the traditional van Hove scenarios Hirsch and Scalapino (1986); Markiewicz (1997). The QCP and the van Hove singularity have great impact on the conditions for pairing. At , we find an enhanced temperature dependence of the bare -wave pairing susceptibility above the QCP that cannot be captured by the conventional BCS logarithmic divergence or the log-squared divergence found at a static van Hove singularity Hirsch and Scalapino (1986).
This paper is organized as follows. Section II outlines the model and the methods used in this study: the dynamic cluster approximation (DCA) with weak-coupling continuous-time quantum Monte Carlo (CTQMC) as its cluster solver. Section III and IV contain our numerical results and discussion, beginning with the spectral function and dispersion at various doping concentrations and values of , and followed by a detailed account of other single-particle properties such as density of states and quasiparticle fraction, across the Lifshitz transition. We then provide results on the unique temperature dependence of the bare d-wave pairing susceptibility. We use a schematic quantum critical phase diagram of the model which summarizes our numerical results. We end with conclusions and an overview of open questions in Section V.
II Formalism
In this work, we look for direct evidence of a Lifshitz transition in the spectral function of the two-dimensional Hubbard model
| (1) |
where is the creation (annihilation) operator for electrons with wavevector and spin , is the number operator, and the bare dispersion is given by
| (2) |
with and being the hopping amplitude between nearest and the next-nearest-neighbor sites respectively, and the on-site Coulomb repulsion.
We employ the DCA Hettler et al. (1998, 2000) with weak-coupling CTQMC Rubtsov et al. (2005) as a cluster solver. The DCA is a cluster mean-field theory that maps the original lattice onto a periodic cluster of size ( is the dimensionality) embedded in a self-consistently determined host. It treats the spatial short-ranged correlations (up to inside a cluster) explicitly while approximating the long-ranged correlations with a mean-field. In this work we choose a square cluster with . The six independent momentum patches are centered at , , , , , and . We set the energy scale to , choose the interaction strength at and study inverse temperatures up to . The temporal correlations, essential for quantum criticality, are treated explicitly by the weak-coupling CTQMC solver for all cluster sizes. The solver expands the Coulomb interaction diagrammatically and samples in time continuously. Different from the Hirsch-Fye algorithm Hirsch and Fye (1986); Jarrell et al. (2001) it therefore has no Trotter error.
We obtain high-quality estimates of the cluster self-energy by employing the maximum entropy analytical continuation Jarrell and Gubernatis (1996) (MEM) directly to the Matsubara-frequency self energies calculated from the DCA-CTQMC Wang et al. (2009); Chen et al. (2011); Fuchs et al. (2011). To perform MEM on the self-energy the non-Hartree part of must be normalize by , where is the local polarization of a single spin species . The normalized spectrum of the self-energy acts as a probability distribution:
| (3) |
where , , using obtained from the Monte Carlo process.
To obtain the lattice self energy, , we interpolate the cluster self energy, . From the lattice self energy we can get the lattice single-particle spectral function, . An alternative way has been suggested by Stanescu et al. Stanescu and Kotliar (2006); Sakai et al. (2009, 2010, 2012), where the cluster cumulant, , has been used for the interpolation to lattice quantities. Although the spectral functions produced by the two interpolation schemes have differences in the underdoped region, we found the two methods give the same quantum critical filling foo .
III Results
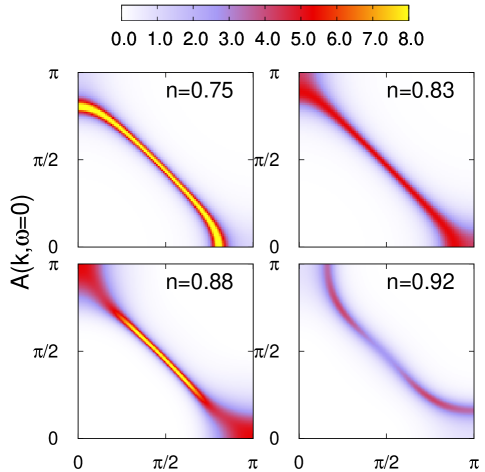
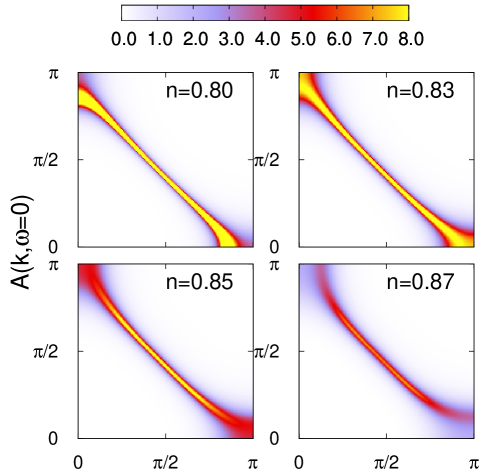
Figure 1 shows the -resolved spectral function evaluated at the Fermi level, , for and . At we observe a change of the Fermi surface topology from electron-like to hole-like as the filling increases from towards half-filling. This change of the topology of the Fermi surface or Lifshitz transition occurs at the same filling where the van Hove singularity crosses the Fermi level Markiewicz (1997); Nieminen et al. (2012). The corresponding filling is the critical filling, , of the Lifshitz transition. In the case we obtain . At the Fermi surface changes from electron-like to hole-like and then disappears as varies from towards half filling. Following the same criterion, the Lifshitz transition occurs at . Finally, for , we find (not shown). For all we studied, the system enters the pseudogap phase once the filling is larger than the corresponding . In the case of (left panel of Fig. 1) and (right panel of Fig. 1) the collapses of the single-particle spectral weight along the antinodal direction can be clearly seen.
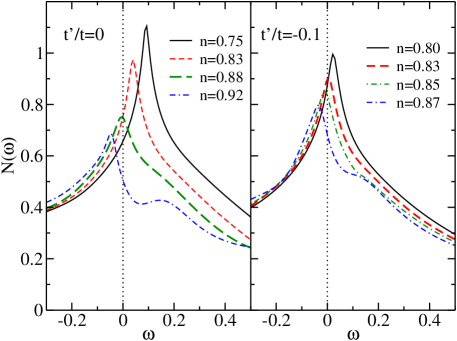
Figure 2 shows density of states for (left panel) and (right panel) with the same set of fillings of those in Fig. 1. For , the van Hove singularity shifts from positive to negative frequency as the filling increases from 0.75 towards 1.0. The van Hove singularity is located at the Fermi level for the quantum critical filling . These results are consistent with our previous observations Khatami et al. (2010); Chen et al. (2011). After passing through the critical filling, a pseudogap in the density of states is formed, as it is displayed by the valley at for , . This parameter regime can thus be identified as the pseudogap region in the phase diagram. For , the results in the right panel of Fig. 2 show a quantum critical filling . Note, the van Hove singularity in single-particle density of states has also been observed in the "momentum-selective" metal-insulator transition scenario Gull et al. (2009); Werner et al. (2009); Lin et al. (2010); Gull et al. (2010), however, the quantum critical phenomena associated with the van Hove singularity and the Lifshitz transition have not been discussed there.
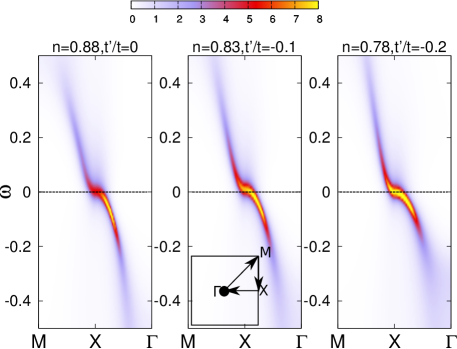
The van Hove singularity originates from the flat dispersion along the antinodal direction with energy close to the Fermi level Radtke and Norman (1994); Markiewicz (1997); Nieminen et al. (2012), as shown in Figure 3. At the critical doping for , , and , there is always a saddle point region around momentum where the dispersion is flat. In addition, we find that the flat region become wider and more pronounced as becomes more negative. Such flat dispersion at the chemical potential contributes low energy states and results in the van Hove singularity at the Fermi energy. Hence, our observation of the Lifshitz transition at the quantum critical doping for is closely tied (if not in one-to-one correspondence) to the crossing of the Fermi level by the van Hove singularity.
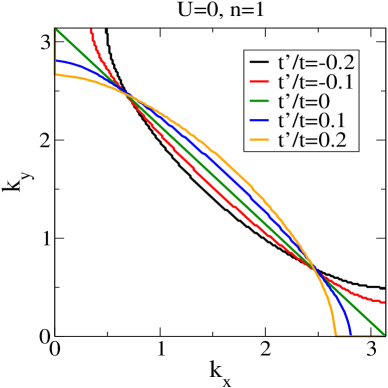
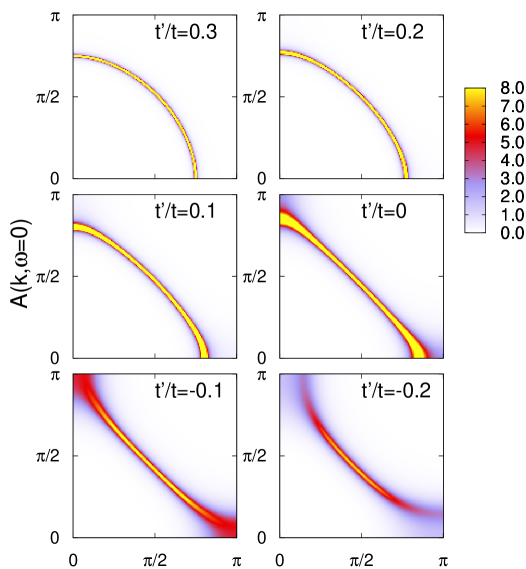
The next-nearest-neighbor hopping can be viewed as the control parameter of the Lifshitz transition. To emphasize this point, we also calculate the zero frequency spectra for the non-interacting system as a function of , and compare them with our DCA results for the interacting system. In Figure 4, the left panel demonstrates the effect of on the Fermi surface topology of the non-interacting half-filled system. We find the Fermi surface changes from electron-like to hole-like when goes from positive to negative values. The right panel of Fig. 4 collects our results for the spectra of the interacting system, with fixed and varies from 0.3 to -0.2. Similar to the noninteracting system, the Fermi surface topology also changes from electron-like to hole-like as goes from positive to negative, which confirms that is indeed the relevant control parameter of the Lifshitz transition in the interacting system. However, the interacting system follows a more complicated phenomenology than the non-interacting system, due to the effect of electron-electron interaction. For example, in the lower two panels of the right hand side of Fig. 4, where is negative, not only is the Fermi surface topology changed to hole-like, but the spectral weight along the antinodal direction also vanishes, signaling that the system enters the pseudogap phase. The strong interaction results in a redistribution of the spectral weight, leading to features different from the ones of the non-interacting system.
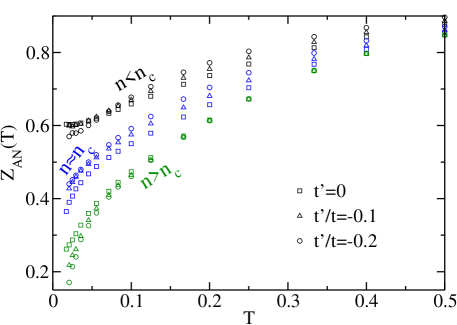
Instead of obtaining the spectral information from the analytical continued data, one can also directly read off the quasiparticle weight from the Matsubara frequency results. Since the quasiparticle weight will be finite across a Fermi surface, but it vanishes if the spectrum is incoherent, can be used to distinguish a Fermi liquid and a pseudogap state. The quasiparticle weight is calculated from the Matsubara frequency self-energy as , where is the lowest fermionic Matsubara frequency. In the limit , converges to the quasiparticle weight, . Figure 5 shows , the Matsubara quasiparticle weight on the Fermi surface along the antinodal direction for various . exhibits different behavior for where the quasiparticle weight approaches a finite value and for where the quasiparticle weight vanishes in the limit . The temperature dependence of furthermore provides information about the relevant energy scales. One sees a clear difference in the temperature dependence of when the system enters Fermi liquid, marginal Fermi liquid and pseudogap phases. Inside the Fermi liquid phase, , where we choose for , for and for , extrapolates to a finite value roughly linearly at low . Close to the Lifshitz transition points, , where we choose for , for and for , shows a behavior consistent with the marginal Fermi liquid picture, i.e., a negative curvature in at low Vidhyadhiraja et al. (2009). Finally, when the system is inside the pseudogap phase, , we choose the same filling for and , goes to zero even faster than it does in the marginal Fermi liquid region. The detailed information about the crossover temperatures and , where the former signifies the crossover between pseudogap and the marginal Fermi liquid and the latter is the crossover temperature between the marginal Fermi liquid and the Fermi liquid, and the quantitative distinction between the marginal Fermi liquid and the pseudogap in terms of temperature and frequency dependence of the self energy and resistivity, have been discussed in detail in our previous publications Vidhyadhiraja et al. (2009); Galanakis et al. (2011); Chen et al. (2011).
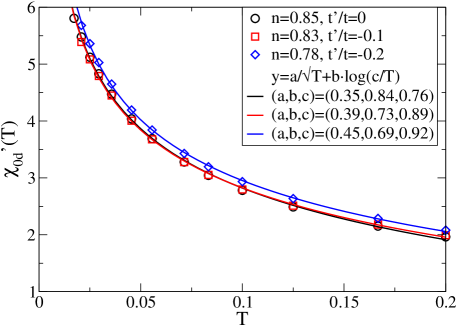
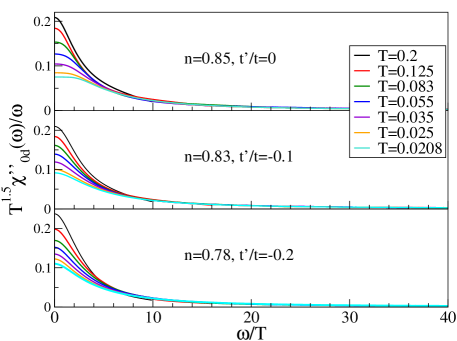
The bare -wave pairing susceptibility is calculated as , where is the -wave form factor. It exhibits significant different features near the QCPs compared with those predicted by static van Hove scenarios Hirsch and Scalapino (1986); Markiewicz (1997). As shown in Fig. 6, close to the quantum critical fillings, the real part of the bare pairing susceptibility diverges quickly with decreasing temperature, following a power-law behavior close to , which is different from the BCS type of logarithmic divergence with the single-particle density of states at the Fermi surface and the phonon cutoff frequency. Such behavior is consistent with our previous results at close to the quantum critical filling Yang et al. (2011b); Chen et al. (2011). More interestingly, such temperature dependence persists for . As shown in Fig. 6, the prefactor, , in the power-law term becomes larger as becomes more negative. It signifies that the divergence becomes stronger at and, if the pairing strength does not change, there will be a higher superconducting transition temperature compared with the one for . Moreover, when we scale the imaginary part of the bare pairing susceptibility as versus She and Zaanen (2009), as shown in Fig. 7, we find the curves from different temperatures fall on the same universal scaling function such that for , where Macridin et al. (2007); Vidhyadhiraja et al. (2009) is the antiferromagnetic exchange energy near half filling. From the Kramers-Kronig relation, the real and imaginary parts of the susceptibility are related via , so collapse of the will contributes a term in the real part of .
IV Discussion
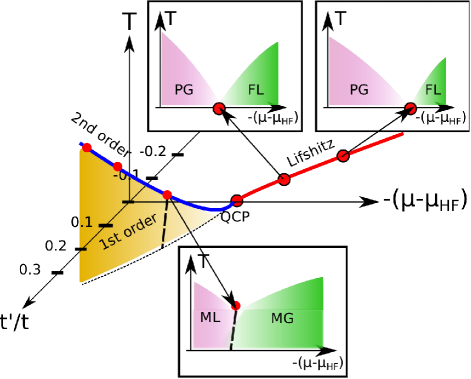
One of the important issues in the field of cuprate physics is the identification of the quantum critical point accepted by and large as relevant for the superconductivity and in particular for the strange “non-Fermi liquid” behavior observed in the vicinity of the maximum of the superconducting dome. Based on our numerical results presented here together with those published previously Khatami et al. (2010); Vidhyadhiraja et al. (2009); Yang et al. (2011b); Galanakis et al. (2011); Chen et al. (2011), we suggest the schematic phase diagram for the two dimensional Hubbard model shown in Figure 8 (note that for clarity we purposely neglect the superconducting and the antiferromagnetic transitions in this schematic plot). The control parameters are the next-nearest-neighbor hopping , chemical potential , and temperature . For each , we shift the chemical with respect to its value at half filling . For , there is a first order phase separation transition between an insulating and incompressible Mott liquid (ML region in the lower inset of Fig. 8) and a weakly compressible metallic Mott gas (MG region in the lower inset of Fig. 8). As a function of temperature, this region of first order transitions terminates in a line of second order classical critical points (red dots and blue line for ). By varying this line of second order transitions is suppressed to . The corresponding doping defines the quantum critical point in the phase diagram. This QCP separates the pseudogap regime from the Fermi liquid. As usual, one observes a V-shaped quantum critical region above this QCP, which shows the signatures of a marginal Fermi liquid. Note that this QCP at also involves a Lifshitz transition, i.e. a change in Fermi surface topology from electron-like in the Fermi liquid phase to hole-like in the pseudogap phase. This property can be directly inferred from the changes in the low-frequency structures of the spectral function (see Fig. 1). At the critical doping the van Hove singularity in the single particle density of states is located at the Fermi energy (see Fig. 2). Note that there are actually two effects involved. Firstly, the change in the overall shape of the Fermi surface, and secondly a distinctive suppression of spectral weight along the antinodal directions in the pseudogap phase. Based on the momentum resolution presently available, we are not able to make decisive statements about a possible formation of hole pockets. Higher momentum resolution would be necessary to unambiguously establish the nature of the Lifshitz transition. We are currently developing a multiscale dual Fermion dynamical cluster approach Yang et al. (2011c), which combines the DCA method used in this work with the recently introduced dual-fermion formalism Rubtsov et al. (2009). This approach can systematically incorporate the long-ranged correlations through the dual fermion lattice calculation, and will eventually provide us the necessary momentum resolution to address the question of the hole pockets and the type of Lifshitz transition associated with the QCP. However, the numerical data presented in this work are very indicative and indeed consistent with a collapse of the Fermi surface from a large to a small one.
As becomes negative phase separation is suppressed, but the critical behavior associated with the Lifshitz transition remains, leading to a line of critical points at , as sketched in the schematic phase diagram in the region . Since the effect of negative is to distort the Fermi surface towards hole-like (see Fig. 4), in the region of the phase diagram, one necessarily needs higher hole doping concentration to have the van Hove singularity locate at the Fermi level. This provides us a simple explanation for the fact that the Lifshitz points move to higher hole doping at . Across the Lifshitz points, it is not only the change in shape of the Fermi surface, but more importantly the strong suppression of weight along the antinodal direction which leads to the interpretation of a Lifshitz transition at . The quantum fluctuations here again lead to a region with quantum critical behavior. As it is commonly accepted, the low-energy model for the high- cuprates is the two dimensional Hubbard model with at least and , we thus have strong numerical evidence that the QCP is indeed due to a transition of the Fermi surface topology, as already suggested by several other authors Sakai et al. (2009); Imada et al. (2011). We also find at negative that the quantum critical region becomes wider in the doping range (see the two upper insets of Fig. 8), the quantum critical points move to higher hole doping concentrations, and the boundary between the pseudogap region and quantum critical region becomes less steep as moves towards the negative direction.
There is, however, an important missing link. The explanation, for the interacting electron system, of why the van Hove singularity crosses the Fermi surface at the critical filling , even for , thus triggering the Lifshitz transition. In previous DCA studies of the 2D Hubbard modelMaier et al. (2002); Gull et al. (2010), it was found that the non-local correlations present in the DCA, but missing in the single site dynamic mean field approximation (DMFA), tend to distort the Fermi surface of the hole doped system so that it is centered around the wavevector (,) rather than (,). As the system is doped away from half filling, these correlations become weaker, and the DCA Fermi surface returns to the DMFA Fermi surface centered around (,). Thus the topology of the Fermi surface changes from hole-like to electron-like at finite doping.
On the other hand, since the correlation effects at finite doping show strong temperature dependence, we expect the phenomena associated with the van Hove singularity also have a temperature dependence which is quite different from those predicted by models with a static van Hove singularity resulting from a saddle point in the bare dispersion Markiewicz (1997). This has important consequences for the superconducting transition , which, at sufficiently high doping, is determined by the BCS-like condition where is the real part of the bare d-wave pairing susceptibility and is the strength of the d-wave pairing interaction.
Following the results in Fig. 6 and 7, we find at , , and , close to the van Hove singularity diverges quickly with decreasing temperature, roughly following the power-law behavior , which is significantly different from the conventional BCS logarithmic divergence or the log-squared divergence found at a static van Hove singularity Hirsch and Scalapino (1986); Markiewicz (1997). Moreover, we find that the prefactor increases with negative , which signifies a stronger divergence in the pairing bubble compared with the one at . However, we also know the -wave pairing vertex, , decays monotonically with hole doping, since originates predominantly from the spin channel Maier et al. (2006); Yang et al. (2011b). A negative will frustrate the antiferromagnetic background, and hence suppress the spin channel contribution to the -wave pairing vertex. At the same time, according to our Lifshitz phase diagram (Fig. 8), one needs higher hole doping concentration to approach the QCP for negative . The higher quantum critical doping and the suppression of the spin channel contribution to the pairing vertex lead us to expect the d-wave pairing vertex, , becomes even smaller for than it is for . Hence, a more strongly divergent pairing bubble, , and a weaker pairing vertex, , bring us to an interesting situation for , where there is a competition between and . Whether this competition will yield a higher and larger superconducting dome in the doping range close to the Lifshitz points at negative will be the subject of future investigations.
Our phase diagram is also phenomenologically consistent with the recent proposal of unconventional quantum criticality at the border of a first order metal-insulator transition and a continuous transition triggered by quantum fluctuations Yamaji et al. (2006); Misawa and Imada (2007); Yamaji et al. (2007). This marginal quantum critical point belongs to an unprecedented universality class and has unique feature with combined characteristics of symmetry breaking and topological (Lifshitz) transitions Imada et al. (2010). Whether the Lifshitz points presented at in this work display unconventional quantum criticality is also a subject of further studies.
V Conclusion
Using large-scale dynamical cluster quantum Monte Carlo simulations, we map out the Lifshitz phase diagram of the two dimensional Hubbard model in the vicinity of the quantum critical fillings. The control parameters of the phase diagram are temperature , chemical potential, and the next-nearest-neighbor hopping . Consistent with our previous results Khatami et al. (2010); Chen et al. (2011); Galanakis et al. (2011), we find at positive a first order phase separation transition which is terminated by a second order critical point. As , the second order terminus is driven to zero temperature, and becomes the QCP separating the pseudogap and the Fermi liquid phases. Here, we extend the investigation into negative , and find out a line of van Hove singularities where the Fermi surface topology changes from electron-like in the Fermi liquid region to hole-like in the pseudogap region of the phase diagram. The points on this line of van Hove singularities hence are the quantum critical points where the Lifshitz transition occurs. Close to these QCPs, the bare -wave pairing bubble diverges algebraically in temperature. Originating from these Lifshitz points, the V-shaped quantum critical region emerges with marginal Fermi liquid properties and vanishing quasiparticle weight Vidhyadhiraja et al. (2009); Chen et al. (2011). We also find the V-shaped quantum critical region becomes wider in doping range (and chemical potential) as becomes negative.
There remain a number of interesting open issues, including the possible formation of hole pockets in the pseudogap phase, the reason of the van Hove singularity crossing the Fermi surface at the quantum critical doping, the superconducting transition temperature and the shape of the superconducting dome at negative , and the possible unconventional quantum criticality associated with the Lifshitz transition points. All these questions require not only massively parallel large-scale simulations, but more importantly, new techniques that will greatly increase the momentum resolution. In fact, progress has already been made along these directions Yang et al. (2011c), and the remaining questions will be addressed in future work.
Acknowledgements.
We would like to thank Ka-Ming Tam, Shu-Xiang Yang, Sandeep Pathak, Karlis Mikelsons, Jian-Huang She, and J. Zaanen for useful conversations. We thank Kai Sun and E. Gull for valuable comments. We also thank Carol Duran for careful reading of the manuscript. This work is supported by NSF grants OISE-0952300 and DMR-0706379, and the NSF EPSCoR Cooperative Agreement No. EPS-1003897 with additional support from the Louisiana Board of Regents. TP acknowledges the support by the DFG through the research unit FOR 1346 and the DAAD through the PPP exchange program. Supercomputer support was provided by the NSF XSEDE under grant number DMR100007.References
- Damascelli et al. (2003) A. Damascelli, Z. Hussain, and Z.-X. Shen, Rev. Mod. Phys. 75, 473 (2003).
- Vignolle et al. (2008) B. Vignolle, A. Carrington, R. A. Cooper, M. M. J. French, A. P. Mackenzie, C. Jaudet, D. Vignolles, C. Proust, and N. E. Hussey, Nature 455, 952 (2008).
- Norman et al. (1998) M. R. Norman, H. Ding, M. Randeria, J. C. Campuzano, T. Yokoya, T. Takeuchi, T. Takahashi, T. Mochiku, K. Kadowaki, P. Guptasarma, et al., Nature (London) 392, 157 (1998).
- Yang et al. (2008) H.-B. Yang, J. D. Rameau, T. A. Johnson, P. D.and Valla, Tsvelik, and G. D. Gu, Nature 456, 77 (2008).
- Yang et al. (2011a) H.-B. Yang, J. D. Rameau, Z.-H. Pan, G. D. Gu, P. D. Johnson, H. Claus, D. G. Hinks, and T. E. Kidd, Phys. Rev. Lett. 107, 047003 (2011a).
- LeBoeuf et al. (2007) D. LeBoeuf, N. Doiron-Leyraud, J. Levallois, R. Daou, J.-B. Bonnemaison, N. E. Hussey, L. Balicas, B. J. Ramshaw, R. Liang, D. A. Bonn, et al., Nature 450, 533 (2007).
- Sebastian et al. (2010) S. E. Sebastian, N. Harrison, M. M. Altarawneh, C. H. Mielke, R. Liang, D. A. Bonn, W. N. Hardy, and G. G. Lonzarich, Natl. Acad. Sci. U.S.A. 107, 6175 (2010).
- Lifshitz (1960) I. M. Lifshitz, Sov. Phys. JETP 11, 1130 (1960).
- Yamaji et al. (2006) Y. Yamaji, M. Takahiro, and M. Imada, Phys. Soc. Jpn. 75, 094719 (2006).
- Misawa and Imada (2007) T. Misawa and M. Imada, Phys. Rev. B 75, 115121 (2007).
- Yamaji et al. (2007) Y. Yamaji, T. Misawa, and M. Imada, J. Phys. Soc. Jpn 76, 063702 (2007).
- Imada et al. (2010) M. Imada, T. Misawa, and Y. Yamaji, J. Phys.: Condens. Matter 22, 164206 (2010).
- Okamoto et al. (2010) Y. Okamoto, A. Nishio, and Z. Hiroi, Phys. Rev. B 81, 121102 (2010).
- Imada et al. (2011) M. Imada, Y. Yamaji, S. Sakai, and Y. Motome, Ann. Phys. 523, 629 (2011).
- Bercx and Assaad (2012) M. Bercx and F. F. Assaad, Phys. Rev. B 86, 075108 (2012), URL http://link.aps.org/doi/10.1103/PhysRevB.86.075108.
- Ovchinnikov et al. (2009) S. G. Ovchinnikov, M. M. Korshunov, and E. I. Shneyder, JETP 109, 775 (2009).
- Norman et al. (2010) M. R. Norman, J. Lin, and A. J. Millis, Phys. Rev. B 81, 180513 (2010).
- Hackl and Vojta (2011) A. Hackl and M. Vojta, Phys. Rev. Lett. 106, 137002 (2011).
- Maier et al. (2005) T. Maier, M. Jarrell, T. Pruschke, and M. H. Hettler, Rev. Mod. Phys. 77, 1027 (2005).
- Macridin et al. (2006) A. Macridin, M. Jarrell, and T. Maier, Phys. Rev. B 74, 085104 (2006).
- Vidhyadhiraja et al. (2009) N. S. Vidhyadhiraja, A. Macridin, C. Sen, M. Jarrell, and M. Ma, Phys. Rev. Lett. 102, 206407 (2009).
- Khatami et al. (2010) E. Khatami, K. Mikelsons, D. Galanakis, A. Macridin, J. Moreno, R. T. Scalettar, and M. Jarrell, Phys. Rev. B 81, 201101 (2010).
- Yang et al. (2011b) S.-X. Yang, H. Fotso, S.-Q. Su, D. Galanakis, E. Khatami, J.-H. She, J. Moreno, J. Zaanen, and M. Jarrell, Phys. Rev. Lett. 106, 047004 (2011b).
- Galanakis et al. (2011) D. Galanakis, E. Khatami, K. Mikelsons, A. Macridin, J. Moreno, D. A. Browne, and M. Jarrell, Phil. Trans. R. Soc. A 369, 1670 (2011).
- Chen et al. (2011) K.-S. Chen, S. Pathak, S.-X. Yang, S.-Q. Su, D. Galanakis, K. Mikelsons, M. Jarrell, and J. Moreno, Phys. Rev. B 84, 245107 (2011).
- Varma et al. (1989) C. M. Varma, P. B. Littlewood, S. Schmitt-Rink, E. Abrahams, and A. E. Ruckenstein, Phys. Rev. Lett. 63, 1996 (1989).
- Varma (1999) C. M. Varma, Phys. Rev. Lett. 83, 3538 (1999).
- Gull et al. (2009) E. Gull, O. Parcollet, P. Werner, and A. J. Millis, Phys. Rev. B 80, 245102 (2009).
- Werner et al. (2009) P. Werner, E. Gull, O. Parcollet, and A. J. Millis, Phys. Rev. B 80, 045120 (2009).
- Lin et al. (2010) N. Lin, E. Gull, and A. J. Millis, Phys. Rev. B 82, 045104 (2010).
- Gull et al. (2010) E. Gull, M. Ferrero, O. Parcollet, A. Georges, and A. J. Millis, Phys. Rev. B 82, 155101 (2010).
- Kotliar et al. (2001) G. Kotliar, S. Y. Savrasov, G. Pálsson, and G. Biroli, Phys. Rev. Lett. 87, 186401 (2001).
- Sakai et al. (2009) S. Sakai, Y. Motome, and M. Imada, Phys. Rev. Lett. 102, 056404 (2009).
- Liebsch and Tong (2009) A. Liebsch and N.-H. Tong, Phys. Rev. B 80, 165126 (2009).
- Sordi et al. (2011) G. Sordi, K. Haule, and A.-M. S. Tremblay, Phys. Rev. B 84, 075161 (2011).
- Sakai et al. (2010) S. Sakai, Y. Motome, and M. Imada, Phys. Rev. B 82, 134505 (2010).
- Sakai et al. (2012) S. Sakai, G. Sangiovanni, M. Civelli, Y. Motome, K. Held, and M. Imada, Phys. Rev. B 85, 035102 (2012).
- Hirsch and Scalapino (1986) J. E. Hirsch and D. J. Scalapino, Phys. Rev. Lett. 56, 2732 (1986).
- Markiewicz (1997) R. S. Markiewicz, J. Phys. Chem. Solids 58, 1179 (1997).
- Hettler et al. (1998) M. H. Hettler, A. N. Tahvildar-Zadeh, M. Jarrell, T. Pruschke, and H. R. Krishnamurthy, Phys. Rev. B 58, R7475 (1998).
- Hettler et al. (2000) M. H. Hettler, M. Mukherjee, M. Jarrell, and H. R. Krishnamurthy, Phys. Rev. B 61, 12739 (2000).
- Rubtsov et al. (2005) A. N. Rubtsov, V. V. Savkin, and A. I. Lichtenstein, Phys. Rev. B 72, 035122 (2005).
- Hirsch and Fye (1986) J. E. Hirsch and R. M. Fye, Phys. Rev. Lett. 56, 2521 (1986).
- Jarrell et al. (2001) M. Jarrell, T. Maier, C. Huscroft, and S. Moukouri, Phys. Rev. B 64, 195130 (2001).
- Jarrell and Gubernatis (1996) M. Jarrell and J. Gubernatis, Physics Reports 269, 133 (1996), ISSN 0370-1573.
- Wang et al. (2009) X. Wang, E. Gull, L. de’ Medici, M. Capone, and A. J. Millis, Phys. Rev. B 80, 045101 (2009).
- Fuchs et al. (2011) S. Fuchs, E. Gull, M. Troyer, M. Jarrell, and T. Pruschke, Phys. Rev. B 83, 235113 (2011).
- Stanescu and Kotliar (2006) T. D. Stanescu and G. Kotliar, Phys. Rev. B 74, 125110 (2006).
- (49) The cumulant interpolation scheme yields the hole pocket in the underdope region Sakai et al. (2009, 2010, 2012), the corresponding Lifshitz transition from Fermi liquid to pseudogap will be a "pocket-vanishing" type different from our findings of "neck-collapsing" type with self energy interpolation scheme. But the two schemes yield transitions at the same critical filling .
- Nieminen et al. (2012) J. Nieminen, I. Suominen, T. Das, R. S. Markiewicz, and A. Bansil, arXiv:1205.5540 (2012).
- Radtke and Norman (1994) R. J. Radtke and M. R. Norman, Phys. Rev. B 50, 9554 (1994).
- She and Zaanen (2009) J.-H. She and J. Zaanen, Phys. Rev. B 80, 184518 (2009).
- Macridin et al. (2007) A. Macridin, M. Jarrell, T. Maier, and D. J. Scalapino, Phys. Rev. Lett. 99, 237001 (2007).
- Yang et al. (2011c) S.-X. Yang, H. Fotso, H. Hafermann, K.-M. Tam, J. Moreno, T. Pruschke, and M. Jarrell, Phys. Rev. B 84, 155106 (2011c).
- Rubtsov et al. (2009) A. N. Rubtsov, M. I. Katsnelson, A. I. Lichtenstein, and A. Georges, Phys. Rev. B 79, 045133 (2009).
- Maier et al. (2002) T. A. Maier, T. Pruschke, and M. Jarrell, Phys. Rev. B 66, 075102/1 (2002).
- Maier et al. (2006) T. A. Maier, M. S. Jarrell, and D. J. Scalapino, Phys. Rev. Lett. 96, 047005 (2006).