On the effect of the in hypernuclear non–mesonic weak decay: a microscopic approach
Abstract
The non–mesonic weak decay of –hypernuclei is studied within a microscopic diagrammatic approach which includes, for the first time, the effect or the –baryon resonance. We adopt a nuclear matter formalism extended to finite nuclei via the local density approximation, a one–meson exchange weak transition potential, a Bonn nucleon–nucleon strong potential and a strong potential based on the Landau–Migdal theory. Ground state correlations and final state interactions (FSI), at second order in the baryon–baryon strong interaction, are introduced on the same footing for all the isospin channels of one– and two–nucleon induced decays. Weak decay rates and single and double–coincidence nucleon spectra are predicted for C and compared with recent KEK and FINUDA data. The introduces new FSI–induced decay mechanisms which lead to an improvement when comparing the obtained nucleon spectra with data, while it turns out to have a negligible effect on the decay rates. Discrepancies with experiment remain only for emission spectra involving protons, but are mostly restricted to double–nucleon correlations in the non–back–to–back kinematics.
keywords:
–Hypernuclei , Non–Mesonic Weak Decay , Two–Nucleon Induced Decay , FSIPACS:
21.80.+a, 25.80.PwThe study of hypernuclear non–mesonic weak decay is of fundamental importance, since it provides primary means of exploring the four–baryon, strangeness changing, weak interactions [1]. The determination of these interactions, which also have a relevant impact in the physics of dense stars [2], requires the solution of complex many–body problems together with a big amount of correlated information from a very systematic and coordinated series of measurements. The non–mesonic decay width, , is built up from one– (1N) and two–nucleon induced (2N) decays, and , where the isospin components are given by and , with , or .
After several decades during which the experimental information was scarce, due to the difficulties inherent in the design of the experiments, in recent years or so some very interesting new measurements were carried out. In particular, we refer to the recent single–nucleon and nucleon–coincidence experiments carried out at KEK [3, 4, 5, 6] and FINUDA [7, 8]. These advances were accompanied by the advent of elaborated theoretical models (some of which included final state interactions and ground state correlations effects on the same ground) and allowed us to reach a reasonable agreement between data and predictions for the non–mesonic weak decay rates and asymmetry parameters (for a recent review see [9]).
However, discrepancies between theory and experiment are still present for the emission spectra involving protons [10, 11]. Concerning the theory–experiment disagreement, a further comment is in order. The extraction of decay rates (for instance, the and ratios) and asymmetries from data is done by a theoretical analysis of the nucleon emission spectra (the real observables), which are affected by nucleon final state interactions. A disagreement between theory and experiment for the spectra should thus be reflected by discrepancies among the decay rates. This does not occur at present: probably, the explanation of this outcome is hidden beyond the big experimental error bars and/or in some inadequacy of the theoretical frameworks. From the theoretical viewpoint, it is still unclear the role played by the –baryon resonance, the first excited state of the nucleon, and by possible violations of the isospin rule in the non–mesonic decay [9]. Further theoretical work is thus needed. New experiments will be carried out at J–PARC, GSI and FAIR (HypHI Collaboration), while new analyses are expected also from FINUDA.
In this Letter we further extend the diagrammatic approach developed in [11, 12, 13] to include the baryon. The electromagnetic properties of this resonance have been extensively studied in recent years. The relatively small mass difference between the nucleon and the together with the strong coupling of the resonance with the channel implies for the a relevant role in strong interaction physics; this was clearly demonstrated, for instance, in studies of few–nucleon forces, nuclear phenomena, heavy–ion collisions and neutron stars. Here we study the relevance of this resonance in non–mesonic weak hypernuclear decay. A nuclear matter formalism is adopted and results for the decay rates and especially the single and double–coincidence nucleon spectra are reported for C within the local density approximation. Ground state correlations (GSC) and nucleon final state interactions (FSI) contributions are introduced at second order in the nucleon–nucleon and strong interactions for the whole set of 1N and 2N isospin decay channels. Being fully quantum–mechanical, the present approach turned out to produce more reliable results [11] for FSI than those based on the (semi–classical) nucleon rescattering given by intranuclear cascade (INC) models [14, 15].
A clear advantage of the microscopic approach is that nucleon FSI and GSC can be included on the same footing in the calculation of decay widths and nucleon emission spectra. This approach thus incorporates a consistency level which cannot be achieved in INC calculations. While GSC give rise to 2N decay amplitudes which mainly contribute to the non–mesonic decay rate, FSI are important in the evaluation of the nucleon spectra. In addition, as demonstrated in [11], the microscopic model naturally contains quantum interference terms (QIT) among different weak decay amplitudes which are of fundamental importance.
The disadvantage of the microscopic approach is that it is much more intricate than the INC. Any observable is evaluated by considering a certain set of many–body Goldstone diagrams. Various diagrams must be tested until one finds the most relevant ones at any given level of approximation. Previous calculations are used as a guidance to improve the predictions by adding new contributions. In [11], we were able to reproduce rather well the spectra for neutron emission, while our predictions largely overestimated the spectra involving protons. Also, the obtained results improved the INC ones.
Only nucleon degrees of freedom were considered in [11] to build up the many–body Goldstone diagrams for the self–energy. No other paper has ever included any nucleon resonance. We therefore decided to improve the set of diagrams with the inclusion of the baryon. We expect the relevance of the in non–mesonic weak decay to be smaller than in other nuclear physics processes like pion or electron scattering off nuclei. Indeed, the –value of the non–mesonic decay, MeV, is not enough to produce a in the final state. The plays a role only when it is off–shell, producing both GSC and FSI contributions. The resonance has isospin and thus appears in four charge states: , , and .
We thus have to choose the set of self–energy diagrams containing the to be evaluated in addition to the nucleonic contributions already discussed in [11] and given in Fig.1 of that reference. Due to energy–momentum conservation, the nucleon resonance cannot contribute to 1N decay amplitudes at zeroth order in the strong interaction. Higher order GSC diagrams also contributing to 1N decay amplitudes and incorporating the can be neglected since, on the basis of former studies on hypernuclei [13] and electron scattering [16], they are expected to provide much smaller contributions than the two– and three–nucleon emission diagrams given in Fig. 1 which we consider here.

Since, as explained, the nucleon resonance cannot appear in the final state, any cut crossing a provides a vanishing contribution to decay rates and spectra. Diagrams (a) and (b) contain two ’s and give rise to a 2N decay and a FSI–induced decay, respectively. From the numerical analysis it turns out that these two diagrams have small effects. For instance, the contribution to the two–nucleon decay rate in C of diagram (a) is 0.002 in units of the free decay rate , while . The contribution of diagrams (a) and (b) to the nucleon emission spectra is of the same order of magnitude. Diagrams (b) to (f) corresponds to FSI–induced decays, each one of them admitting only a single final state. Both the (a) and (b) contributions admit a final state (three–nucleon emission). For all the remainder terms one has final states (two–nucleon emission). Diagrams (c) to (f) are QIT: each one of them is the product of two different transition amplitudes. From the calculation it turns out that the (c)–(f) terms provide negative contributions; instead, diagrams (a) and (b) give positive contributions (although small) by construction.
From this discussions it turns out that the hypernuclear weak decay rates remain unchanged with respect to the results given in Table 1 of [11], which agree rather well with the recent KEK [6] and FINUDA [7, 8] data. In the present Letter we do not give explicit expressions for the self–energies of Fig. 1. However, some general features have to be discussed to clarify the particular isospin structure of these contributions. Let us thus first write the total number of nucleons and nucleon pairs emitted in the non–mesonic decay as follows [12]:
| (1) | |||||
| (2) | |||||
| (3) | |||||
| (4) | |||||
| (5) |
where a normalization per non–mesonic decay is used (). Single and double coincidence nucleon spectra are obtained by constraining the evaluation of each to certain intervals in energy, opening angle, etc. The ’s (’s) are the 1N (2N) decay rates, while the remaining terms containing the functions represent FSI Goldstone diagrams. The index in is used to label the various FSI Goldstone diagrams included in the present calculation. We remind the reader that, apart from the contributions of Fig. 1, also the ones of Fig. 1 in [11] are considered here. The index in instead denotes the final physical state of the Goldstone diagram and in the present case can take the values (cut on states) and (cut on states). Finally, () is the number of nucleons of the type (of pairs) contained in the multinucleon state . Concerning Eqs. (1)–(5), we also note that diagram (a) of Fig. 1 provides a (small) contribution to the decay rates , while the FSI–induced diagrams (b) to (f) contribute to the functions .
Before discussing the numerical results we give some detail on the adopted weak and strong potentials. The weak transition potential contains the exchange of the full set of mesons of the pseudoscalar (, , ) and vector octets (, , ), with strong coupling constants and cut–off parameters deduced from the Nijmegen soft–core interaction NSC97f [17]. For the nucleon–nucleon interaction we adopt the Bonn potential (with the exchange of , , and mesons) [18]. Finally, we have modeled the strong potential in terms of attractive and meson exchange potentials complemented by a repulsive Landau–Migdal term driven by the constant:
| (6) | |||||
where with (an analogous expression holds for ), with or , we denote the hadronic form factors, MeV/c, MeV/c and MeV/c being the correponding cut–offs. Moreover, and for the hadronic coupling constants we have: , and .
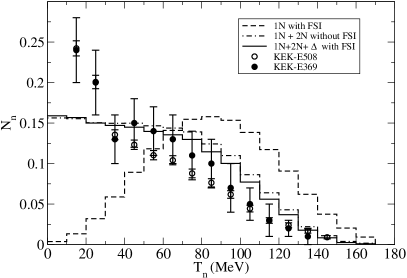
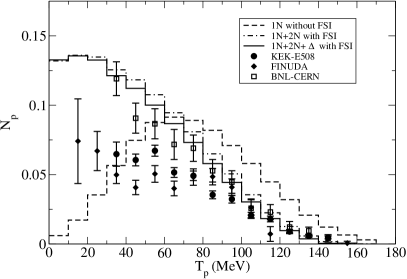
We turn now to our main concern in this Letter: the study of the nucleon emission spectra. In Fig. 2 we show the neutron and proton kinetic energy spectra for the non–mesonic decay of C. The dashed curves are the distributions of the 1N decay nucleons (normalized per 1N decay): as expected, they show a maximum at half of the –value for C non–mesonic decay and a bell–type shape due to the nucleon Fermi motion and the momentum distribution in the hypernucleus. The inclusion of 2N and FSI–induced decay processes provides the results given by the dot–dashed lines (normalized per non–mesonic decay) and leads to a reduction of the nucleon average energy, thus filling the low–energy part of the spectrum and emptying the high–energy region. This outcome has been explained in detail in [11]111Note that the present “1N2N with FSI” results of Figs. 2–5 slightly differ from the ones obtained in [11]. This is due to a more refined numerical analysis of those nucleonic contributions of Fig.1 in [11] which are obtained by regularizing divergent integrals by the Cauchy principal value method.. The “1N2N with FSI” results reproduce fairly well the KEK neutron spectra, while a rather strong overestimation is found of the KEK–E508 and FINUDA proton distributions. Our “1N2N with FSI” proton spectrum is instead closer to the old BNL–KEK data. The final results, containing the contributions, are given by continuous lines (again, they are normalized per non–mesonic decay). Starting from MeV, these spectra are lower than the purely nucleonic ones by a non–negligible amount, thus improving the comparison with data. In particular, the theoretical proton spectrum now agrees well with the old BNL–KEK data, but still overestimates the recent measurements. However, one must note that a certain dispersion is clearly visible in Fig. 2 among the three experimental proton spectra (the discrepancies concerns not only the magnitude of the spectrum but also its shape). Possibly, new proton data could clarify these results.
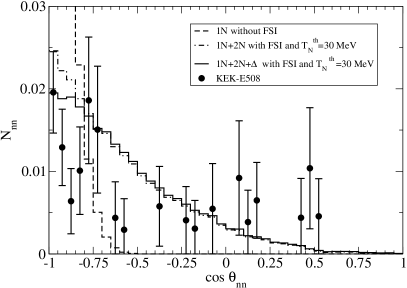
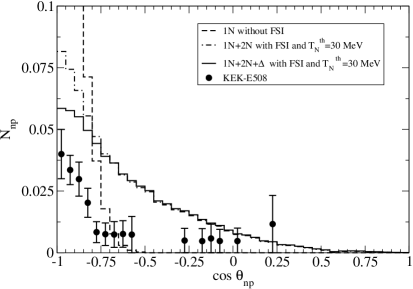
The opening angle distributions of and pairs are reported in Fig. 3. To adhere to the KEK data, the predictions of the calculations including FSI are obtained for a 30 MeV nucleon kinetic energy threshold . The distributions arising from the 1N decay (dashed curves) are strongly peaked at (back–to–back kinematics). The “1N2N with FSI” results (dot–dashed lines) show that the QIT have a crucial effect: they considerably reduce the back–to–back contribution and strongly populates the non back–to–back region. The final “1N2N with FSI” spectra are given by continuous lines. The diagrams which incorporate the nucleon resonance turn out to reduce the spectra in the back–to–back region and improve the comparison with data. We note that the “1N2N with FSI” and “1N2N with FSI” results turn out to be very sensitive to the value adopted for . The agreement with KEK–E508 data is rather good for the spectrum, while for pairs a significant overestimation is still present. The latter result is compatible with the overestimation of the proton spectrum obtained in the same experiment (see Fig. 2).
In Fig. 4 we give the two–nucleon momentum correlation spectra, i.e., the and distributions as a function of the momentum sum of two of the outgoing nucleons. The dashed lines correspond to the 1N decay; the dot–dashed curves refer to the results with 1N, 2N and FSI included; finally, the continuous curves show the full, “1N2N with FSI” predictions. Both the “1N2N with FSI” and “1N2N with FSI” calculations are performed by considering a nucleon kinetic energy threshold MeV, as in the data also shown in the figures. The maximum at MeV/c of the 1N distributions displaces to larges values do to 2N and FSI–induced decays, which indeed produce less back–to–back peaked events. As noted in [23], the minimum in both the and KEK–E508 distributions is an effect of the low statistics and detection efficiency for events with 350 MeV/c (the KEK detector geometry being optimized for back–to–back coincidence events, i.e., for small values of ). Indeed, such dip structure has not been found in our calculation, which overestimates the data for large correlation momenta (especially for the spectrum, consistently with the spectra discussed so far). Moreover, according to our calculation, a double–maximum structure as suggested by the data could possibly be explain only with very big GSC and/or FSI, but this would spoil the agreement in the momentum correlation spectra found here at small as well as the agreement found for the previous spectra. Finally, note that the has the effect of improving the comparison with data for small values of , especially in the case.
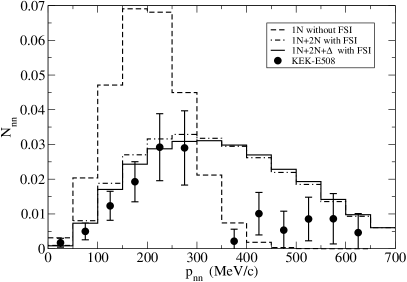
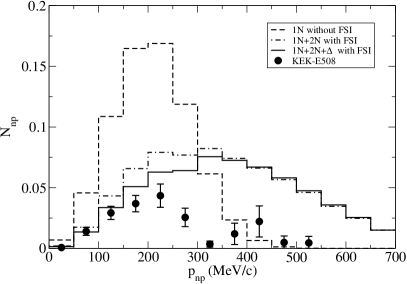
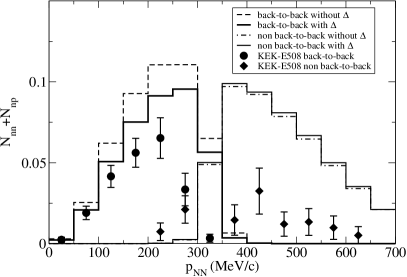
The “1N2N with FSI” and “1N2N with FSI” distributions of Fig. 4 at low momentum sum (say below 400 MeV/c) are mainly due to 1N decays (which are strongly back–to–back correlated), while for higher momenta the contribution of 2N and FSI–induced decays is dominant (and produces less back–to–back correlated pairs). This behavior is confirmed by the momentum correlation of the sum shown in Fig. 5 for the opening angle regions with (back–to–back region) and (non back–to–back region). Again, one notes an improvement in the comparison with data in the back–to–back region thanks to the contributions.
Finally, in Table 1 we show results for the ratio obtained with a nucleon kinetic energy threshold of 30 MeV for the back–to–back () and the non–back–to–back regions (). An improvement, although limited, in the comparison with KEK–E508 data is noted for the calculation which includes the . Our final results for both angular regions are compatible with data for within . The underestimation of this ratio originates from the overestimation of the spectrum and confirms a systematic overestimation of the proton emission reported by KEK–E508.
| Angular region | Without | With | KEK–E508 |
|---|---|---|---|
| 0.33 | 0.37 | ||
| 0.39 | 0.42 |
Summarizing, a microscopic approach including for the first time many–body terms introduced by the nucleonic resonance is used to evaluate the nucleon emission spectra in non–mesonic weak decay of hypernuclei. Such a scheme provides a fully quantum–mechanical description in which a unified treatment of complex effects such as GSC and nucleon FSI is considered. As we have seen in a previous Letter [11], in this scheme QIT play a key role. This is confirmed by the present calculation: among the Goldstone diagrams incorporating the , the relevant ones are QIT and turn out to produce a sensitive reduction of the spectra. On the contrary, the new diagrams have a negligible effect in the calculation of the non–mesonic decay rates. Although an improvement is achieved thanks to the new weak decay channels, especially concerning coincidence spectra in the back–to–back kinematics, discrepancies with experiment still remain for proton emission. Further work is in order to understand the origin of the disagreement. Forthcoming coincidence experiments at J–PARC on C [25] and four–body hypernuclei [26] will allow a measurement of the nucleon spectra with improved accuracy. From the theoretical viewpoint, new studies should consider a possible violation of the rule on the isospin change in the non–mesonic decay. For the future we plan to start a systematic investigation of rare non–mesonic weak decays of –hypernuclei such as , , (which implies a strangeness variation ) and (). A reliable calculation of the rates for these –induced decay reactions is missing, no experimental evidence of such processes is available at present but they could be observed in the future.
References
- [1] W.M. Alberico and G. Garbarino, Phys. Rep. 369 (2002) 1.
- [2] J.Schaffner-Bielich, Nucl Phys. A 835 (2010) 279; Nucl.Phys. A 804 (2008) 309.
- [3] S. Okada, et al., Phys. Lett. B 597 (2004) 249.
- [4] B.H. Kang et al., Phys. Rev. Lett. 96 (2006) 062301.
- [5] M.J. Kim et al., Phys. Lett. B 641 (2006) 28.
- [6] M. Kim et al., Phys. Rev. Lett. 103 (2009) 182502.
- [7] M. Agnello et al. (FINUDA Collaboration) and G. Garbarino, Phys. Lett. B 685 (2010) 247.
- [8] M. Agnello et al. (FINUDA Collaboration) and G. Garbarino, Phys. Lett. B 701 (2011) 556.
- [9] E. Botta, T. Bressani and G. Garbarino, Eur. Phys. J. A 48 (2012) 41.
- [10] E. Bauer, G. Garbarino, A. Parreño and A. Ramos, Nucl. Phys. A 836 (2010) 199.
- [11] E. Bauer and G. Garbarino, Phys. Lett. B 698 (2011) 306.
- [12] E. Bauer, Nucl. Phys. A 781 (2007) 424; Nucl. Phys. A 796 (2007) 11.
- [13] A. Bauer and G. Garbarino, Phys. Rev. C 81 (2010) 064315.
- [14] A. Ramos, M. J. Vicente-Vacas, and E. Oset, Phys. Rev. C 55 (1997) 735; Phys. Rev. C 66 (2002) 039903, Erratum.
- [15] G. Garbarino, A. Parreño, and A. Ramos, Phys. Rev. Lett. 91 (2003) 112501; Phys. Rev. C 69 (2004) 054603.
- [16] E. Bauer, Nucl. Phys. A 637 (1998) 243; Nucl. Phys. A 725 (2003) 149.
- [17] V. G. J. Stoks and Th. A. Rijken, Phys. Rev. C 59 (1999) 3009; Th. A. Rijken, V. G. J. Stoks and Y. Yamamoto, Phys. Rev. C 59 (1999) 21.
- [18] R. Machleidt, K. Holinde and Ch. Elster; Phys. Rep. 149 (1987) 1.
- [19] J.H. Kim et al., Phys. Rev. C 68 (2003) 065201.
- [20] S. Okada et al., Phys. Lett. B 597 (2004) 249.
- [21] A. Montwill et al., Nucl. Phys. A 234 (1974) 413.
- [22] M. J. Kim et al., Phys. Lett. B 641 (2006) 28.
- [23] M. Kim et al., Phys. Rev. Lett. 103 (2009) 182502.
- [24] H. Bhang and M. Kim, private communication.
- [25] M. Kim, et al., Nucl. Phys. A 835 (2010) 434; H. Bhang et al., Coincidence measurement of the weak decay of C and the three–body weak interaction process, Letter of intent for an experiment (E18) at J–PARC (2006).
- [26] S. Ajimura et al., Exclusive study on the weak interaction in hypernuclei, Letter of intent for an experiment (E22) at J–PARC (2007).