A scientometrics law about co-authors and their ranking.
The co-author core.
Abstract
Rather than ”measuring” a scientist impact through the number of citations which his/her published work can have generated, isn’t it more appropriate to consider his/her value through his/her scientific network performance illustrated by his/her co-author role, thus focussing on his/her joint publications, - and their impact through citations? Whence, on one hand, this paper very briefly examines bibliometric laws, like the -index and subsequent debate about co-authorship effects, but on the other hand, proposes a measure of collaborative work through a new index. Based on data about the publication output of a specific research group, a new bibliometric law is found.
Let a co-author have written (joint) publications with one or several colleagues. Rank all the co-authors of that individual according to their number of joint publications, giving a rank to each co-author, starting with for the most prolific. It is empirically found that a very simple relationship holds between the number of joint publications by coauthors and their rank of importance, i.e. . Thereafter, in the same spirit as for the Hirsch core, one can define a ”co-author core”, and introduce indices operating on an author. It is emphasized that the new index has a quite different (philosophical) perspective that the -index. In the present case, one focusses on ”relevant” persons rather than on ”relevant” publications.
Although the numerical discussion is based on one case, there is little doubt that the law can be verified in many other situations. Therefore, variants and generalizations could be later produced in order to quantify co-author roles, in a temporary or long lasting stable team(s), and lead to criteria about funding, career measurements or even induce career strategies.
| gives the number distribution/probability | ||
| Lotka-Pareto law | of scientists as a function of | ; |
| the number of papers they wrote | ||
| asymptotically | ||
| Yule distribution | corresponds to | where , |
| Lotka law | ||
| ranks scientists | , one has | |
| Zipf-Mandelbrot law | by the number of papers | |
| they wrote | ||
| reflects the fact that most of the productivity | ||
| Bradford law | of relevant articles by scientists are concentrated | |
| in a small number of journals |
I Introduction
In 1926, Lotka lotka26 discovered a ”scientific productivity law”, i.e. the number of authors who has published papers, in some scientific field, e.g. chemists and physicists lotka26 , approximately behaves like
| (1) |
where is the number of authors having published only 1 paper in the examined data set. The -axis can be turned into a probability (or ”frequency”) by appropriate normalization. Conversely, ranking authors as 1, 2, 3,… according to their number of publications, one approximatively finds: , where is the number of papers written by the most prolific author () in the examined data set. - a ”ranking law” similar to those discussed by Zipf Zipf2 . However, Lotka’s inverse square law, Eq.(1), is only a theoretical estimate of productivity: the square law dependence is not always obeyed lotkalaw?MLP . In fact, author inflation leads to a breakdown of Lotka’s law KRETSCHMERROUSSEAU Lotka ; Egghebook05 ; EggheRousseauLotka the more so nowadays. It is known, see , that a collaboration of large team effect has led to articles with more than 2000 authors, e.g. in physics or in medicine. The roles or effects of coauthors is thus to be further studied in bibliometrics.
Note that several other so called have been predicted or discovered about relations between number of authors, number of publications, number of citations, fundings, dissertation production, citations, or the number of journals or scientific books, time intervals, …. etc. yab1 ; ch3 ; price63 ; price75 ; price78 ; gilbert ; chung ; kealey . Scientometrics has become a scientific field in itself GLANZELCOURSEHANDOUTS2003 ; beck ; Potter88 ; vanRaan ; egg1 ; andrea1 . Thus, statistical approaches and bibliometric models based on the laws and distributions of Lotka, Pareto, Zipf-Mandelbrot, Bradford, Yule, and others, - see Table 1 for a summary, do provide much useful information for the analysis of the evolution of scientific systems in which a development is closely connected to a process of idea diffusion and work collaboration. Note that the ”laws” do not seem to distinguish single author papers from collaborative ones. Lotka, himself, assigned each publication to only one, the senior author, ignoring all coauthors. Thus, again, coauthorship raises questions. .
More recently, an index, the index, has been proposed in order to quantify an individual’s scientific research output hindex . A scientist has some index , if of his/her papers have at least citations each. A priori this value is based on journal articles. Note that, books, monographs, translations, edited proceedings, … could be included in the measure, without much effort. Such a ”measure” should obviously be robust and should not depend on the precision of the examined data basis. No need to say that the official publication list of an author should be the most appropriate starting point, - though the list should be reexamined for its veracity, completeness and appropriateness. However, it is rather unusual that an author records by himself the citations of his/her papers. In fact, sometimes, several citations go unnoticed. Alas, the number of citations is also known to vary from one search engine to another, - even within a given search engine, depending on the inserted keywords Buchanan . Thus much care must be taken when examining any publication and its subsequent citation list. This being well done, the core of a publication list is a notion which can be defined, e.g., as being the set of papers which have more than citations. Fortunately, this ”core measure” does not vary much, whatever the investigated data base, - because of the mathematical nature of the functional law, a power law, from which the index is derived hindex ; Egghebook05 .
Let it be noted that a discussion focusing on the many defects and improved variants of the -index, e.g. the , , , , , , , , , … indices, their computation and standardization can be found in many places, e.g. in AlonsoetJOI3.09 ; ARIST44.10.65LEgghe ; Radiology255.10.342 bibliom ; Schreiber2010b ; Schreiber2012JoI6_17v . It can be emphasized that these indices are more than indices, because they operate at the level of the paper citation number, considered to be relevant for measuring some author visibility 0912.3573 zhang . Also, one can distinguish between ”direct indices” and ”indirect indices” JASIST59.08.830BornmannMutzDaniel . It can be also debated that inconsistencies might arise because of self-citations Schreiber2007EPL , though such a point is outside the present discussion. However, any cited paper is usually considered as if it was written by a single author. Nevertheless, there can be multi-authored papers. It is clear, without going into a long discussion, that the role and the impact of such co-authors are difficult to measure or even estimate Laudel ; BEAVER52.01 . One may even ask whether there are sometimes too many co-authors McDK95 .
In order to pursue this discussion, a brief review of the literature on collaborative effects upon the -index is presented in Sect. II. This will serve as much as to present a framework for the state of the art on such -index spirit research, taking into account collaborative aspects, together with quick comments, as suggesting arguments on the interest of the present report, - henceforth justifying this new approach.
The present paper is an attempt to quantifying the importance of co-authors, whence a priori co-workers 0354-73100303211V , in scientific publications, over a ”long” time interval, and consequently suggesting further investigations about their effect in (and on) a team. In other words, the investigation, rather than improving or correcting the -index and the likes, aims at finding a new structural index which might ”quantify” the role of an author as the leader of co-authors or coworkers. It will readily appear that the approach can automatically lead to criteria about, e.g., fundings, team consistency, career ”measurements”, or even induce career strategies.
As a warning, let it be mentioned that the present investigation has not taken into account the notion of network. Of course, every scientist, except in one known case, has published with somebody else, himself/herself having published with some one else, etc.; a scientific network exists from the coauthorship point of view. But the structure and features of such a huge network can be found in many other publications HK94 ; HK97 ; Sigmod03 ; 1006.0928 criticalmass kenna ; HKretschmer85structuresize ; HKUKTK07 , to mention very few.
Since the size and structure of a temporary or long lasting group is surely relevant to the productivity of an author 1-s2.0-S1751157711000630-main , this will be a parameter to be still investigated when focussing on network nodes or fields, as in the investigated data here below. However, the goal is not here to investigate the network, but rather concentrate on the structural aspect of the neighborhood of one selected node. It should not be frightening that a finite size section of the network only is investigated. It is expected that the features found below are so elegant, and also simple, that they are likely to be valid whatever the node selection in the world scientific network MelinPersson96 ; PNAS101.04-Newman-5200-5 coll netwk ; Zuccala06invisblcoll ; ch6 .
Firstly, an apparently not reported ”law”, quantifying some degree of research collaboration 1-s2.0-S1751157711000800-main , is presented, in Sect. III. A very simple relationship is empirically found, i.e., the number of joint publications of a researcher with his/her co-authors and their rank (based on their ”publication frequency”) are related by , - a simple law as the second Lotka law, linking the number of citations for a publication of an author and their rank, according to their number of citations, , i. e., leading to the index hindex .
Secondly, in Sect. IV, one defines the core of co-authors for an individual, - it is emphasized that this measure has a quite different spirit that the definition of the core of papers for the publication list of an individual, in the index scheme. Numerical illustrations are provided. Some analysis of the findings and some discussion are found in Sect. V. A short conclusion is found in Sect. VI.
II -index: Collaborative effects, - a few comments to serve as a brief review
As mentioned here above, inconsistencies have been shown to arise on the -index when one takes into account multi-authored papers Vanclay . Several disturbing, or controversial, effects of multi-authorship on citation impact, for example, have been shown in bibliometric studies by Persson et al. in 2004 Perssonetal04 . Yet, Glänzel and Thijs WGBT04 have shown that multi-authorship does not result in any exaggerate extent of . In fact, self-citations can indicate some author creativity, or versatility at changing his/her field of research Ausloos08 ; Iina06 ; Iina07 ; Iinamadrid
To take into account the effect of multiple through the index, Hirsch hirsch10 , himself, even proposed the index as being the number of papers of an individual that have a citation count larger than or equal to the index of all co-authors of each paper. Of course, . With the original -index a multiple-author paper in general belongs to the -core of some of its coauthors and not belong to the -core of the remaining coauthors. The - index, unlike the -index, uniquely characterizes a paper as belonging or not belonging to the -core of its authors. However, these considerations emphasize ”papers” rather than ”authors”. Indeed, one focusses on some ”paper-core”, not on some ”co-author-core”.
It has been much discussed whether co-authors must have all the same ”value” in quantifying the ”impact” of a paper; see ioannidis ; 0354-73100303211V , and also AJR167.96.slonecoauthor pointing to ”undeserved coauthorship”.
For a practical point of view, Sekercioglu proposed that the th ranked co-author be considered to contribute as much as the first author Sekercioglu08 , highlighting an earlier proposal by Hagen Hagen09 . At the same time, Schreiber proposed the index Schreiber2008d ; Schreiber2008c , and index JoI4.10.42Schreibergm , counting the papers equally fractionally according to the number of authors; see also Egghe Egghe2008d giving an author of an authored paper only a credit of , if the paper received citations. Carbone Carbone recently also proposed to give a weight to each -th paper of the th individual according to the number of co-authors of this -th paper, - being a parameter at first. Carbone argued that ambiguities in the e.g. index distribution of scientist populations are resolved if . Other considerations can be summarized : (i) Zhang ZhangEMBO10.09 has argued against Sekercioglu hyperbolic weight distribution, as missing the corresponding author, often the research leader. Zhang proposed that weighted citation numbers, calculated by multiplying regular citations by weight coefficients, remain the same as regular citations for the first and corresponding authors, who can be identical, but decreased for authors with increasing rank; (ii) Galam galamscientom12 has recently proposed another fractional allocation scheme for contributions to a paper, imposing in contrast to Zhang, that the total weight of a paper equals 1, in fine leading to a index favorizing a ”more equal” distribution of ”co-author’s weight” for more frequently quoted papers. Note that it differs from the index; see AlonsoetJOI3.09 .
Other considerations have been given to the co-authorship ”problems”. Nascimento et al. Sigmod03 e.g. found out that co-authorship is a small world network. from such a point of view, Börner et al. KBLDWMKAV05 , but also others ivs.2009.31 , used a weighted graph representation to illustrate the number of publications and their citations. However, even since Newman PNAS101.04-Newman-5200-5 coll netwk or more recently Mali et al. ch6 and the subsequent works here above recalled, there have been considerations on the number of co-authors and their ”rank”, for paper among many others of an individual, but no global consideration in the sense of Hirsch, about ”” all coauthors, over a whole joint publication process.
Author productivity and geodesic distance in co-authorship networks, and visibility on the Web, have also been considered to illustrate the globalization of science research HKretschmer04collaborationgeodesic ; 1-s2.0-S1751157711000599-main ; Ponds .
| MA | PC | AP | JP | JK | TK | DS | |
|---|---|---|---|---|---|---|---|
| born in | 1943 | 1945 | 1937 | 1939 | 1939 | 1972 | 1943 |
| Ph.D. in | 1973 | 1973 | 37 | none | 1973 | 2001. | 1970 |
| tenure in | 1986 | 1976 | 1980 | none | 1995 | 2007. | 1977 |
| 1st publication in | 1971 | 1974 | 1966 | 1983 | 1967 | 1997 | 1967 |
| latest recorded publication in | 2010 | 2010 | 2010 | 1983 | 1999 | 2010 | 2010 |
| : Numb. publications (2011) | 571 | 34 | 111 | 2 | 60 | 38 | 638 |
| : Numb. joint publications (2011) | 528 | 33 | 90 | 2 | 48 | 38 | 486 |
| : Numb. single author publications (2011) | 43 | 1 | 21 | 0 | 12 | 0 | 152 |
| Numb. jointly ed. books (2011) | 9 | - | 8 | – | (2; transl.) | – | 10∗ |
| index hindex | 35 | 11 | 10 | 2 | 10 | 6 | 55 |
| Numb. cit. of most often cited paper | 152 | 127 | 37 | 7 | 537 | 41 | 1430 |
| Tot. numb. citations till | 1113 | 296 | 224 | 14 | 745 | 100 | 8148 |
| index Jin06 | 31.8 | 26.9 | 22.4 | 7 | 74.5 | 16.7 | 148.1 |
| Numb. of diff. co-authors ( | 317 | 32 | 46 | 4 | 38 | 51 | 285 |
| Total numb. of co-authors | 1551 | 95 | 134 | 8 | 108 | 181 | 793 |
| Tot. coauthor distribution skewness | 7.35 | 4.66 | 3.18 | - | 2.18 | 3.39 | 3.98 |
| index | 19 | 4 | 7 | 2 | 5 | 6 | 12 |
| Numb. J. Publ. with ”” co-author | 155 | 30 | 21 | 2 | 13 | 26 | 30 |
| Numb. J. Publ till | 810 | 46 | 170 | 4 | 39 | 76 | 264 |
| index, Eq.(4) | 42.6 | 11.5 | 24.3 | 2 | 7.8 | 12.7 | 22 |
| 0.06 | 0.125 | 0.15 | 0.50 | 0.13 | 0.12 | 0.04 | |
| 0.13 | 0.36 | 0.53 | 0.50 | 0.21 | 0.25 | 0.08 |
III Data
III.1 Methodology
The main points of the paper are based on a study of the publication list of a research group, i.e. the SUPRATECS Center of Excellence at the University of Liege, Liege, Belgium, at the end of the 20-th century. The group was involved in materials research, and involved engineers, physicists and chemists. Among the researchers, a group of 5 authors (MA,PC,AP,JP,JK) has been selected for having various scientific careers, similar age, reasonable expertise or reputation, with an expected sufficient set of publications and subsequent citations, spanning several decades, thus allowing to make some acceptable statistical analysis. These 2 females and 3 males are part of a college subgroup of the SUPRATECS, having mainly performed research in theoretical statistical physics, but having maintained contacts outside the Center, and performed research on different topics; e. g., see some previous study on AP can be found in Ausloos08 .
Each publication list, as first requested and next kindly made available by each individual, has been manually examined, i.e. crosschecked according to various search engines and different keywords, for detecting flaws, ”errors”, omissions or duplications. Each investigated list has been reduced to joint papers published in refereed journals or in refereed conference proceedings. A few cases of ”editorials” of conference proceedings have been included, for measuring the -index, see next subsection. Sometimes such citations exist, instead of the reference to the book or proceedings. But these do not much impair the relevant numerical analysis of the new index.
Finally, in order to have some appreciation of the robustness of the subsequent finding, a test has been made with respect to two other meaningfully different scientists, so called ”asymptotic outsiders” : (i) the first one, TK, is a younger female researcher , an experimentalist, sometimes having collaborated with the group, but outside statistical mechanics research, - a chemist, known to have several, but not many, joint publications with the main 5 individuals; (ii) the other, DS, a male, is a well known researcher, of the same generation as the 5 main investigated ones; DS is known as a guru in the field, has many publications, many citations, thus has expectedly a larger -index, and is known to have published under ”undeserved co-authorship”. He is also chosen, as a test background, because having very few joint publications with the 5 main investigated authors, but has a reliable list of published works.
A brief CV and the whole list of publications of such 7 scientists are available from the author. Note that it is somewhat amazing that for such a small number of authors, a hyperbolic Lotka-like law is verified with a , though the exponent is close to 2.9 (graph not shown).
III.2 -index and relevant bibliometric data of the investigated scientists
In order to remain in the present bibliometric framework, the -index of such (7) scientists has been manually measured. Care has been taken about the correctness of the references and citations. For example, JP and DS have a homonym in two other fields. Also, the total citation count till the end of the examined time interval, i.e., 2010, has not been possible for MA, AP and DS, due to their rather long publication list. The citation count has been made up to their respective -index, - to measure their -index. But, it is emphasized that the citation count is irrelevant for measuring the presented new index below. In Table 2, the number of citations, leading to the -index value, includes books when they are recorded as papers in the search engines, papers deposited on arXives, and papers published in proceedings, be they in a journal special issue or in a specific book-like form.
Note that for the -index, Google Scholar distinguishes the citations for a paper uploaded on the arXives web site and a truly published paper. For the present investigation on joint publications, both ”papers”, obviously having the same authors, are considered as only one joint publication!
The index, with other relevant data, like the total number of publications, or the number of joint publications for which they are co-authors are given in Table 2. Let it be emphasized that the joint publications have covered different time spans. These publications, of course, involved other co-authors than those selected 5 members.
Also recall that the number of ”citations till ” when divided by is equal to the index, measuring the reduced area of the histogram till , i.e. . Jin06 .
III.3 Zipf plots of Joint Publications vs. Co-author Ranking
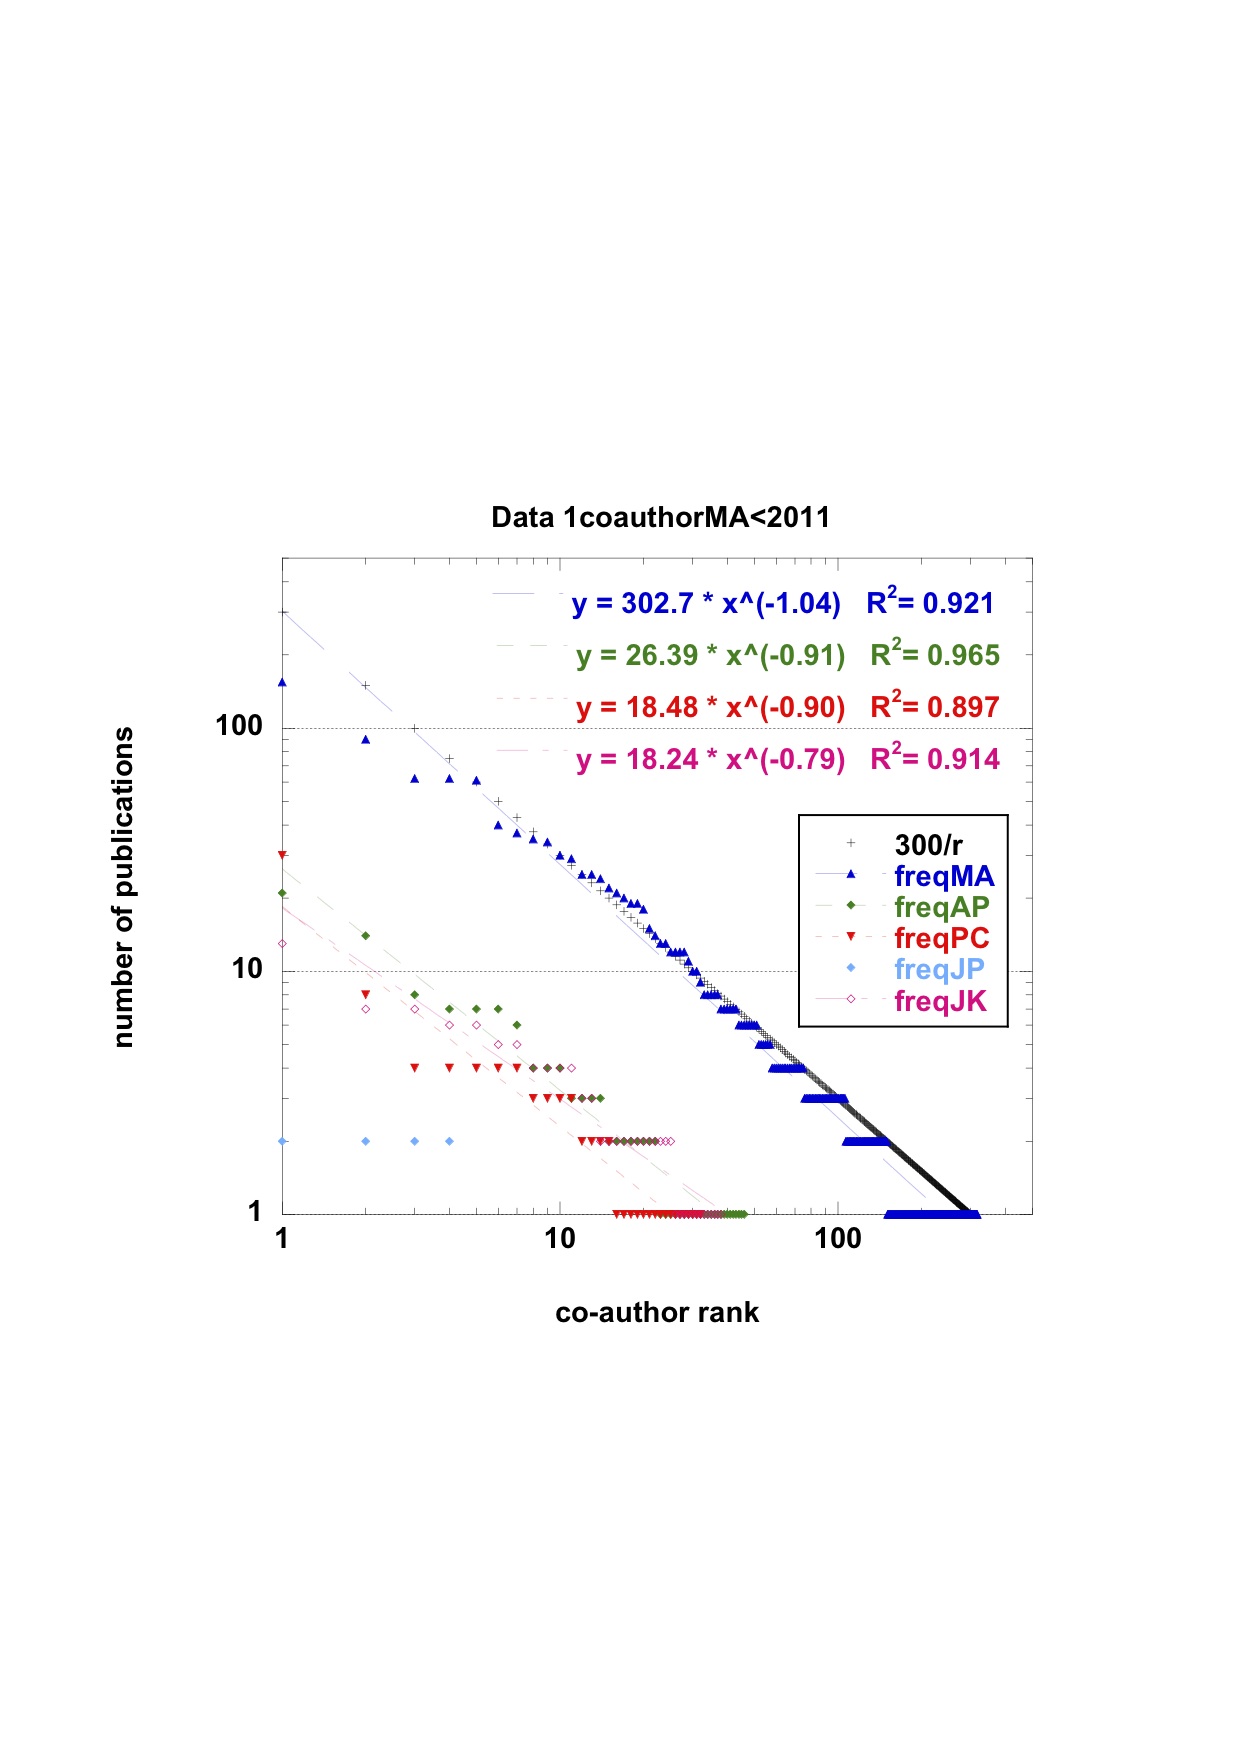
Having established the number of joint publications of the (5+2) scientists here mentioned, and ranked them according to the frequency of joint publications with one of the main authors, the most usual graph to be done is a Zipf plot Zipf2 ; httpZipf ; li02 . By an abuse of language, the number of joint publications is called for frequency. However, no scaling has been made with respect to the total number of publications of each author. First, a log-log plot of the number of joint publications between the five team members, with whoever partners ranked in a decreasing order of joint contributions, is given in Fig. 1. The data appears to fall on a straight line, with a slope equivalent to a power law exponent , i.e.
| (2) |
Note that the data appears better to fall more on a line (on such a plot), if the number of publications of the authors is large. Such a Zipf behavior does not seem to have been reported in this bibliometric context httpZipf ; li02 .
In view of such data, one of the investigated scientists, JP, has been removed below from the plots for better clarity; in fact, JP has peculiar characteristics, since this researcher has no Ph.D. and has not continued publishing, after participating in the SUPRATECS activities.
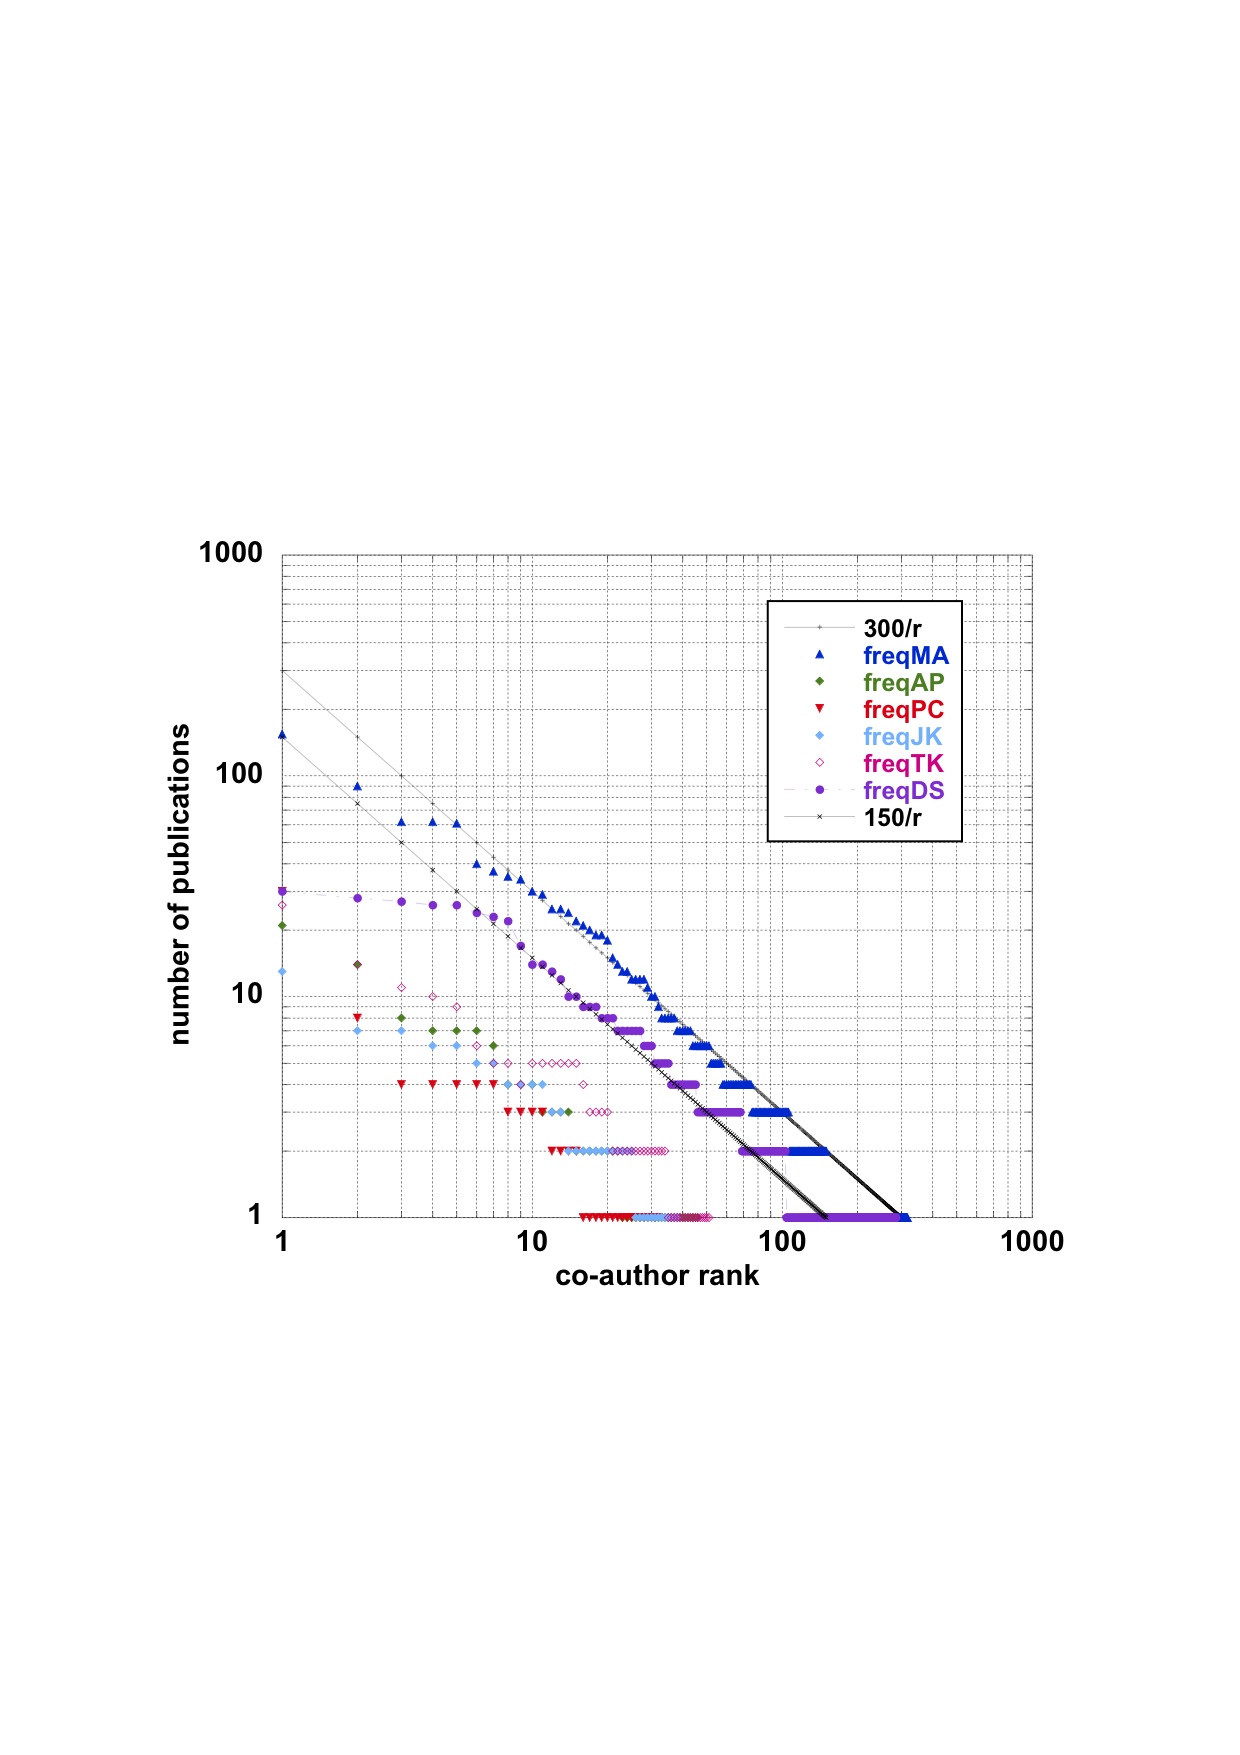
A comparison with the ”two asymptotic outsiders”, TK and DS, can next be made, as a test of the scientific field, sex and age (ir-)relevance, when obtaining the above ”law”. A log-log plot of the number of joint publications versus ranked co-authors, be they partners or not, ranked in a decreasing order of joint contributions, is given for these 6 authors, in Fig. 2. The power law exponent is emphasized to be close to particularly for the most prolific authors. Nevertheless, one may observe a curvature at ”low rank”. This indicates that a Zipf-Mandelbrot-like form
| (3) |
with , would be more appropriate. This is a very general feature of almost all Zipf plots httpZipf ; li02 .
A few interesting features have to be observed, at low rank. The first points, here even the first two points for MA, sometimes surge up from the Zipf-Mandelbrot-like form. This is known as a ”king effect” , i.e. the rank = 1 quantity is much larger and is much above the straight line on such plots. This is for example the case of country capitals when ranking cities in a country; e.g. see Fig. 7 in EPJB2.98.525stretchedexp_citysizesFR . Here, the surge up indicates the importance of the main pair of authors, relative to the others. On the other hand, a (obviously to be called) ”queen effect” occurs when the low rank data falls almost on a horizontal, - as for DS. The interpretation is as easy as for the king effect: several authors, always the same ones, have some disposition toward the ”queen”, in terms of joint publications. Some observation of this feature related to careers will be discussed below.
The best fits by a power law and by a Zipf-Mandlebrot law, Eq.(3) of the number of publications versus co-author rank are given in Table 3, for the 4 main researchers and the 2 outsiders. The fit with the latter law is of course much more precise, though one might argue that this is due only to the number of involved parameters. The fit parameters, given in Table 3, nevertheless indicate some universality in behavior.
| MA | 0 | 302.7 | 413.78 | 1.5 | 0.9927 | |||||
| AP | 0 | 26.39 | 37.809 | 0.8 | 0.9911 | |||||
| PC | 0 | 18.48 | 8.7187 | -0.9 | 0.9926 | |||||
| JK | 0 | 18.24 | 49.172 | 2.55 | 0.9746 | |||||
| TK | 0 | 34.77 | 48.495 | 0.7 | 0.9860 | |||||
| DS | 0 | 76.96 | 0.864 | 159.88 | 0.9599 | 0.9838 |
IV Co-authorship core: the and indices
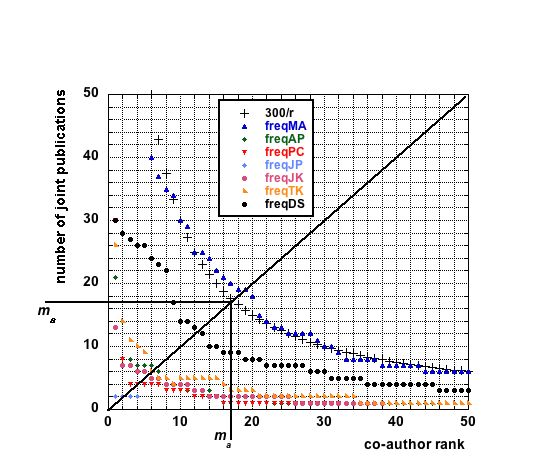
The Hirsch core of a publication list is the set of publications of an author which is cited more than -times. Similarly to the definition of the ”Hirsch core”, along the index, or also the -index, concept, one can define the core of coauthors for an author. This value, here called , is easily obtained from Fig. 3, in the cases so examined through a simple geometrical construction. It would then be easy to obtain, e.g. from the publication list or the CV, who are the main partners of the main coauthors, and do make more precise the active members of a team.
Similarly to the index Jin06 , one can define an - index which measures the surface below the empirical data of the number of joint publications till the coauthor of rank , i.e.
| (4) |
In practical terms, it is an attempt to improve the sensitivity of the index to take into account the number of co-authors whatever the number of joint publications among the most frequent coauthors. The results are given in Table II.
V Some analysis and some discussion
V.1 Analysis
Three subtopics are to be commented upon. First, the high quality of the fits can be noticed. More precisely, the Zipf-Mandelbrot fit parameters allow to distinguish authorship patterns. For example, the parameter values indicate that PC and DS are markedly different authors as their coauthors are concerned. It should be remarked that the most anomalous parameters occur for PC, for which , in Eq.(3), is negative (), together with a low (). From Table II, it is observed that PC has not only the lowest number of publications as well as the lowest number of joint publications, but also the relative highest number of coauthors. In contrast DS has a large parameter (), with .
Next, the index values show that such authors can be grouped in three sets, MA & DS, PC, AP & JK, TK & JP. Observe that JK has nevertheless a very high number of citations for one paper, leading to a large -index (), about half of that of DS (). Except for JP, all other authors can be grouped together from the index point of view, and approximately conserve the same ranking as for the index.
Finally, concerning the new measure of the scientific productivity through joint publication coauthorship, one may consider that, at least one can group coauthors in two regimes: those with a small, thus frequent, likely long standing truly coworkers or group leaders ( ), and those with a large, most often not frequent coworkers, who are likely students, post-docs, visitors, or sabbatical hosts types. The threshold, according to Fig. 2, occurs near , which seems a reasonable value of the number of ”scientific friends”. However, the index gives a more precise evaluation of the core of coauthors for a given scientist. Table III indicates that there is marked difference between the MA & DS type of scientists, and the others from the point of view of association with others. Their -index is quite above 10, indeed. It seems that one might argue also that the importance of leadership (or centrality using the vocabulary of network science) might be better reflected through the area of the histogram of joint publications with the ”main” coauthors through the -index. In so doing, one obtains a high value () for MA, while AP and DS fall into a second group with . The analysis therefore leads to suggest that one has thereby obtained a criterion for indicating either a lack of leadership, exemplified by PC and TK, or a ”more central” role, e.g. for MA, AP, and DS.
V.2 Discussion
The interpretation of such results indicates the relative importance of working in a team, or not, as well as the sociability or capacity for attraction of some author; see LeeBozeman . Also recalling that the data is a snapshot at some time of a list of publications, it points toward further studies on time effects. Not only the evolution of the list should be relevant in monitoring scientific activities, but also the origin of the time interval seems to be a relevant parameter. Indeed, compare the or values for PC and TK, and observe their relative scientific career output as co-authors. They have a similar record of publications; they started their career at very different times. However, TK , though being associated in a temporary but regular way with the SUPRATECS team, though permanently based in another group, has almost the same (slightly greater than 10) as PC, a stable senior partner for SUPRATECS. Even though PC has many less co-authors. Be aware that TK is an experimentalist and PC a theoretician, - both females.
Similarly, compare for AP and DS, both with above 20, even though their number of co-authors is markedly different, - 32 vs. 285. Recall that in 40 years, the average number of authors of scientific papers has doubled. Some say the problem reflects the growing complexity of the research process in many disciplines McDK95 . However, the starting career time is about the same. To compare, -if necessary, the role of coauthors, and some sort of leadership in a scientific career, therefore, an indirect measure of interest can be the ratios or/and . In so doing, according to Table III, DS and MA are proved to be ”leading”. It is rather evident that the inverse of such ratios are of the order of magnitude of the degree of the author node of the scientific network. In some sense, or/and weight the links attached to a node; see HKretschmer99collaboration2birds , about flocking effects.
V.3 Career patterns
A brief comment can be made on the king and queen effects seen on Fig.2, in relevance to the type of career of these authors. For example, the low ranked coauthors of DS have an equal amount of joint publications. Same for MA, except for the lowest rank coauthor who has a large relevance. These two features point to career hints. One way to interpret this feature can be indeed deduced from Table 2. It can be observed that the tenure year markedly differs for both authors, - leaders. It can be understood that DS had more quickly possibilities of collaborations with selected co-authors than MA who had on one hand to list co-authors of hierarchical importance on joint publications during a longer time, -thus a ”queen effect”, and on the other hand had to rely on an experimentalist (”the king”) leader for producing publications. The same effects are seen for PC and TK on Fig.2. The similarity emphasizes the argument on the role of sex, age and type of activity; see sexproduct .
VI Conclusion
Two main findings must be outlined as a summary and conclusion.
-
•
A finite set of researchers, from a large research group, having stable activity, and different types of researchers, all well known to the writer, as been examined. These have been performing and producing papers in theoretical statistical physics. It has been found that the number of joint publications when ranked according to the frequency a coauthor appears leads to a new bibliometric law:
(5) The tail of the distribution seems undoubtedly equal to -1. A deviation occurs for individuals having few co-authors or a limited number of publications. Instead of a slope on a log-log plot, one can observe a behaviour at small , - related to the so called ”king effect” and ”queen effect”. Note that this wording does not apply to the examined author but to the main co-authors, one ”king” at rank =1, the ”queens” at rank or so. This leads to imagine a new measure of co-authorship effects, quite different from variants of theindex. The emphasis is not on the number of citations of papers of an author, but is about how much coworkers he/she has been able to connect to in order to produce (joint) scientific publications.
-
•
Next, in the same spirit as for the Hirsch core, one can define a ”co-author core”, and introduce indices, like and , operating on an author. Numerical results adapted to the finite set hereby considered can be meaningfully interpreted. Therefore, variants and generalizations could be later produced in order to quantify co-author roles in a temporary team. The finite size of the sample is apparently irrelevant as an argument against the findings. Nevertheless, one could develop the above considerations, through a kind of network study. Of course the present findings and the proposed indices are only a few of the possible quantitative ways to tackle the co-authorship problem. Different other methods can be investigated, with variants as those recalled in Sect. II. However, they will never be the whole answer to evaluate the career of an individual nor to fund his/her research and team. But they are easy ”arguments” and/or smoke screens.
Thus, it might have been thought that the number of co-authors of papers over a career might be related to the number of joint publications. But it was not obvious that a simple relationship should be found. In so finding, an interesting new measure of research team leaderships follows, - the ”co-author core”. It is hoped that the present report thus can help in classifying scientific types of collaborations HK87 ; sonnenwald07 .
As a final point, let it be emphasized that even though co-authorship can be abusive Kwok05 , it should not be stupidly scorned upon. Indeed in some cases, co-authorship and output are positively related. For instance, it has been shown that, for economists, more co-authorship is associated with higher quality, greater length, and greater frequency of publications sauer88 ; Hollis01 . Yet bibliometric indicators, as those nowadays discussed, can be useful parameters to evaluate the output of scientific research and to give some information on how scientists actually work and collaborate. To measure the quality of the work has still to be discussed.
Acknowledgment
The author gratefully acknowledges stimulating and challenging discussions with many wonderful colleagues at several meetings of the COST Action MP-0801, ’Physics of Competition and Conflict’. In particular, thanks to O. Yordanov for organising the May 2012 meeting ”Evaluating Science: Modern Scientometric Methods”, in Sofia, and challenging the author to present new results. All colleagues mentioned in the text have frankly commented upon the manuscript and enhanced its content. Reviewer comments have, no doubt, much improved the present version of the ms.
References
- (1) Lotka, A. J. (1926). The frequency distribution of scientific productivity. Journal of the Washington Academy of Sciences 16, 317 – 323.
- (2) G.K. Zipf, Human Behavior and the Principle of Least Effort: An Introduction to Human Ecology (Addison-Wesley, Cambridge, 1949)
- (3) Pao, M.L. (1986). An Empirical Examination of Lotka s Law, Journal of the American Society for Information Science and Technology, 37(1): 26-33.
- (4) Kretschmer, H., Rousseau, R., (2001). Author inflation leads to a breakdown of Lotka’s law. Journal of the American Society for Information Science and Technology, 52, (8): 610-614
- (5) Egghe. L., (2005). Power Laws in the Information Production Process: Lotkaian Informetrics.
- (6) Egghe, L., Rousseau, R. (2012). The Hirsch index of a shifted Lotka function and its relation with the impact factor. Journal of the American Society for Information Science and Technology, 63(5): 1048-1053.
- (7) Yablonsky, A.I. (1980). On fundamental regularities of the distribution of scientific productivity. Scientometrics 2, 3 – 34.
- (8) Vitanov, .K., Ausloos, M. (2012). Knowledge epidemics and population dynamics models for describing idea diffusion, in Models of Science Dynamics : Encounters Between Complexity Theory and Information Sciences, Andrea Scharnhorst, Katy Börner, and Peter van den Besselaar, Eds. Springer Verlag Berlin Heidelberg, Ch. 3, pp. 69 - 125.
- (9) Price, D. J. de Solla. (1963). Little Science, Big Science. Columbia University Press, New York.
- (10) Price, D. J. de Solla, Gürsey, S. (1975). Some statistical results for the numbers of authors in the states of the United States and the nations of the world. pp. 26 – 34 in: Who is Publishing in Science, 1975 Annual. Institute for Scientific Information, Philadelphia.
- (11) Price, D. J. de Solla. (1978). Science since Babylon. Yale University Press, New Haven.‘
- (12) Gilbert, G.N. (1978). Measuring the growth of science: A review of indicators of scientific growth. Scientometrics 1, 9 – 34.
- (13) Chung, K.H., Cox, R. A. K. (1990). Patterns of productivity in the finance literature: A study of the bibliometric distributions. Journal of Finance 45, 301 – 309.
- (14) Kealey, T. (2000). More is less. Economists and governments lag decades behind Derek Price’s thinking. Nature 405, 279.
- (15) W. Glänzel, Bibliometric as a Research Field: A course on theory and application of bibliometric indicators, Course Handouts, 2003 - nsdl.niscair.res.in
- (16) Beck, I. M. (1984). A method of measurement of scientific production. Science of Science 4, 183 – 195.
- (17) Potter, W. G. (1988). Of Making Many Books There is No End: Bibliometrics and Libraries. The Journal of Academic Librarianship 14, 238a-238c.
- (18) van Raan, A. F. J. (1996), Advanced bibliometric methods as quantitative core of peer review based evaluation and foresight exercises, Scientometrics, 36, No. 3 (1996) 397-420
- (19) Egghe, L., Rousseau, R. (1990). Introduction to Informetrics. Quantitative Methods in Library, Documentation and Information Science, Elsevier, Amsterdam.
- (20) Bruckner, E., Ebeling, W., Scharnhorst , A. (1990). The application of evolution models in scientometrics. Scientometrics 18, 21 – 41.
- (21) Hirsch, J.E. (2005). An index to quantify an individual’s scientific research output. Proceedings of the National Academy of Sciences USA 102, 16569-16572.
- (22) Buchanan, R. A. (2006). Accuracy of cited references: The role of citation databases. College and Research Libraries, 67, 292 303.
- (23) Alonso, S., Cabrerizo, F. J., Herrera-Viedma, E., & Herrera, F. (2009). h-Index: A review focused in its variants, computation and standardization for different scientific fields. Journal of Informetrics 3, 273-289.
- (24) Egghe, L., The Hirsch Index and Related Impact Measures, Annual Review of Information Science and Technology. 44, Issue 1, pages 65 114, 2010.
- (25) Durieux, V., and Gevenois, P.A. (2010). Bibliometric Indicators: Quality Measurements of Scientific Publication, Radiology 255 ( 2), 342-351
- (26) Schreiber, M. (2010b). Twenty Hirsch index variants and other indicators giving more or less preference to highly cited papers. Annalen der Physik (Berlin) 522(8), 536 554. .
- (27) Schreiber, M., Malesios, C.C., and Psarakis, S. (2012). Exploratory factor analysis for the Hirsch index, 17 h-type variants, and some traditional bibliometric indicators, Journal of Informetrics 6, 347 358.
- (28) Zhang, R., (2009). An index to link scientific productivity with visibility, .
- (29) Bornmann, L., Mutz, R., and Daniel, H. (2008). Are there better indices for evaluation purposes than the h-index? A comparison of nine different variants of the h-index using data from biomedicine. Journal of the American Society for Information Science and Technology, 59(5), 830 837.
- (30) Schreiber, M. (2007). Self-citation corrections for the Hirsch index. Europhys. Lett. 78, 30002.
- (31) Laudel, G. (2001). What do we measure by co-authorships? In M. Davis & C. S. Wilson (Eds.) Proceedings of the 8th International Conference on Scientometrics and Informetrics (pp. 369-384). Sydney, Australia: Bibliometrics & Informetrics Research Group.
- (32) Beaver, D. de B. (2001). Reflections on scientific collaborations (and its study): Past, present and prospective. Scientometrics, 52, 365-377.
- (33) McDonald, K. A. (1995). Too Many Co-Authors?. Chronicle of Higher Education 41, 35-36.
- (34) Vuć ković-Dekić, L. (2003). Authorship-coauthorship, Archive of Oncology 11(3): 211-2.
- (35) Kretschmer, H., Coauthorship networks of invisible colleges and institutional communities. Scientometrics, 30 (1) 1994, 363-369.
- (36) Kretschmer, H. (1997). Patterns of behaviour in coauthorship networks of invisible colleges, Scientometrics, 40 (3): 579-591.
- (37) Nascimento, M. A., Sander, J., Pound, J. (2003). Analysis of SIGMOD’s co-authorship graph. ACM SIGMOD Record Homepage archive 32, 8 - 10.
- (38) Kenna, R., and Berche, B. (2010). Critical mass and the dependency of research quality on group size, arxiv.org/pdf/1006.0928
- (39) Kretschmer, H., (1985). Cooperation structure, group size and productivity in research groups. Scientometrics 7, 39-53
- (40) Kretschmer, H., Kretschmer, U., and Kretschmer, Th. (2007). Reflection of co-authorship networks in the Web: Web hyperlinks versus Web visibility rates, 2007, Volume 70, Number 2, Pages 519-540
- (41) Abbasi , A., Altmann, J., and Hossain, L. (2011). Identifying the effects of co-authorship networks on the performance of scholars : A correlation and regression analysis of performance measures and social network analysis measures Journal of Informetrics 5 (2011) 594 607.
- (42) Melin, G., & Persson, O. (1996). Studying research collaboration using co-authorships. Scientometrics, 36, 363-377.
- (43) Newman, M. E. J. (2004). Coauthorship networks and patterns of scientific collaboration. Proceedings of the National Academy of Sciences USA 101, 5200-5205.
- (44) Zuccala, A. (2006). Modeling the invisible college. Journal of the American Society for Information Science and Technology, 57(2), 152-168.
- (45) Mali, F., Kronegger, L., Doreian, P., Ferligoj, A. (2012). Chapter 6, Dynamic Scientific Co-Authorship Networks in Models of Science Dynamics : Encounters Between Complexity Theory and Information Sciences, Andrea Scharnhorst, Katy Börner, and Peter van den Besselaar, Eds. (Springer Verlag Berlin Heidelberg).
- (46) Chien Hsiang Liao, Hsiuju Rebecca Yen, Quantifying the degree of research collaboration: A comparative study of collaborative measures, Journal of Informetrics 6 (2012) 27 33 ; five measures that quantify the degree of research collaboration, including the collaborative index, the degree of collaboration, the collaborative coefficient, the revised collaborative coefficient, and degree centrality.
- (47) Vanclay, J. K. (2007). On the robustness of the h-index. Journal of the American Society for Information Science and Technology, 58(10): 1547-1550.
- (48) Persson, O., Glänzel, W. , Danell, R. (2004). Inflationary Bibliometric Values: The Role of. Scientific Collaboration and the Need for Relative Indicators in Evaluative Studies. Scientometrics 60, 421 432.
- (49) Glänzel, W., Thijs, B. (2004). Does co-authorship inflate the share of self-citations?. Scientometrics 61, 395-404.
- (50) Ausloos, M., Lambiotte, R., Scharnhorst, IA., Hellsten, I. (2008). Andrzej Pekalski networks of scientific interests with internal degrees of freedom through self-citation analysis, Int. J. Mod. Phys. C 19, 371-384.
- (51) Hellsten, I., Lambiotte, R. , Scharnhorst, A., Ausloos, M. (2006). A journey through the landscape of physics and beyond - the self-citation patterns of Werner Ebeling”. in: Irreversible Prozesse und Selbstorganisation. T. Poeschel, H. Malchow and L. Schimansky-Geier, Eds. (Logos Verlag, Berlin, 2006) pp. 375-384
- (52) Hellsten, I., Lambiotte, R. , Scharnhorst, A., Ausloos, M. (2007). Self-citations, co-authorships and keywords: A new method for detecting scientists field mobility? Scientometrics 72, 469 - 486.
- (53) Hellsten, I., Lambiotte, R., Scharnhorst, A., Ausloos, M. (2007). Self-citations networks as traces of scientific careers. In Proceedings of the ISSI 2007, 11th International Conf. of the Intern. Society for Scientometrics and Informetrics, CSIC, Madrid, Spain, June 25-27, 2007. Ed. by D. Torres-Salinas; H. Moed, Vol. 1, pp. 361-367
- (54) Hirsch, J. E. (2010). An index to quantify an individual’s scientific research output that takes into account the effect of multiple coauthorship. Scientometrics 85, 741-754.
- (55) John P. A. Ioannidis, Measuring Co-Authorship and Networking Adjusted Scientific Impact, PLoS ONE 3.10.e2778
- (56) SIone, R.M. (1996). Coauthors Contributions to Major Papers Published in the AjR: Frequency of Undeserved Coauthorship, American Journal of Roentgenologv (AiR) 167: 571-579
- (57) Sekercioglu, C.H. (2008). Quantifying coauthor contributions. Science 322, 371. Sekercioglu, C.H. (2009). Response from Cagan H. Sekercioglu to Hagen (2009). Science 30, 583.
- (58) Hagen, N. T. (2009) Credit for coauthors. Science 323: 583.
- (59) Schreiber, M. (2008). To share the fame in a fair way, for multi-authored manuscripts. New Journal of Physics 10 (040201) 1-9.
- (60) Schreiber, M. (2008). A modification of the h-index: The h(m)-index accounts for multi-authored manuscripts. Journal of Informetrics 2, 211-216.
- (61) Schreiber, M., (2010). How to modify the g-index for multi-authored manuscripts, Journal of Informetrics 4 (1): 42-54.
- (62) Egghe, L. (2008d). Mathematical theory of the and -index in case of fractional counting of authorship. Journal of the American Society for Information Science and Technology 59, 1608-1616.
- (63) Carbone, V. (2012). Fractional counting of authorship to quantify scientific research output arxiv 1106.0114v1.
- (64) Zhang, C.T., . (2009). A proposal for calculating weighted citations based on author rank. EMBO Reports 10, 416-417. ; The e-Index, Complementing the h-Index for Excess Citations, PLoS ONE 4(5): e5429.
- (65) Galam, S. (2011). Tailor based allocations for multiple authorship: a fractional gh-index. Scientometrics 89, 365-379
- (66) Börner, K., Dall’Asta, L., Ke, W., Vespignani, A. (2005) Studying the emerging global brain: Analyzing and visualizing the impact of co-authorship teams Complexity 10, 57-67.
- (67) Chinchilla-Rodriguez, Z., Vargas-Quesada, B., Hassan-Montero, Y., Gonzàlez-Molina, A., and Moya-Anegón, F., (2010). New Approach to the Visualization of International Scientific Collaboration, Information Visualization 9 (4), 277 287.
- (68) Kretschmer, H. (2004). Author productivity and geodesic distance in co-authorship networks, and visibility on the Web. Scientometrics, 60 : 409 420.
- (69) Waltman, L., Tijssen, R.J.W., and van Eck, N. J., (2011). Globalisation of science in kilometres, Journal of Informetrics 5, 574 582.
- (70) Ponds, R., Van Oort, F., and Frenken,K. (2007). The geographical and institutional proximity of research collaboration, Papers in Regional Science, Volume 86 (3), 423 443.
- (71) Jin, B. (2006). h-Index: An evaluation indicator proposed by scientist. Science Focus, 1(1), 8 9.
- (72) Li, W. (2003) : see
- (73) Li, W. (2002). Zipf’s law everywhere. Glottometrics 5, 15-41.
- (74) Laherrère J., and Sornette, D. (1998). Stretched exponential distributions in nature and economy: fat tails with characteristic scales, Eur. Phys. J. B 2, 525 539
- (75) Lee, S. and Bozeman, B. (2005). The impact of research collaboration on scientific productivity, Social Studies of Science, 35, (5): 673-702.
- (76) Kretschmer, H. (1999). Collaboration, Part II: Reflection of a Proverb in Scientific Communities: Birds of a Feather Flock Together. International Library Movement, 21 (3): 113-134.
- (77) Long, J.S. (1992). Measures of sex differences in scientific productivity Social Forces, 71 (1): 159-178.
- (78) Kretschmer, H. (1987). The adaptation of the cooperation structure to the research process and scientific performances in research groups 1987, 12, ( 5-6): 355-372.
- (79) Sonnenwald, D. H. (2007). Scientific collaboration. Annual Review of Information Science and Technology 41: 643 681.
- (80) Kwok, L. S. (2005). The White Bull effect: abusive coauthorship and publication parasitism. Journal of Medical Ethics 31, 554-556.
- (81) Sauer, R.D. (1988). Estimates of the returns to quality and coauthorship in economic academia. The Journal of Political Economy 96, 855-866.
- (82) Hollis, A. (2001). Co-authorship and the output of academic economists, Labour Economics 8, 505-530.