Energy spectrum reconstruction at the edge of a two-dimensional electron system with strong spin-orbit coupling
Abstract
We experimentally demonstrate the simultaneous reconstruction of the bulk and the edge energy spectra caused by strong spin-orbit interaction, at the two lowest filling factors and for two-dimensional electron system with . The observed reconstruction is of different character at these filling factors: it is characterized by zeroing of the energy gap at the levels crossing point at , while the reconstruction at goes through the coexistence of two quantum Hall phases with different spin projections. An analysis indicates a strong influence of many-body interaction on the reconstruction at .
pacs:
73.40.Qv 71.30.+hI Introduction
Long-term interest to the investigation of semiconductor systems with strong spin-orbit (SO) coupling is connected, on the one hand, with their intriguing physical properties, and, on the other hand, with possible spintronic applications. For the applications, SO interaction opens a way to electrically control the electron spin. datta For the pure science, SO interaction is an example of the relativistic effect being observable in conventional semiconductors physics. winkler Nowdays, SO-like Hamiltonian term is essential in theoretical models of systems with nontrivial topology (topological insulators). Thus, the systems with strong SO coupling can help in transferring the well developed methods of semiconductor physics to fields of new physical concepts.
From a number of different two-dimensional systems with strong SO coupling there is one which is characterized by a unique set of parameters. Namely, a two dimensional electron gas (2DEG), confined in a narrow asymmetric quantum well with , is characterized by (i) high mobility, biasiol08 because the well is nominally undoped; (ii) low electron concentration, which can be widely controlled by an external gate biasiol08 ; (iii) strong Rashba-type SO coupling nitta ; (iv) high -factor, subject to exchange-interaction enhancement kita ; gui ; biasiol04 .
This parameter set makes this system very suitable for investigations in the quantum Hall (QH) regime. The transitions between QH states with different spin polarization were investigated in Ref. biasiol04, at high filling factors . The transitions were induced by increasing the ratio between the Zeeman and the cyclotron energies in a tilted-field configuration. The obtained -factor was demonstrated to be subject to many-body effects biasiol04 .
However, even in normal fields, strong SO coupling can cause transitions between different QH states at low filling factors spain . A single-particle spectrum was originally calculated in Ref. bychkov, for Rashba-type SO two-dimensional systems in quantizing magnetic fields. The spectrum is represented by distinct energy levels
| (1) |
where for and for , is the effective electron mass biasiol04 , defines the SO coupling strength.
In the limit of extremely high magnetic fields, the spectrum (1) represents the well-known ladder of the spin-split Landau sublevels. Diminishing of the magnetic field is equivalent to adiabatic switching on the SO-interaction, because of increasing term in (1). It is important, that even the level systematics is affected by increasing the SO term , see Fig. 1. For example, the two lowest levels with negative ( and ) should cross the (insensitive to the SO interaction) level as depicted in Fig. 1. We can therefore expect that the energy gap (and the corresponding QH state) disappears at the Fermi level at some specific magnetic fields and for the filling factors and 2, respectively. This simple one-particle picture can be seriously affected by many-body interaction, at least because the Zeeman splitting is known to be subject to exchange-interaction enhancement biasiol04 ; kalin at odd filling factors.

In the QH regime, the bulk and the edge spectra are connected because of the specific QH topology halperin . Thus, the bulk spectrum reconstruction should be revealed in the edge spectrum which can be probed in transport experiment ESreview .
Here, we experimentally demonstrate the simultaneous reconstruction of the bulk and the edge energy spectra caused by strong spin-orbit interaction, at the two lowest filling factors and for two-dimensional electron system with . The observed reconstruction is of different character at these filling factors: it is characterized by zeroing of the energy gap at the levels crossing point at , while the reconstruction at goes through the coexistence of two quantum Hall phases with different spin projections. An analysis indicates a strong influence of many-body interaction on the reconstruction at .
II Samples and technique
Our samples are grown by solid source molecular beam epitaxy on semi-insulating GaAs substrates. The active layer is composed of a 20-nm thick quantum well sandwiched between a lower 50-nm thick and an upper 120-nm thick barriers. Details on the growth parameters can be found elsewhere biasiol05 . The samples are not intentionally doped, but a two-dimensional electron gas is formed in the quantum well due to deep donor levels in the InAlAs barriers biasiol04a . The 2DEG mobility at 4K is about cm2/Vs and the carrier density is cm-2.
The samples are patterned in a quasi-Corbino sample geometry, see for details, Refs. ESreview, ; alida, ; zeeman, . The mesa (about 2x2 mm2) has an etched central region (). Ohmic contacts are placed both at inner and at outer mesa edges. A metallic top gate covers the area between two mesa edges. Thus, because of macroscopic size, the samples allows standard bulk magnetotransport measurements in Corbino topology.
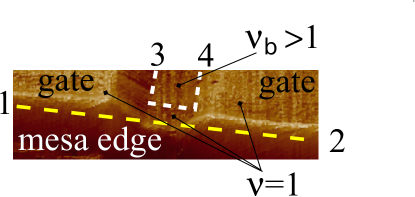
The possibility of local intra-edge transport investigations is provided by a single gate-free region, which connects two mesa edges. This region is narrow (2 m) at the outer mesa edge, see Fig. 2. At the inner edge, this region is of macroscopic size, so the inner Ohmic contacts are connected to the gate-free 2DEG.
The details of both experimental techniques are given in Sections III,IV respectively. To avoid a gate leakage at the mesa step biasiol08 , a 400 nm SiO isolator layer is thermally evaporated before processing of the gate. Thick SiO layer reliably covers the mesa step, so there is no detectable leakage current at low temperatures in the used gate voltage range. All measurements are performed in a dilution refrigerator at the minimal temperature of 60 mK. The obtained results are independent of the cooling cycle.
III Experimental results: Landau fan chart
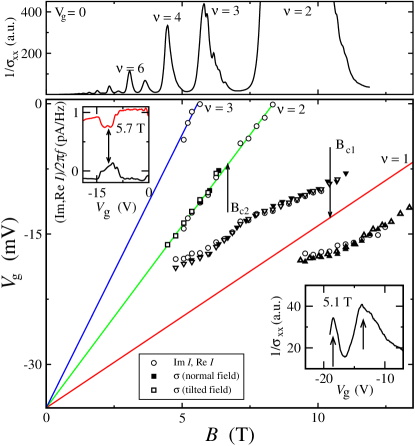
We study the bulk spectrum reconstruction qualitatively by drawing the so-called Landau fan chart, see Fig. 3. Each data point indicates the position of the corresponding QH state in plane. To obtain these points, we apply two different methods.
The first one is based on the so-called magnetocapacitance technique dqw . The advantage of this technique is that the gate-free region has no influence on the magnetocapasitance signal. We modulate the dc gate bias by a small ac voltage (12 mV) and measure an ac current between the gate and one of the Ohmic contacts, see the left inset to Fig. 3. In this case the imaginary part of the current reflects the sample capacitance, while the active component is proportional to the under the gate, see, e.g., Ref. dqw, and references therein.
In the QH regime the bulk of the sample is incompressible, so is a minimum. On the other hand, tends to zero in this regime, which is reflected by a peak in . Thus, the developed minimum/maximum structure in indicates a QH regime. We use a center of this minimum/maximum structure as a position of the QH state in plane highfreq , see Fig. 3.
It is also possible to trace directly as a two-point resistance between one of the inner and one of the outer Ohmic contacts, see the right inset to Fig. 3. The gate-free region is of minimal influence on the two-point resistance because of negligible charge transfer in the narrow gate-gap region at the outer mesa edge, see the Section IV for details. The geometry is still not a perfectly symmetric Corbino disk, so the measured signal includes an unknown geometrical factor. We also depict the positions of the measured peaks in the main field of Fig. 3.
Good coincidence between the data points, obtained by two different methods, guarantees the correctness of the QH state position determination. The methods support each other especially for broad minimum/maximum structures like the ones presented in the insets to Fig. 3, or, on the contrary, for low signals.
The data points for filling factors are concentrated along straight lines in Fig. 3. These lines start from the same onset voltage at zero field, and their slopes relate as the filling factor ratio . We reliably determine the filling factor numbers from a wide set of oscillations at zero gate voltage, see the upper panel in Fig. 3. This behavior confirms the proportionality of the electron concentration to the gate voltage in our samples. The data points appear only at T in low fields in Fig. 3, because the 2DEG mobility decreases strongly at lower 2DEG concentrations biasiol08 .
The experimental fan chart in Fig. 3 has three peculiarities. First, it depends only on the normal field component at low tilt angles (). This is in good correspondence with results of Ref. biasiol04, , where the influence of the in-plane component was only observed at the highest () tilt angles. Second, there are no data points around T for , demonstrating the absence of the QH state in this region. Third, the data points for deviate from the expected fan line. They are concentrated along two overlapping branches. Since these data are obtained in the same range as for , the electron density in fact follows the gate bias. We have to conclude, that the two overlapping branches indicate vtd06 a competition between two QH states at around the critical field T.
Landau fan charts only qualitatively reflect the presence of an energy gap at the Fermi level at some . The quantum wells are characterized by a long-range In concentration modulation biasiol08 . This results in long-range potential fluctuations in the well, which can also be seen nichols ; aristov from wide minimum/maximum structures in the insets to Fig. 3. For this reason, standard bulk quantitative measurements of the gap nichols ; aristov will give the gap values averaged over the sample plane. Instead, we perform local measurements of the energy gap at the Fermi level at by means of the edge transport.
IV Experimental results: local edge investigations
The quasi-Corbino sample geometry is specially designed for local intra-edge transport investigations within the narrow gate-gap region at the mesa edge ESreview . In particular, it allows to obtain the energy gap within the incompressible stripe at the sample edge from the analysis of curves alida ; zeeman .
Since we know the fan chart in Fig. 3, we deplete 2DEG to an integer filling factor at a given magnetic field . The gate-gap region in Fig. 2 is not covered by the gate, so it is characterized by a higher bulk filling factor . In this technique, is necessary integer, while is not. For the case of simplicity, the Fig. 2 is drawn for both integer filling factors and .
Approaching the mesa edge in the gate-gap, the edge potential diminishes the 2DEG concentration in a so-called compressible region at the mesa edge shklovskii . Since the potential of the etched edge is smooth ESreview , the local filling factor is diminishing smoothly from the bulk value to zero at the edge shklovskii . Incompressible stripes of finite width are formed shklovskii along the edge near the integer local filling factors , e.g. at and 1 for . In particular, there is an incompressible stripe at . Thus, despite the presence of the gate-gap region, an entire incompressible QH state at the filling factor separates the outer (1,2) and the inner (3,4) Ohmic contacts in Fig. 2.
This QH region is surrounded by two compressible stripes, see Fig. 2. They run along the mesa edge and the gate edge to outer (1,2) and inner (3,4) Ohmic contacts, respectively. We measure characteristics of the gate-gap junction by applying dc current between the contacts 1,3 and measuring dc voltage drop between the contacts 2,4 in Fig. 2. Because of the macroscopic gate size in our samples, electron transport is only possible across the incompressible stripe in the gate-gap region ESreview ; alida ; zeeman at integer .
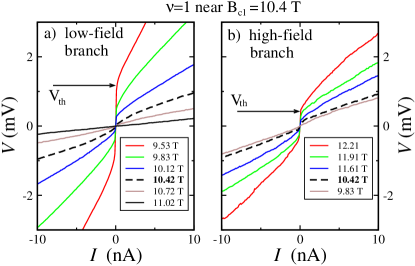
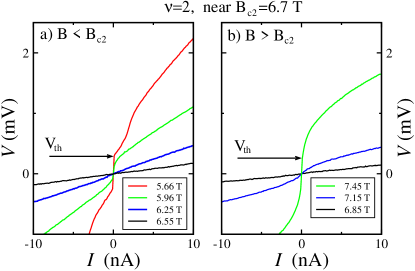
Fig. 4 demonstrates evolution of experimental curves at different magnetic fields along the Landau fan chart line in Fig 3. The experimental curves are strongly nonlinear in the case of developed QH state. They tend to be linear in the region of QH state disappearance near T.
For the filling factor , curves are presented in Fig. 5. The non-linearity is monotonically decreasing along the upper (low-field) branch of the fan, see Fig. 5 (a). It is monotonically increasing along the lower (high-field) branch in Fig. 5 (b). s from two different branches coincide in the magnetic field T.
The non-linear behavior originates from the edge potential deformation within the incompressible stripe by the applied electrochemical potential imbalance alida ; zeeman . In our setup, positive voltage imbalance diminishes the potential jump within the incompressible stripe. In Figs. 4,5 a noticeable current appears only at some positive threshold voltage , which flattens the edge potential completely positive . Thus, the value allows to estimate alida ; zeeman ; biasiol11 the local energy gap within the incompressible stripe at the filling factor .
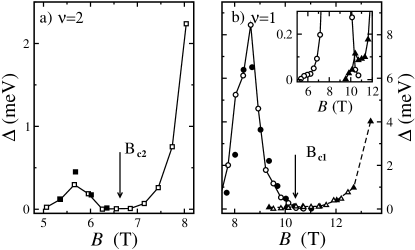
The obtained is shown in Fig. 6 for both filling factors . Non-zero gap appears together with the corresponding fan line in Fig. 3 and is rising in low fields. At higher fields, the dependence is not monotonous: for the filling factor the gap is a zero around ; for the filling factor , the gap is diminishing to zero along the upper (low-field) fan branch and is rising along the down (high-field) one. These two dependencies for intersect each other in the field T. Even in the highest accessible fields for is far from the expected linear Zeeman behavior.
This is exactly the behavior which we can qualitatively expect from the fan chart. Similarly to the fan chart, the gap behavior is independent of the in-plane field component at low tilt angles . It is important, that the gate-gap region is not covered by the gate. Thus, the observed behavior is determined by 2DEG itself and is not connected with the gate fabrication.
The locally determined gap is free from the influence of the long-range potential fluctuations in the sample zeeman . These fluctuations can only shift the geometrical position of the continuous incompressible stripe. Thus, is obtained exactly at the filling factor , in contrast to the bulk measurements nichols ; aristov . On the other hand, because of the energy levels broadening by the short-range disorder, the gap is the mobility gap zeeman , similarly to one obtained in the bulk activation measurements nichols . It is systematically less alida ; zeeman ; biasiol11 than the spectrum gap, also due to electron heating biasiol11 . Since the gap is determined by charge transport, it is characterized by momentum and is therefore subject to exchange enhancement kalin .
V Discussion
Let us summarize the main experimental results: (i) the simultaneous bulk and edge energy spectra reconstruction occurs at some specific magnetic fields (ii) for , the gap at the Fermi level is a zero around , and opens to both sides of this region; (iii) for , there is a competition of different QH states around field; (iv) the gap at is only controlled by the normal field component for low tilt angles.
This behavior is impossible for a conventional single-subband 2DEG with weak SO coupling. We have to conclude that it originates from the strong spin-orbit coupling in our samples.
In this case QH state behaves as it can be expected from the single-particle Eq. (1), see Fig. 1. Because of levels crossing, the energy gap at the Fermi level is a zero around which results in the disappearance of the QH state in this region.
For , the coexistence of two QH states around can also be anticipated even from the single-particle Eq. (1). As it can be seen from Fig. 1, the transition at is the transition between the two spin-polarized QH states with opposite spin polarizations. It is not too astonishing that the transition goes through the coexistence of these phases around vtd06 . By contrast, two energy levels are filled at , so the QH state is spin unpolarized.
The edge transport provides an additional proof for the proposed picture. The non-linear curve indicates the presence of the incompressible stripe in the gate-gap region ESreview . Since s are non-linear in Fig. 5 for both branches of the fan line, there are two incompressible stripes in the gate-gap region of the sample around . Both these stripes belong to the QH state but they are deviated from the exact position at the local filling factor , similarly to the fan branches. It’s worth noting, that the strictly linear fan line in Fig. 3 ensures the 2DEG macroscopic homogeneity.
An accurate interpretation of our experimental results should undoubtedly include many-body effects, which are of primary importance at least at , see Refs. kalin, ; nichols, ; aristov, . We are unaware of such theories. The first and very naive attempt is to obtain and from single-particle Eq. (1) and to assume an exchange-enhanced value of factor for only. The values of the critical fields can be easily calculated from Eq. (1): and . Their comparison results in at . This value is not far from that expected for InGaAs systems kita ; gui ; biasiol04 . Moreover, the crucial role of the exchange enhancement is also confirmed by the the independence of the experimental data of the in-plane field component kalin ; shmeller ; khrapai . The corresponding SO parameter T is high enough to explain why the gap for is far from the expected linear Zeeman behavior even in the highest fields in Fig. 6. The resulting SO parameter eVm is near the highest values, known for InGaAs systems.
It’s worth noting, that the Dresselhaus-type SO coupling gives the energy spectrum similar winkler to Eq. (1). However, the obtained parameter is too big for the known Dresselhaus SO coupling constant (133 eV in InAs). This is in a good correspondence with the experimental nitta fact that the SO coupling is of Rashba type for narrow asymmetric quantum wells. We wish to mention here, that consistent accounting for the many-body interaction can affect these estimates.
VI Conclusion
As a result, we experimentally demonstrate the simultaneous reconstruction of the bulk and the edge energy spectra caused by strong spin-orbit interaction, at the two lowest filling factors and for two-dimensional electron system with . The observed reconstruction is of different character at these filling factors: it is characterized by zeroing of the energy gap at the levels crossing point at , while the reconstruction at goes through the coexistence of two quantum Hall phases with different spin projections. An analysis indicates a strong influence of many-body interaction on the reconstruction at .
Acknowledgements.
We wish to thank V.T. Dolgopolov, V.S. Khrapai, and D.E. Feldman for fruitful discussions. We gratefully acknowledge financial support by the RFBR and RAS.References
- (1) S. Datta and B. Das, Appl. Phys. Lett. 56, 665 (1990).
- (2) R. Winkler, Spin-Orbit Coupling Effects in Two-Dimensional Electron and Hole Systems, Springer Tracts in Modern Physics 191, (2003).
- (3) Daniele Ercolani, Giorgio Biasiol, Emiliano Cancellieri, Marcello Rosini, Carlo Jacoboni, Franco Carillo, Stefan Heun, Lucia Sorba, and Frithjof Nolting, Phys. Rev. B 77, 235307 (2008).
- (4) Nitta, T. Akazaki, H. Takayanagi, and T. Enoki, Phys. Rev. Lett. 78, 1335 (1997).
- (5) T. Kita, Y. Sato, S. Gozu, and S. Yamada, Physica B 298, 65 (2001)
- (6) Y. S. Gui, C. M. Hu, Z. H. Chen, G. Z. Zheng, S. L. Guo, J. H. Chu, J. X. Chen, and A. Z. Li, Phys. Rev. B 61, 7237 (2000).
- (7) W. Desrat, F. Giazotto, V. Pellegrini, F. Beltram, F. Capotondi, G. Biasiol, L. Sorba, and D. K. Maude, Phys. Rev. B 69, 245324 (2004).
- (8) M. A. Hidalgo, R. Cangas, arXiv:1201.2516
- (9) Yu.A. Bychkov and E.I. Rashba, JETP Lett., 39, 66 (1984); 6039 J. Phys. C 17 (1984).
- (10) T. Ando and Y. Uemura, J. Phys. Soc. Jpn. 37, 1044 (1974) [CAS]; Yu. A. Bychkov, S. V. Iordanskii, and G. M. Eliashberg, JETP Lett. 33, 143 (1981); C. Kallin and B. I. Halperin, Phys. Rev. B 30, 5655 (1984).
- (11) B. I. Halperin, Phys. Rev. B 25, 2185 (1982).
- (12) F. Capotondi, G. Biasiol, D. Ercolani, V. Grillo, E. Carlino, F. Romanato, and L. Sorba, Thin Solid Films 484, 400 (2005).
- (13) F. Capotondi, G. Biasiol, I. Vobornik, L. Sorba, F. Giazotto, A. Cavallini, and B. Fraboni, J. Vac. Sci. Technol. B 22, 702 (2004).
- (14) For a review on intra-edge transport experiments in quasi-Corbino geometry see E. V. Deviatov, Physics-Uspekhi 50 (2) 197 (2007); E. V. Deviatov and A Lorke, phys. stat. sol. (b) 245, 366 (2008).
- (15) A. Würtz, R. Wildfeuer, A. Lorke, E. V. Deviatov, and V. T. Dolgopolov, Phys. Rev. B 65, 075303 (2002).
- (16) E.V. Deviatov, A. Lorke, G. Biasiol, L. Sorba, W. Wegscheider, JETP Lett. 92, 69 (2010).
- (17) V. T. Dolgopolov, A. A. Shashkin, E. V. Deviatov, F. Hastreiter, M. Hartung, A. Wixforth, K. L. Campman, and A. C. Gossard Phys. Rev. B 59, 13235 (1999).
- (18) It’s worth noting, that the experimental traces like in the left inset to Fig. 3 are obtained in a so-called high frequency regime dqw despite the low ac frequency of 2 Hz.
- (19) V. T. Dolgopolov, E. V. Deviatov, V. S. Khrapai, D. Reuter, A. D. Wieck, A. Wixforth, K. L. Campman, and A. C. Gossard Phys. Stat. Sol. (b) 243, 3648 (2006).
- (20) A. Usher, R. J. Nicholas, J. J. Harris, and C. T. Foxon, Phys. Rev. B 41, 1129 (1990).
- (21) V. T. Dolgopolov, A. A. Shashkin, A. V. Aristov, D. Schmerek, W. Hansen, J. P. Kotthaus, and M. Holland, Phys. Rev. Lett. 79, 729 (1997)
- (22) D. B. Chklovskii, B. I. Shklovskii, and L. I. Glazman, Phys. Rev. B 46, 4026 (1992).
- (23) We use positive as a measure of the local gap, because in our setup it is positive imbalance which flattens the edge potential. This was demonstrated experimentally in Refs. alida, ; ESreview, ; zeeman, from the analysis of strongly asymmetric curves. This asymmetry was a result of strongly different Zeeman and cyclotron gap values in GaAs. This is not the case for the present InGaAs system especially near and , see Figs. 4,5.
- (24) Nicola Paradiso, Stefan Heun, Stefano Roddaro, Lucia Sorba, Fabio Beltram, and Giorgio Biasiol, Phys. Rev B 84, 235318 (2011).
- (25) A. Schmeller, J. P. Eisenstein, L. N. Pfeiffer, and K. W. West, Phys. Rev. Lett. 75, 4290 (1995).
- (26) V. S. Khrapai, A. A. Shashkin, E. L. Shangina, V. Pellegrini, F. Beltram, G. Biasiol, and L. Sorba Phys. Rev. B 72, 035344 (2005).