HST narrow-band search for extended Ly emission around two quasars
Abstract
We search for extended Ly emission around two quasars, SDSS J1030+0524 () and SDSS J1148+5251 () using WFC3 narrow-band filters on board the Hubble Space Telescope. For each quasar, we collected two deep, narrow-band images, one sampling the Ly line+continuum at the quasar redshifts and one of the continuum emission redwards of the line. After carefully modeling the Point Spread Function, we find no evidence for extended Ly emission. These observations set 2- limits of (Ly, extended) erg s-1 for J1030+0524 and (Ly, extended) erg s-1 for J1148+5251. Given the star formation rates typically inferred from (rest-frame) far–infrared measurements of quasars, these limits are well below the intrinsic bright Ly emission expected from the recombination of gas photoionized by the quasars or by the star formation in the host galaxies, and point towards significant Ly suppression or dust attenuation. However, small extinction values have been observed along the line of sight to the nuclei, thus reddening has to be coupled with other mechanisms for Ly suppression (e.g., resonance scattering). No Ly emitting companions are found, down to a 5- sensitivity of erg s-1 cm-2 arcsec-2 (surface brightness) and erg s-1 cm-2 (assuming point sources).
Subject headings:
quasars: general — quasars: individual (J1030+0524, J1148+5251) — galaxies: halos — galaxies: formation1. Introduction
The host galaxies of very high- quasars (), harboring M⊙ black holes, are thought to reside in the highest density peaks in the universe (e.g., Volonteri & Rees, 2006). Abundant cold gas reservoirs are necessary to feed the black hole growth in such a short time (the universe at is less than Gyr old). Such gas reservoirs would also likely be sites of extensive star formation. Studying host galaxies of quasars at is therefore one way to study the build-up of the first massive galaxies.
Indeed, a large fraction (30–50 %) of the quasars observed at (sub-)mm wavelengths have been detected, revealing far-infrared (FIR) luminosities L⊙ (Priddey et al., 2003; Bertoldi et al., 2003; Wang et al., 2008a, 2011; Leipski et al., 2010). The spectral energy distributions of these objects suggest that star formation (rather than black hole accretion) is powering dust heating (Beelen et al., 2006; Leipski et al., 2010; Wang et al., 2011). The associated star formation rates (SFRs) easily exceed several hundred M⊙ yr-1. Such high star formation rates are in agreement with the detection of bright [C ii] emission that is extended on kpc scales (e.g. Maiolino et al., 2005; Walter et al., 2009). Similarly, direct evidence for significant molecular gas reservoirs, exceeding M⊙, in quasar host galaxies has now been firmly established through observations of the redshifted CO emission (Bertoldi et al., 2003; Walter et al., 2003, 2004; Carilli et al., 2007; Wang et al., 2007, 2011; Riechers et al., 2009).
Despite these increasing observational constraints, several questions remain unanswered: How do quasar host galaxies accrete their gas? Is the gas dynamically cold, and accreting through filaments (see, e.g., Haiman & Rees, 2001; Dekel et al., 2009; Dubois et al., 2012; Di Matteo et al., 2012)? Are host galaxies severely obscured? What is the escape fraction of UV and Ly photons produced in these supposedly huge star formation events (Dayal et al., 2009)?
Key information to address these questions may come from the detection of extended UV and Ly emission around high- quasars, in particular the luminosity, physical extent and morphology of their host galaxies and halos. Extended Ly emission around radio galaxies and low- quasars has been reported in the literature (e.g., Reuland et al., 2003; Weidinger et al., 2005; Francis & McDonnell, 2006; Christensen et al., 2006; Barrio et al., 2008; Smith et al., 2009); however, so far deep observations have only been performed for one quasar, J2329-0301 (Goto et al., 2009, 2012; Willott et al., 2011), using ground-based imaging and spectroscopic observations.
The present study aims to detect extended Ly emission around two quasars (for which suitable narrow-band filters exist), SDSS J103027.10+052455.0 (Fan et al., 2001, ; hereafter, J1030+0524) and SDSS J114816.64+525150.3 (Fan et al., 2003, ; hereafter, J1148+5251). The unique angular resolution offered by the Hubble Space Telescope (HST) allows us to disentangle the unresolved quasar light from any extended emission. We use the new narrow-band imaging capabilities offered by the Wide Field Camera 3 (WFC3) in order to sample both the pure continuum (‘OFF’ images) redwards of Ly and the Ly + continuum (‘ON’ images). Through accurate modeling of the PSF and its uncertainties, we will be able to constrain the presence of extended emission around the target quasars.
Throughout the paper we will assume a standard cosmology model with km s-1 Mpc-1, and .
2. WFC3 observations
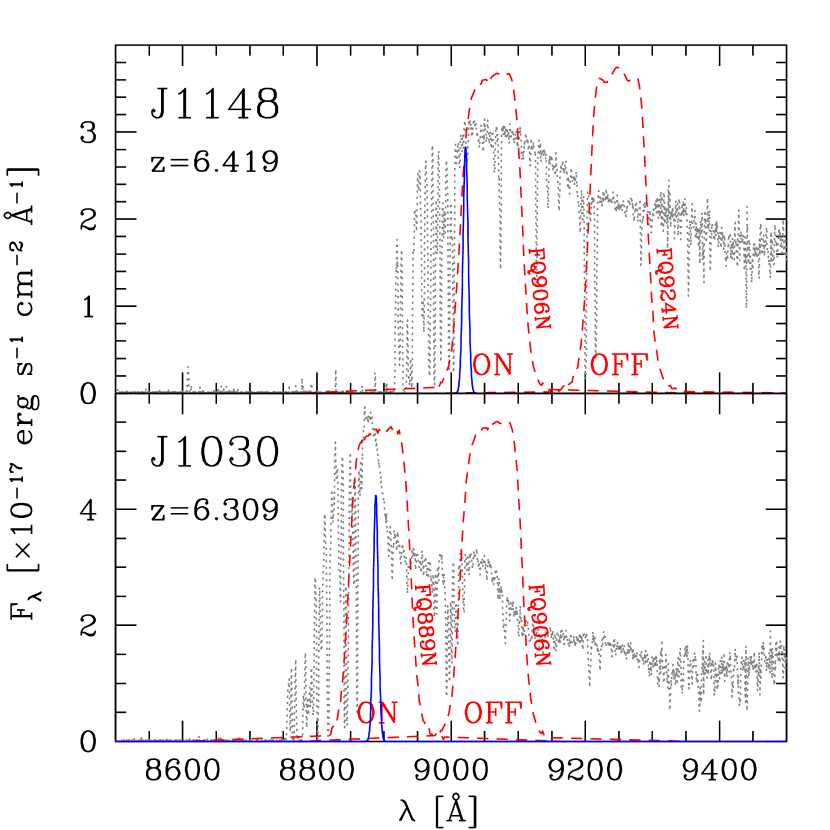
We use the ‘quad-filters’, i.e., a set of four different narrow-band filters, each covering simultaneously about 1/6 of the WFC3/UVIS field of view ( arcmin2). For J1030+0524 (J1148+5251), we used the FQ889N (FQ906N) filter for the ON images and FQ906N (FQ924N) for the OFF images. Figure 1 illustrates the throughput curves of the adopted filters, the spectra of the quasars and the redshift of the predicted Ly emission from their host galaxies. The redshift is accurately defined by the CO and [C ii] redshift of the source in the case of J1148+5251 and by the MgII line for J1030+0524.
Observations were carried out during HST Cycle 17 (proposal ID: 11640). J1030+0524 was observed in two complete Observing Blocks (OBs; executed on 2010-01-28 and 2011-01-15) in both the ON and OFF setups (total integration time per OB: 5660 s in the ON setup, 5633 s in the OFF setup). During each OB, the ON and OFF observations were performed subsequently, in a ON-OFF-OFF-ON sequence. J1148+5251 was observed once (2011-03-06) in the ON and OFF setups (total integration time: 6183 s for the ON setup, 6167 s for the OFF setup).
Our analysis is based on data products delivered by the HST pipeline. Photometry is defined following the WFC3 handbook111http://www.stsci.edu/hst/wfc3/phot_zp_lbn. Theoretical zero points in the AB system are computed based on the PHOTFLAM and PHOTPLAM keywords and further corrected to account for the deviations from on-sky to theoretical zero points.
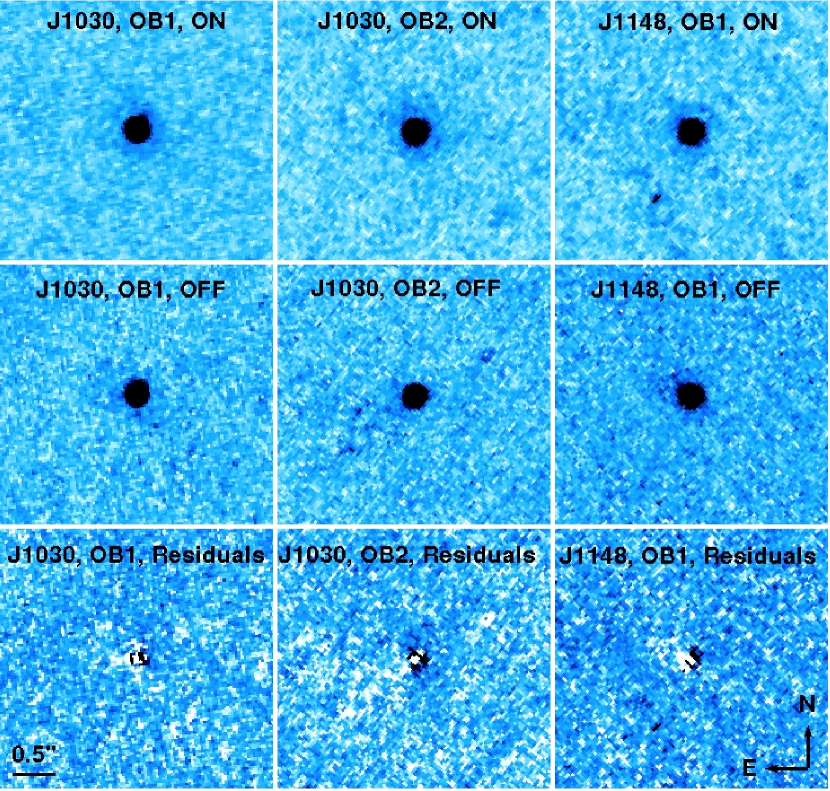
Figure 2 shows the pipeline-reduced images of J1030+0524 and J1148+5251 in the three OBs used in this study. We do not stack the two OBs available for J1030+0524, in order to preserve the PSF properties in the two observations (collected on different dates), and to have a better control of the noise properties of the background.
The measured aperture magnitudes of the two quasars in all the OBs are consistent within 0.2 mag with the expected fluxes as derived from the spectroscopy (see Figure 1). This small difference is likely due to absolute flux calibration uncertainties, slit flux losses in the spectra and intrinsic quasar variability.
3. PSF models
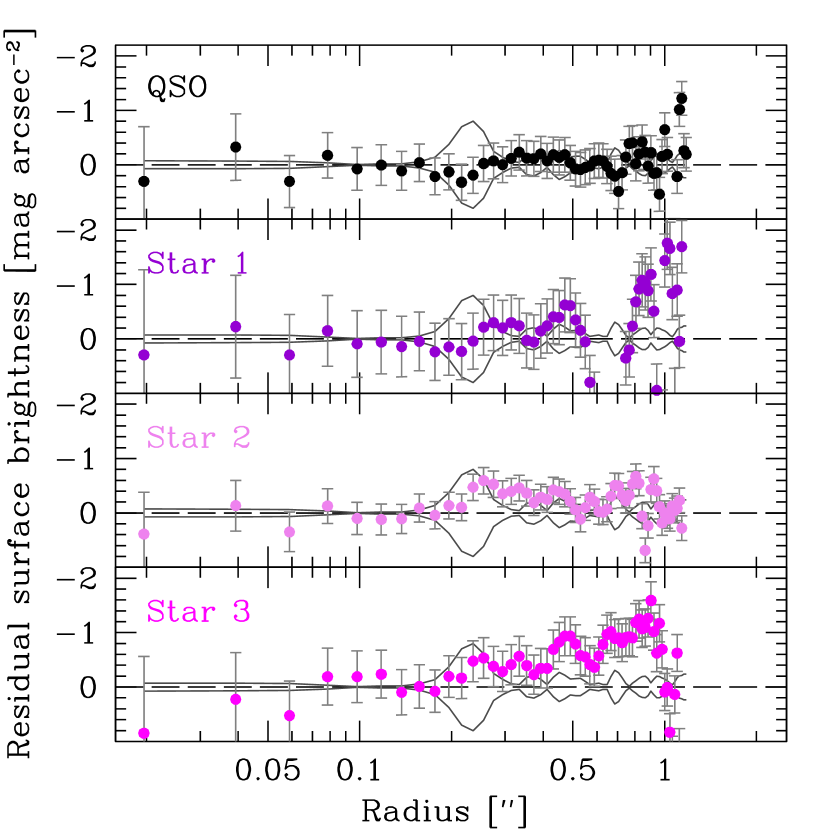
In order to put constraints on extended Ly emission in our targets, we need to model the dominant emission due to the central (unresolved) quasar. A common practice in quasar host galaxy studies is to model the quasar emission based on the images of foreground stars in the field (see, e.g., Kotilainen et al., 2009). This approach is sensitive to spatial variations of the PSF across the field. In order to evaluate these variations, we compare the radial profile of three stars in the field of J1030+0524 (OB2, ON; the field of J1148+5251 does not contain suitable stars and therefore cannot be used for this experiment). Figure 3, left shows the surface brightness profiles of these sources after the subtraction of a common Tiny Tim PSF model centered at the quasar position. The PSF quality degrades (i.e., PSF wings are more prominent) as the distance from the quasar position increases. Thus the PSF of field stars cannot be used as a model for the quasar PSF.
Alternatively, one can use the OFF frames (including only the continuum emission) to model the quasar image in the ON images. The major advantage here is that the frames are always centered on the target (i.e., field variations of the PSF are minimized) and observations are carried out with the same focus conditions. However, this approach relies on the hypothesis that the quasar host galaxy does not show any extended emission in the continuum, which is an assumption we first need to test.
We therefore use HST PSF models as simulated using Tiny Tim. According to the WFC3 handbook, the PSF Full Width at Half Maximum (FWHM) shows 0.3% variations as a function of the HST “breathing” (i.e., focus variations due to various causes, including thermal expansion of the satellite) at nm, decreasing with increasing wavelength. According to focus variation models222http://www.stsci.edu/hst/observatory/focus/FocusModel/#5, the focus changed significantly during the execution of the OBs. Nevertheless, variations of the PSF at these wavelengths are limited: Figure 3, right compares the radial light profile of the model PSF at the average, highest and lowest values of the focus during the execution of the various OBs. The most important variations appear at aperture radii between and . From these models, we adopt the PSF models that best match the observed quasar profile at these radii.
PSF uncertainties shown in Fig. 3 are defined as the quadrature sum of the PSF variations due to focus fluctuations and formal uncertainties in the PSF profile due to pixelization, Poissonian errors and background rms.
4. Results
In this section we describe how we use these data to search for Ly emission arising from the host galaxies (Sec. 4.1), from any filamentary structure around the quasars (Sec. 4.2) and from possible companion sources (Sec. 4.3). We then present the results for our two sources.
4.1. Extended Ly emission in the host galaxies
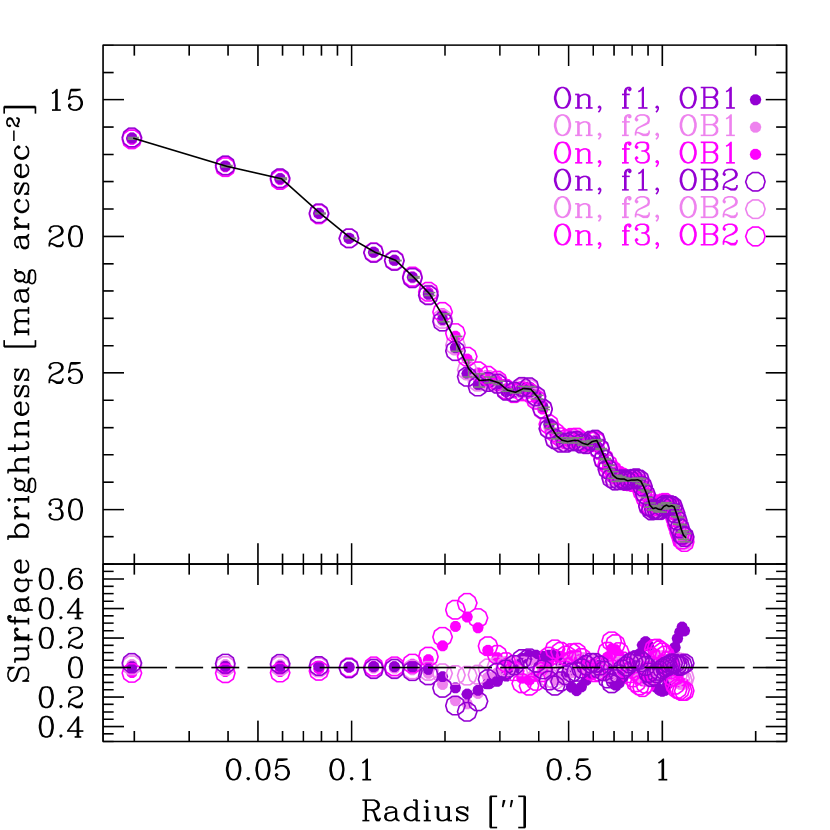
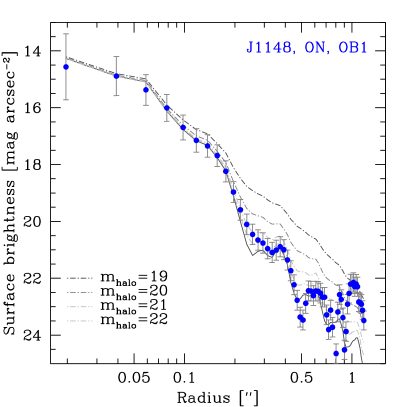
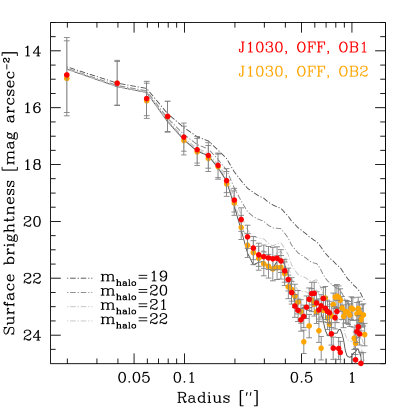
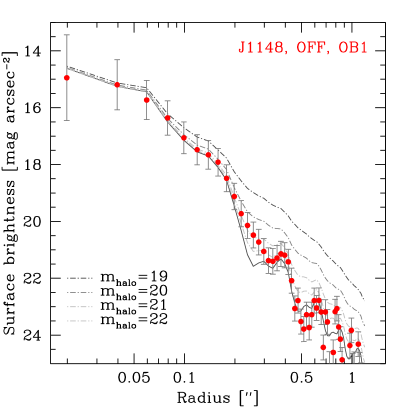
In order to investigate the presence of any extended emission arising from the host galaxies of our targets, we compare the observed ON and OFF light profiles of the observed quasars with those of the PSF models (Fig. 4). The PSF model is normalized to match the observed total flux of the quasar. Using GALFIT (v. 3.0.2 Peng et al., 2002, 2010), we simulate the light profile of a host galaxy of total magnitudes 19, 20, 21 and 22 mag (AB system). We assumed a Sersic profile with ellipticity=0.5, , and ( kpc at the redshift of our targets) and =2. The sampled range of effective radii is defined to reproduce the size of the Ly extended emission reported by Willott et al. (2011) in J2329-0301 at (diameter of kpc) and more compact CO and [C ii] emission in the host galaxy of J1148+5251, as reported by Walter et al. (2004) and Riechers et al. (2009) (CO: 2.5 kpc) and Walter et al. (2009) ([C ii]: 1.5 kpc). We find that our results are practically independent of the ellipticity and the effective radius of the host galaxy model for .
4.2. Signatures of gas accretion
According to the models by Haiman & Rees (2001), the Ly emission arising from gas surrounding quasar host galaxies at high- can be as bright as erg s-1 cm-2 arcsec-2. More recently, Goerdt et al. (2010) showed that cold gas accreting can give rise to significant (up to few times erg s-1 cm-2 arcsec-2 for relatively massive galaxies at ) Ly emission on 10–100 kpc scales. Such streams are potentially able to survive quasar feedback at very high- (Di Matteo et al., 2012).
In order to identify any pure line extended emission around the quasars, we create ‘residual’ images by subtracting properly scaled OFF images from the line+continuum images (‘ON’). The scaling is set to match the total flux observed in the central 55 pixels (, roughly corresponding to the core of the PSF). The resulting ‘residual’ images therefore are quasar-subtracted and allow us to investigate the presence of any extended, pure-line emission around the quasars (Fig. 2, bottom panels).
4.3. Ly emitting companions
Finally, we compare the sources detected in the ON images with those in the OFF images, in order to look for Ly emitters in the field of our quasars. The FQ889N and FQ906N filters are sensitive to Ly emission arising from objects in the redshift ranges and respectively, each corresponding to a comoving volume of 0.18 Mpc3 (in the 1 arcmin2 field of view). The 5- detection limit for point-sources in these two filters is 23.43 mag and 23.37 mag ( erg s-1 cm-2 and erg s-1 cm-2) respectively. The observed number density of Ly emitters exceeding this flux limit in a blank field at is Ly emitter per arcmin2 (e.g., Ouchi et al., 2010). This implies that no Ly emitter is expected in this volume, for any reasonable overdensity, given our sensitivity.
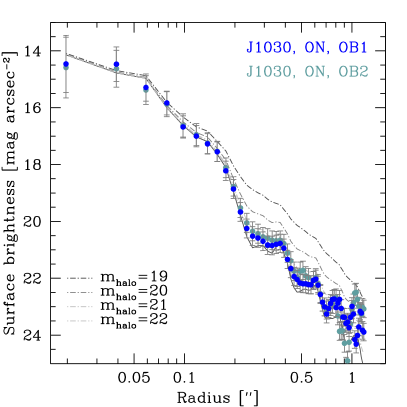
4.4. Results for J1030+0524
The light profiles of J1030+0524 (Fig. 4) do not show any extended component. The small light excesses in the OFF observations (of both OBs) at radii are due to cosmic ray residuals which are observed in different positions in the two OBs (see Figure 2). We can set an upper limit to the magnitude of the extended component by comparing the observed profile with the ones simulated using GALFIT. We focus on the scale, i.e., where the deviations from a PSF are expected to be significant but the signal is still high and the PSF models are still reliable. Given the uncertainties in the observed light profiles and in the PSF model, a host of mag, both for the line and the continuum, is ruled out at 2-. Assuming a gaussian model for the Ly line emission, with FWHM=300 km s-1 and centered at the redshift of the quasar (, see Figure 1), we convert the limit set by the ON images into a Ly flux limit taking into account the actual throughput curve of the filter and the redshift of the quasar host. We find (Ly,host) erg s-1 cm-2, i.e., (Ly,host) L⊙ or erg s-1. For the continuum, assuming an SED with constant for the -correction, we obtain a limit on the UV rest-frame luminosity of the host of mag.
A visual inspection of the ‘Residual’ images reveal no significant filamentary structure within few arcsec of the source. The comparison between the images of the two OBs allow us to discard all the low-significance blobs within from the quasar as cosmic ray residuals. We estimate a 5- surface brightness sensitivity of erg s-1 cm-2 arcsec-2 (using a 1 arcsec2 aperture). As expected, no Ly emitter is found in the 1 arcmin2 field around the quasar, down to a point-source sensitivity of erg s-1 (5-).
4.5. Results for J1148+5251
The light profile of J1148+5251 also does not show any extended component. In this case a small excess is seen at in the ON observation. This is most likely due to an observational artifact (see below). Following the same approach as adopted for J1030+0524, we can exclude a host galaxy brighter than mag in the ON image (the light profile being perfectly consistent with a point-source), and mag for the continuum. These limits yield a Ly flux from the host of erg s-1 cm-2, i.e., (Ly,host) L⊙ or erg s-1. The limit on the host continuum is mag.
Our observations of J1148+5251 have a depth similar to those of J1030+0524, yielding similar limits on the surface brightness ( erg s-1 cm-2 arcsec-2 at 5- significance, for a 1 arcsec2 aperture). A bright spot is observed South of the quasar in the ON image (see Fig. 2), but a careful inspection of the individual frames reveals that it is most likely a cosmic ray residual. No other sources exceed the 5- sensitivity limit for point sources (corresponding to Ly luminosities of erg s-1) within 1 square arcmin around the quasar.
5. Discussion and conclusions
Our observations set limits on the extended emission of the UV continuum and of the Ly emission in two quasar host galaxies at . The former are not very stringent (due to the narrow width of the filters adopted in our study). Using the UV continuum luminosity as a probe of star formation (Kennicutt, 1998), we obtain a 2- limit on the UV–based SFR of M⊙ yr-1, assuming a Salpeter IMF. These UV–based limits are in broad agreement with the FIR–based estimates of SFR1700–3000 M⊙ yr-1 reported for J1148+5251 (Maiolino et al., 2005; Walter et al., 2009) if a modest extinction correction ( mag) is applied.
On the other hand, the limits on the extended Ly luminosity put tighter constraints on the physical properties of our targets. Two obvious sources of ionizing radiation are present in our targets, namely the accreting black holes and (at least for J1148+5251) the intense starburst seen at mm wavelentghs. Both these processes are expected to power Ly emission. If Ly emission is powered by the quasar emission, we can estimate the expected Ly emission from the host galaxies by modeling the ISM as cold gas clouds absorbing and re-emitting the light from the quasar. In this scenario, modulo geometrical factors of the order of unity, and assuming that the ISM clouds are optically thick to ionizing photons, the Ly luminosity would be:
| (1) |
where is the covering factor of the clouds and is the ionizing luminosity arising from the black hole accretion (Hennawi & Prochaska, 2012). Extrapolating the quasar SED observed in the rest-frame UV and optical wavelengths using the template by Elvis et al. (1994), we estimate that erg s-1 for the two sources. Assuming =0.1, we infer expected Ly luminosities of erg s-1, i.e., one order of magnitude higher than the upper limits set by our observations (provided that the ISM clouds are distributed over a kpc scale or more, i.e., resolved in our observations).
If Ly emission is associated with star formation, we can infer Ly luminosities from the FIR-based estimates of the SFR (through the SFR–H relation reported in Kennicutt, 1998), by assuming a standard case B recombination factor of 8.7 for the Ly/H luminosity ratio,:
| (2) |
In the case of J1148+5251, with a star formation rate of 1700–3000 (Maiolino et al., 2005; Walter et al., 2009), this implies an expected Ly luminosity of erg s-1, i.e., one order of magnitude higher than the limit set by our observations.
This difference between expected Ly luminosities and the observational constraints can be explained by invoking some mechanisms to suppress Ly emission. Dust extinction is likely playing a role. A factor ( mag) of extinction is required to explain our limits. Such a high extinction value is not unexpected in FIR-bright sources, but is at odds with the relatively low extinction observed towards the central quasar: Gallerani et al. (2010) collected low-resolution spectroscopy of the rest-frame UV emission for a number of high- quasars, including the two in our sample, and computed extinction values at 3000 Å (rest frame). They find no significant reddening for J1030+0524 and mag (i.e., mag at the wavelengths probed in the present study) for J1148+5251. These relatively modest extinction values, compared with the limits set by our observations, suggest a different geometry for the highly–opaque dust associated with the kpc-wide starburst and the optically–thinner dust along the line of sight to the quasar (we note however that FIR-bright quasars tend to have faint Ly nuclear emission as well; see, e.g., Wang et al., 2008b). Alternatively, resonance scattering may prevent Ly emission from emerging out of the star forming regions. While this effect alone is not sufficient to explain the lack of strong Ly extended emission, it could mitigate the discrepancy if coupled with dust extinction: In this scenario, Ly photons from the host repeatedly bounce among optically-thick clouds through dusty regions, and get significantly extincted before escaping the host galaxy. Alternatively, Ly emission may be dim due to a deficit of neutral hydrogen around these bright quasars (see, e.g., Francis & Bland-Hawthorn, 2004). This scenario, however, would be in contrast with the large reservoirs of cold gas observed at mm-wavelengths.
It is interesting to compare our limits with the extended Ly emission reported around another quasar, J2329-0301 (). Goto et al. (2009) report a diffuse Ly emission of erg s-1 cm-2 Å-1 over an extended region () based on narrow-band imaging with the 8.2m Subaru telescope. This implies a diffuse Ly luminosity of erg s-1, comparable to the limits set by our observations333Goto et al. (2009) estimate a corresponding Ly luminosity of erg s-1, using (Ly)= () , where =300 km s-1 is the line width, is the speed of light, is the observed wavelength of redshifted Ly, and =60% is a Ly to total (Ly+cont) correction factor. However, we point out that in order to retrieve the correct estimate of the Ly flux, one should use the filter width ( Å) instead of the expected line width ( Å), making the true flux times larger.. More recently, the same group reported spectroscopic observations of the same source (Goto et al., 2012). The extended Ly emission has an integrated flux of erg s-1 cm-2, i.e., 20 times fainter than the value reported in their imaging observations. Willott et al. (2011), using long-slit spectroscopy also, found evidence of extended Ly emission around the same source. However, they report a lower limit on the Ly flux of erg s-1 cm-2 (the lower limit is due to slit losses and masking of the quasar-dominated area). These last values are comparable with the upper limits set by our observations. Following the same approach as in Willott et al. (2011), we re-analysed the Keck HIRES spectra of J1030+0524 and J1148+5251 presented in Bolton et al. (2012). No Ly emission is observed on scales exceeding the seeing radius, down to limits comparable with those set by our imaging study. If Ly halos were present around the two targets examined in our work, they are less prominent than the one reported in J2329-0301.
Acknowledgments
We thank the anonymous referee for useful comments which improved the quality of the manuscript. We thank C. Leipski and E. Lusso for fruitful discussions on the quasar SEDs. Support for this work was provided by NASA through grant HST-GO-11640 from the Space Telescope Science Institute, which is operated by AURA, Inc., under NASA contract NAS5-26555.RD acknowledges funding from Germany’s national research centre for aeronautics and space (DLR, project FKZ 50 OR 1104). XF acknowledge support from NSF grant AST 08-06861 and a David and Lucile Packard Fellowship. MAS acknowledges support of NSF grant AST-0707266.
References
- Barrio et al. (2008) Barrio F.E., Jarvis M.J., Rawlings S., Bauer A., Croft S., Hill G.J., Manchado A., McLure R.J., et al., 2008, MNRAS, 389, 792
- Beelen et al. (2006) Beelen A., Cox P., Benford D.J., Dowell C.D., Kovács A., Bertoldi F., Omont A., Carilli C.L., 2006, ApJ, 642, 694
- Bertoldi et al. (2003) Bertoldi F., Carilli C.L., Cox P., Fan X., Strauss M.A., Beelen A., Omont A., Zylka R., 2003, A&A, 406, L55
- Bolton et al. (2012) Bolton J.S., Becker G.D., Raskutti S., Wyithe J.S.B., Haehnelt M.G., Sargent Wallace L.W., 2012, MNRAS, 419, 2880
- Carilli et al. (2007) Carilli C.L., Neri R., Wang R., Cox P., Bertoldi F., Walter F., Fan X., Menten K., Wagg J., Maiolino R., et al., 2007, ApJ, 666, L9
- Christensen et al. (2006) Christensen L., Jahnke K., Wisotzki L., Sánchez S.F., 2006, A&A, 459, 717
- Dayal et al. (2009) Dayal P., Ferrara A., Saro A., Salvaterra R., Borgani S., Tornatore L., 2009, MNRAS, 400, 2000
- Dekel et al. (2009) Dekel A., Birnboim Y., Engel G., Freundlich J., Goerdt T., Mumcuoglu M., Neistein E., Pichon C., et al., 2009, Nature, 457, 451
- Di Matteo et al. (2012) Di Matteo T., Khandai N., DeGraf C., Feng Y., Croft R.A.C., Lopez J., Springel V., 2012, ApJ, 745, L29
- Dubois et al. (2012) Dubois Y., Pichon C., Haehnelt M., Kimm T., Slyz A., Devriendt J., Pogosyan D., 2012, MNRAS (arXiv:1112.2479)
- Elvis et al. (1994) Elvis M., Wilkes B.J., McDowell J.C., Green R.F., Bechtold J., Willner S.P., Oey M.S., Polomski E., Cutri R., 1994, ApJS, 95, 1
- Fan et al. (2001) Fan X., Narayanan V.K., Lupton R.H., Strauss M.A., Knapp G.R., Becker R.H., White R.L., Pentericci L., et al., 2001, AJ, 122, 2833
- Fan et al. (2003) Fan X., Strauss M.A., Schneider D.P., Becker R.H., White R.L., Haiman Z., Gregg M., Pentericci L., et al., 2003, AJ, 125, 1649
- Francis & Bland-Hawthorn (2004) Francis P.J., Bland-Hawthorn J., 2004, MNRAS, 353, 301
- Francis & McDonnell (2006) Francis P.J., McDonnell S., 2006, MNRAS, 370, 1372
- Gallerani et al. (2010) Gallerani S., Maiolino R., Juarez Y., Nagao T., Marconi A., Bianchi S., Schneider R., Mannucci F., et al., 2010, A&A, 523, 85
- Goerdt et al. (2010) Goerdt T., Dekel A., Sternberg A., Ceverino D., Teyssier R., Primack J.R., 2010, MNRAS, 407, 613
- Goto et al. (2009) Goto T., Utsumi Y., Furusawa H., Miyazaki S., Komiyama Y., 2009, MNRAS, 400, 843
- Goto et al. (2012) Goto T., Utsumi Y., Walsh J.R., Hattori T., Miyazaki S., Yamauchi C., 2012, MNRAS, tmp L397
- Haiman & Rees (2001) Haiman Z. & Rees M.J., 2001, ApJ, 556, 87
- Hennawi & Prochaska (2012) Hennawi J.F. & Prochaska J.X., 2012, in prep.
- Kennicutt (1998) Kennicutt R.C., 1998, ARA&A, 36, 189
- Kotilainen et al. (2009) Kotilainen J.K., Falomo R., Decarli R., Treves A., Uslenghi M., Scarpa R., 2009, ApJ, 703, 1663
- Leipski et al. (2010) Leipski C., Meisenheimer K., Klaas U., Walter F., Nielbock M., Krause O., Dannernauer H., Bertoldi F., et al., 2010, A&A, 518, L34
- Maiolino et al. (2005) Maiolino R., Cox P., Caselli P., Beelen A., Bertoldi F., Carilli C.L., Kaufman M.J., Menten K.M., et al., 2005, A&A, 440, L51
- Ouchi et al. (2010) Ouchi M., Shimasaku K., Furusawa H., Saito T., Yoshida M., Akiyama M., Ono Y., Yamada T., et al., 2010, ApJ, 723, 869
- Peng et al. (2002) Peng C.Y., Ho L.C., Impey C.D., Rix H.-W., 2002, AJ, 124, 266
- Peng et al. (2010) Peng C.Y., Ho L.C., Impey C.D., Rix H.-W., 2010, AJ, 139, 2097
- Pentericci et al. (2002) Pentericci L., Fan X., Rix H.-W., Strauss M.A., Narayanan V.K., Richards G.T., Schneider D.P., Krolik J., et al., 2002, AJ, 123, 2151
- Priddey et al. (2003) Priddey R.S., Isaak K.G., McMahon R.G., Robson E.I., Pearson C.P., 2003, MNRAS, 344, L74
- Reuland et al. (2003) Reuland M., van Breugel W., Röttgering H., de Vries W., Stanford S.A., Dey A., Lacy M., Bland-Hawthorn J., et al., 2003, ApJ, 592, 755
- Riechers et al. (2009) Riechers D.A., Walter F., Bertoldi F., Carilli C.L., Aravena M., Neri R., Cox P., Weiß A., Menten K.M., 2009, ApJ, 703, 1338
- Smith et al. (2009) Smith D.J.B., Jarvis M.J., Simpson C., Martínez-Sansigre A., 2009, MNRAS, 393, 309
- Volonteri & Rees (2006) Volonteri M., Rees M.J., 2006, ApJ, 650, 669
- Walter et al. (2003) Walter F., Bertoldi F., Carilli C., Cox P., Lo K.Y., Neri R., Fan X., Omont A., et al., 2003, Nature, 424, 406
- Walter et al. (2004) Walter F., Carilli C., Bertoldi F., Menten K., Cox P., Lo K.Y., Fan X., Strauss M., 2004, ApJ Letters, 615, 17
- Walter et al. (2009) Walter F., Riechers D., Cox P., Neri R., Carilli C., Bertoldi F., Weiss A., Maiolino R., 2009, Nature, 457, 699
- Wang et al. (2007) Wang R., Carilli C.L., Beelen A., Bertoldi F., Fan X., Walter F., Menten K.M., Omont A., Cox P., Strauss M.A., Jiang L., 2007, AJ, 134, 617
- Wang et al. (2008a) Wang R., Wagg J., Carilli C.L., Benford D.J., Dowell C.D., Bertoldi F., Walter F., Menten K.M., et al., 2008, AJ, 135, 1201
- Wang et al. (2008b) Wang R., Carilli C.L., Wagg J., Bertoldi F., Walter F., Menten K.M., et al., 2008, ApJ, 687, 848
- Wang et al. (2011) Wang R., Wagg J., Carilli C.L., Neri R., Walter F., Omont A., Riechers D.A., Bertoldi F., et al., 2011, AJ, 142, 101
- Weidinger et al. (2005) Weidinger M., Møller P., Fynbo J.P.U., Thomsen B., 2005, A&A, 436, 825
- Willott et al. (2011) Willott C.J., Chet S., Bergeron J., Hutchings J.B., 2011, AJ, 142, 186