A deep ATCA 20cm radio survey of the AKARI Deep Field South near the South Ecliptic Pole
Abstract
The results of a deep radio survey at 20 cm wavelength are reported for a region containing the AKARI Deep Field South (ADF-S) near the South Ecliptic Pole (SEP), using the Australia Telescope Compact Array telescope, ATCA. The survey (hereafter referred to as the ATCA-ADFS survey) has 1 detection limits ranging from 18.7–50 Jy beam-1 over an area of 1.1 degree2, and 2.5 degree2 to lower sensitivity. The observations, data reduction and source count analysis are presented, along with a description of the overall scientific objectives, and a catalogue containing 530 radio sources detected with a resolution of 6.2′′ 4.9′′. The derived differential source counts show a pronounced excess of sources fainter than 1 mJy, consistent with an emerging population of star forming galaxies. Cross-correlating the radio with AKARI sources and archival data we find 95 cross matches, with most galaxies having optical R-magnitudes in the range 18-24 magnitudes, similar to that found in other optical deep field identifications, and 52 components lying within 1′′ of a radio position in at least one further catalogue (either IR or optical). We have reported redshifts for a sub-sample of our catalogue finding that they vary between galaxies in the local universe to those having redshifts of up to 0.825. Associating the radio sources with the Spitzer catalogue at 24 m, we find 173 matches within one Spitzer pixel, of which a small sample of the identifications are clearly radio loud compared to the bulk of the galaxies. The radio luminosity plot and a colour-colour analysis suggest that the majority of the radio sources are in fact luminous star forming galaxies, rather than radio-loud AGN. There are additionally five cross matches between ASTE or BLAST submillimetre galaxies and radio sources from this survey, two of which are also detected at 90 m, and 41 cross-matches with submillimetre sources detected in the HerMES survey Public Data release.
radio continuum: galaxies; surveys
1 Introduction
A fundamental challenge in contemporary astrophysics is to understand how the galaxies have evolved to their current form. To address this issue, wide area surveys are required to accumulate large statistical samples of galaxies. To study this question, the Japanese AKARI infrared satellite (Murakami et al. 2007) carried out two deep infrared legacy surveys close to the North and South Ecliptic Poles (Matsuhara et al. 2006, Matsuura et al. 2011), which are notable because their sight-lines to the distant Universe have the advantages of low extinction and correspondingly small Hydrogen column densities. To support the two AKARI Deep Fields, sensitive radio surveys have been made of both ecliptic pole regions to study and compare the global properties of the extragalactic source populations (White et al. 2009, White et al. 2010a [hereafter ’Paper 1’]). In the present paper the results are reported of a sensitive radio survey at 1.4 GHz using the Australia Telescope Compact Array (ATCA) of a region that includes both the ADF-S field (Matsuhara et al. 2006, Wada et al. 2008, Shirahata et al. 2009, White et al. 2009, Matsuura et al. 2009, 2011), as well as a more extended region around it. The ADF-S is the focus of a major multi-wavelength observing campaign conducted across the entire spectral region. The combination of these far-infrared data and the depth of the radio observations will allow unique studies of a wide range of topics including the redshift evolution of the luminosity function of radio sources, the clustering environment of radio galaxies, the nature of obscured radio-loud Active Galactic Nuclei (AGN), and the radio/far-infrared correlation for distant galaxies.
2 Multi-wavelength observations
The AKARI ADF-S field is a region located close to the South Ecliptic Pole (Matsuura et al. 2009, 2011) with a very low cirrus level 0.5 MJy sr-1 (Schlegel et al. 1998, Bracco et al. 2011), and correspondingly low Hydrogen column density 51019 cm-2. This field is similar to the well known Lockman Hole and Chandra Deep-Field South regions, and has half of the cirrus emission of the well studied COSMOS field at 24m. The ADF-S field is therefore one of the best ’cosmological windows’ through which to study the distant Universe (Malek et al. 2009, Matsuura et al. 2011, Hajian et al. 2012), and is now of high priority for astronomers to build ancillary data sets that can be compared with the AKARI data, and to prepare lead on to the next set of deep cosmological surveys, such as those that will be provided by (Pilbratt et al. 2010) and SPICA (Eales et al. 2009, Swinyard et al. 2009).
The AKARI ADF-S survey was primarily made in the far-infrared at wavelengths of 65, 90, 140, 160 m over a 12 deg2 area with the AKARI Far-Infrared Surveyor (FIS) instrument (Kawada et al. 2007), with shallower mid-infrared coverage at 9, 18m using the AKARI Infrared Camera (IRC) instrument (Onaka et al. 2007). In addition to the wide survey, deeper mid-infrared pointed observations, using the IRC, covering 0.8 deg2 and reaching 5 sensitivities of 16, 16, 74, 132, 280 and 580 Jy at 3.2, 4.6, 7, 11, 15, 24 m were also carried out. At other wavelengths, the region has recently been mapped by Spitzer’s Multi-band imaging photometer (MIPS) at 24 and 70 m (Scott et al. 2010, Clements et al. 2011); by the Balloon-borne Large Aperture Submillimeter Telescope (BLAST) at 250, 350 and 500 m (Valiante et al. 2010), the latter revealing 200 sub-millimetre galaxies over an 8.5 deg2 field; and in the ground-based submillimetre band by Hatsukade et al. (2011) revealing 198 potential sub-millimetre galaxies in an 0.25 square degree area. The ancillary data sets summarised in Table 1 will be used in calibration of the radio positional reference frame, and for cross-identifications later in this paper. The AKARI sensitivity limits correspond approximately to being able to detect starburst galaxies and AGN with a luminosity of 1012 at = 0.5, or ultraluminous infrared galaxies (ULIRGS) with luminosities 1012-13 at = 1–2 respectively. Note that the ADF-S has also been observed by the Space Observatory (HSO) (Pilbratt et al. 2010) as part of the Herschel Multi-tiered Extragalactic Survey (HerMES) guaranteed time key program (Oliver et al. 2010).
Optical, radio, X-ray and infrared surveys provide essential support to the interpretation of deep extragalactic radio surveys. The ADF-S has been the focus of recent multi-wavelength survey coverage by our team, with optical imaging with the CTIO 4m telescope (MOSIAC-II detector) to an R-band sensitivity of 25 magnitudes, and at near-IR wavelengths to K 18.5 magnitudes with the IRSF/SIRIUS instrument already completed. To support the ADF-S and ATCA surveys, we have separately obtained wide field imaging in the optical and near-IR at ESO (using WFI and SOFI), at the AAT (using WFI and IRIS2), for fields of 0.5 - 1 square degree, and spectroscopic observations using AAOmega on the AAT (Sedgwick et al. 2009, 2011).
| Wavelength | Telescope | Area | Beam size | Depth |
|---|---|---|---|---|
| (1) | (2) | (3) | (4) | (5) |
| FUV, NUV | GALEX | Central 1 degree2 | 6′′ | 25.5-26.5 mag (AB) |
| R | CTIO MOSAIC-II | 7.2 degree2 | 1′′ | R 25 mag |
| U, B, V, I | CTIO / MOSAIC | Central 1 degree2 | 1′′ | U 25, B 26, V 26, I 25 mag |
| 3-24 m (6 bands) | AKARI / IRC | Central 0.8 degree2 | 4.2 - 5.5′′ | 10 Jy @3.5m |
| 300uJy @15 m | ||||
| 24 m 70 m | -MIPS | 11 degree2 | 6′′ -18′′ | 200 Jy @24m |
| 20 mJy @70m | ||||
| 65 m, 90 m, 140 m, 160 m | AKARI / FIS | 12 degree2 | 37′′ – 50′′ | 30mJy (3) @90m |
| 110-500 m | (HerMES GT) | 7 degree2 | 8′′ – 36′′ | 30 mJy (5) |
| 250 m, 350 m, 500 m | BLAST | 9 degree2 | 36′′ – 60′′ | 45mJy (3) all bands |
| 870 m | APEX / LABOCA | Central 20′20′ | 19′′ | 6 mJy (3) |
| 1.1 mm | ASTE / AzTEC | Central 0.25 degree2 | 30′′ | 1.2-2.4 mJy (3) |
| 20 cm | ATCA | Central 1 degree2 | 10′′ | 17 Jy |
| Spectroscopy | AAT AAOmega | Central 3.14 degree2 | - | R21 mag |
| Spectroscopy | IMACS Magellan | Central 0.2 degree2 | - | I22 mag |
3 Radio Observations
3.1 ATCA observations
The radio observations were collected over a 13 day period in July 2007 using the ATCA operated at 1.344 and 1.432 GHz. The total integration time for the 2007 observations was 120 h, spread between 26 overlapping pointing positions to maximise the uv coverage and to mitigate the effects of sidelobes from nearby radio-bright sources. Two of the pointing positions were observed on each night, by taking one five minute integration at each of the two target fields, followed by a two minute integration on the nearby secondary calibrator 0407-658. This cycle was repeated for the different pointing positions, which were observed over 10 hour tracks each night, giving similar uv-coverage for each target field. The amplitude scaling was bootstrapped from the primary calibrator PKS 1934-638, which was observed for 10 min at the start of each observing night, and which was assumed to have a flux density of 15.012 Jy at 1.344 GHz and 14.838 Jy at 1.432 GHz respectively. The 2007 data were augmented with a further deep observation made in December 2008 over 5 nights toward a single pointing position at the ADF-S, which lay just off centre of the larger ATCA-ADFS field reported here. This added a further 50 hours of integration time. The data were processed in exactly the same way as that from the 2007 observing sessions.
3.2 Calibration
In the following sub-sections the calibration and data reduction methodology are presented. Since much of this is in common with our recent North Ecliptic Pole (NEP) radio survey with the Westerbork Synthesis Radio Telescope (WSRT) telescope discussed in Paper 1, we will not repeat the detailed discussion of this earlier paper, but instead just focus on those parts of the calibration methodology that differed from Paper 1.
The data were calibrated using the ATNF data reduction package (Sault et al. 1995) using standard procedures. The raw data come in RPFITS format, and were converted into the native format using ATLOD. ATLOD discards every other frequency channel (since they are not independent from one another, hence no information is lost), and additionally flagged out one channel in the higher frequency sideband which contained a multiple of 128 MHz, and thus was affected by self-interference at the ATCA. Channels at either end of the sidebands where the sensitivity dropped significantly were also not used. The resulting data set contained two sidebands, with 13 and 12 channels respectively, each 8 MHz wide, which resulted in a total bandwidth of 200 MHz. The lower frequency sideband was mostly free of RFI and required little editing apart from flagging of bad data. However, the higher frequency sideband suffered from occasional local RF interference, and the affected data were flagged out using the ATNF automated noise flagger PIEFLAG (Middelberg 2006), which eliminated virtually all of the RFI-affected data which would have been flagged in a visual inspection. A visual inspection of the visibilities after using PIEFLAG, led to the removal of a few other small sections of RFI-affected data. In total, approximately 3 and 15 of the data were flagged out in the lower and higher bands respectively. Phase and amplitude fluctuations throughout the observing run were then corrected using the interleaved secondary calibrator data, and the amplitudes were scaled by bootstrapping to the primary calibrator. The data were then split by pointing position and each field was individually imaged, before mosaicing to form a master image, sensitivity and noise maps.
3.3 Imaging
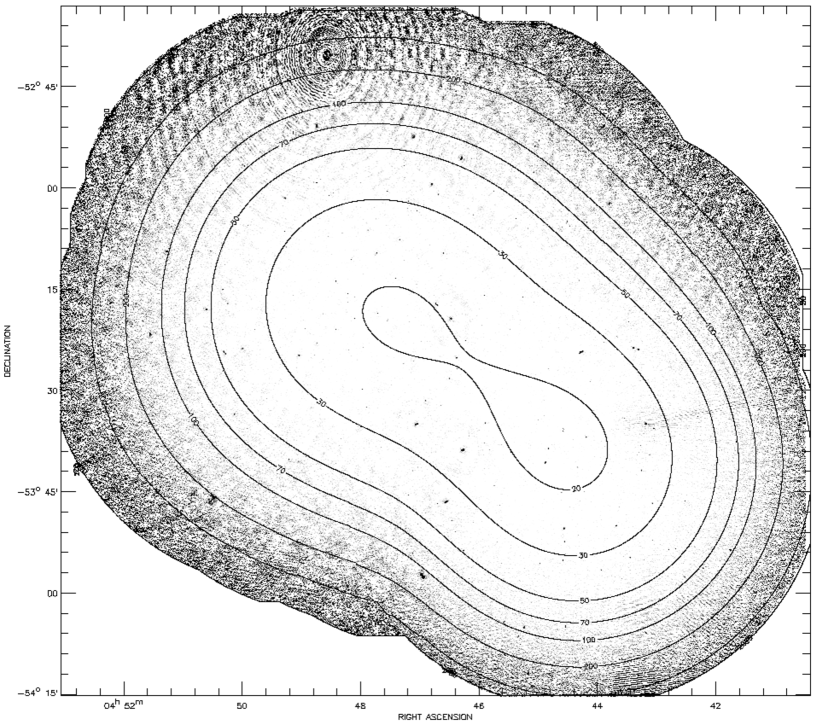
The data for each of the target pointings were imaged separately using uniform weighting and gridded to a pixel size of 2.0′′ to a common reference frame (to minimise geometrical issues in the mosaicing process). The twenty-five 8 MHz wide frequency channels across the ATCA passband were reduced using ’s implementation of multi-frequency clean, MFCLEAN, which accounts for variation in the spectral index of the calibration sources across the observed bandwidth. After a first iteration of MFCLEAN, model components with flux densities 1 mJy beam-1 were used to phase self-calibrate, and to correct residual phase errors. The data were then re-imaged and CLEANED for 5000 iterations, at which point the sidelobes of strong sources were generally found to be comparable with the thermal noise, except for a few cases adjacent to bright sources. The individual pointings were then mosaiced together using the task LINMOS, which additionally divides each image by a model of the primary beam attenuation, and uses a weighted average of positions contained in more than one pointing. As a result, pixels at the mosaic edges have a higher noise level. Regions beyond the point where the primary beam response drops below 50 (this occurs at a radius of 35.06′ from the centre of a pointing) were blanked, which resulted in a total survey area of 1.04 deg.2 (to the limit of the half power beam width at the edges of the master image). The synthesised beam size in the final mosaiced image was 6.2′′ 4.9′′ at a position angle of 0 degrees. The sensitivity varies across the image due to primary beam attenuation and the mosaicing strategy as shown in Figure 1, although the noise level achieved across the map is 35 higher than expected for a thermal noise limited survey, which is due to difficulties in removing the sidelobes of strong sources at the edge of the survey field. This is a well known situation that has previously been seen both for ATCA and WSRT radio surveys, and probably results from both the non-circularity of the telescope beam, and small movements of the primary beam on the sky caused by random single dish pointing errors (i.e. due to wind/thermal loading) that cause the intensity of bright sources near the edge of the primary beam to vary significantly during an integration, making it difficult to efficiently CLEAN those areas.
4 Source Component Catalogue
The mosaiced region achieves wide-field coverage and good sensitivity at the price of having an unavoidably non-uniform noise distribution. Statistical characterisation of the completeness of detection at various flux levels is therefore a complex procedure that requires accounting for the observing time, mosaic overlap, and primary beam attenuation. Our source detection was made using locally determined noise levels derived from the noise map (Figure 2) - an approach that has already been used in other studies to improve the efficacy of their source detection catalogues (e.g. Hopkins et al. 1998, Morganti et al. 2004, Paper 1, and the associated NEP component catalogue presented in White et al. 2010b).

The component catalogue in this paper was built using the task in a similar way to that described in Paper 1. However, briefly uses a statistical technique, the false discovery rate (FDR), which assigns a threshold based on an acceptable rate of false detections (Hopkins et al. 2002). For the ATCA-ADFS data the approach of Hopkins et al. (2002) was followed by adopting an FDR value of 2. The components identified by were visually inspected to remove any obvious mis-identifications (e.g. a few residual sidelobe structures immediately adjacent to the brightest components in the mapped region). Comparison with independent catalogues derived using the task (with a 7 clip), and with one derived using (Bertin & Arnouts 1996) with a locally defined background were almost identical with the catalogue. Hopkins et al. (1998) show that using in this way provides a very robust estimate of the noise level above which there are almost no spurious positive candidates, with the completeness being robustly set by the choice of FDR, and the locally determined background noise level. An understanding of source confusion, spurious components, sensitivity and completeness are important in any survey that is analysed to its limit, but as this becomes difficult to rigorously establish for mosaiced images with non-uniform noise properties of our mosaic and the fact that some but not all of the components are resolved, it was decided for the source counts analysis in Section 5 to stop the calculation at the very conservative level of 200 Jy, which corresponds to in excess of 10 signal to noise in the most sensitive parts of the mapped region.
A sample from the final component catalogue is presented in Table 2, and the entire catalogue is included in the electronic on-line version of this paper.
| No | Component name | RA | DEC | RA | DEC | Speak | Speak | Stotal | Stotal | |||
|---|---|---|---|---|---|---|---|---|---|---|---|---|
| h:m:s.s | d:m:s.s | mJy | mJy | mJy | mJy | ′′ | ′′ | |||||
| beam-1 | beam-1 | |||||||||||
| (1) | (2) | (3) | (4) | (5) | (6) | (7) | (8) | (9) | (10) | (11) | (12) | (13) |
| 1 | ATCA-ADFS J044041-534043 | 4:40:41.5 | -53:40:43.5 | 0.14 | 0.03 | 2.951 | 0.286 | 7.392 | 0.368 | 12.1 | 2.7 | -84.0 |
| 2 | ATCA-ADFS J044116-532554 | 4:41:16.4 | -53:25:54.0 | 0.00 | 0.00 | 1.498 | 0.153 | 4.427 | 0.206 | 8.7 | 6.6 | -48.1 |
| 3 | ATCA-ADFS J044116-531845 | 4:41:16.9 | -53:18:45.8 | 0.07 | 0.31 | 1.568 | 0.260 | 5.310 | 0.317 | 13.5 | 3.5 | -9.3 |
| 4 | ATCA-ADFS J044117-531853 | 4:41:17.9 | -53:18:53.5 | 0.03 | 0.02 | 1.866 | 0.260 | 2.632 | 0.274 | 6.7 | -40.6 | |
| 5 | ATCA-ADFS J044120-533214 | 4:41:20.1 | -53:32:14.9 | 0.03 | 0.02 | 1.603 | 0.116 | 5.893 | 0.137 | 14.1 | 4.9 | -53.8 |
| 6 | ATCA-ADFS J044120-531626 | 4:41:20.7 | -53:16:26.3 | 0.79 | 0.16 | 1.626 | 0.260 | 6.553 | 0.359 | 14.8 | 5.8 | -87.5 |
| 7 | ATCA-ADFS J044121-531637 | 4:41:21.9 | -53:16:37.9 | 0.17 | 0.05 | 1.966 | 0.260 | 7.431 | 0.361 | 12.6 | 6.6 | -88.1 |
| 8 | ATCA-ADFS J044122-534349 | 4:41:22.0 | -53:43:49.1 | 0.01 | 0.01 | 0.686 | 0.096 | 1.051 | 0.100 | |||
| 9 | ATCA-ADFS J044123-534402 | 4:41:23.8 | -53:44:02.8 | 0.07 | 0.01 | 0.932 | 0.096 | 2.413 | 0.121 | 10.3 | 4.4 | -86.0 |
| 10 | ATCA-ADFS J044124-531600 | 4:41:24.1 | -53:16:00.1 | 0.32 | 0.13 | 1.677 | 0.260 | 4.353 | 0.340 | 8.6 | 5.5 | 86.1 |
| 11 | ATCA-ADFS J044141-533707 | 4:41:41.9 | -53:37:07.6 | 0.00 | 0.00 | 6.011 | 0.116 | 11.775 | 0.178 | 7.5 | 3.6 | -80.4 |
| 12 | ATCA-ADFS J044145-535304 | 4:41:45.5 | -53:53:04.4 | 0.00 | 0.00 | 11.728 | 0.187 | 23.327 | 0.210 | 8.7 | 2.0 | 59.2 |
| 13 | ATCA-ADFS J044156-531452 | 4:41:56.5 | -53:14:52.4 | 0.00 | 0.01 | 4.390 | 0.507 | 10.187 | 0.521 | 9.8 | 2.5 | -38.7 |
| 14 | ATCA-ADFS J044203-534302 | 4:42:03.9 | -53:43:02.1 | 0.00 | 0.00 | 0.639 | 0.050 | 0.726 | 0.050 | |||
| 15 | ATCA-ADFS J044205-533253 | 4:42:05.0 | -53:32:53.3 | 0.25 | 0.02 | 0.356 | 0.071 | 1.363 | 0.074 | 20.9 | -79.4 | |
| 16 | ATCA-ADFS J044208-535941 | 4:42:08.4 | -53:59:41.2 | 0.41 | 0.04 | 0.584 | 0.080 | 0.923 | 0.095 | 12.2 | -73.9 | |
| 17 | ATCA-ADFS J044212-531047 | 4:42:12.6 | -53:10:47.9 | 0.01 | 0.03 | 1.184 | 0.190 | 1.974 | 0.197 | 6.6 | -18.2 | |
| 18 | ATCA-ADFS J044212-535551 | 4:42:12.6 | -53:55:51.6 | 0.01 | 0.01 | 1.374 | 0.080 | 2.291 | 0.087 | 7.8 | 47.6 | |
| 19 | ATCA-ADFS J044212-530209 | 4:42:13.0 | -53:02:09.8 | 0.04 | 0.11 | 2.977 | 0.399 | 3.947 | 0.484 | 6.6 | 3.7 | |
| 20 | ATCA-ADFS J044213-530802 | 4:42:13.6 | -53:08:02.5 | 0.06 | 0.11 | 1.166 | 0.190 | 2.322 | 0.216 | 9.4 | -23.0 |
The positional accuracy listed in the Table 2 is relative to the self-calibrated and bootstrapped reference frame described in Section 3. Other effects that bias the positions or sizes of sources in radio surveys have already been presented in Paper 1, to which the reader is referred. An estimate of component dimensions calculated by deconvolving the measured sizes from the synthesised beam is also presented, with Table 2 reporting only those more than double the synthesised beam size.
4.1 Component extraction
In the terminology of this paper, a radio component is described as a region of radio emission represented by a Gaussian shaped object in the map. Close radio doubles are represented by two Gaussians and are deemed to consist of two components, which make up a single source. A selection of radio sources with multiple components is shown in Figure 3.
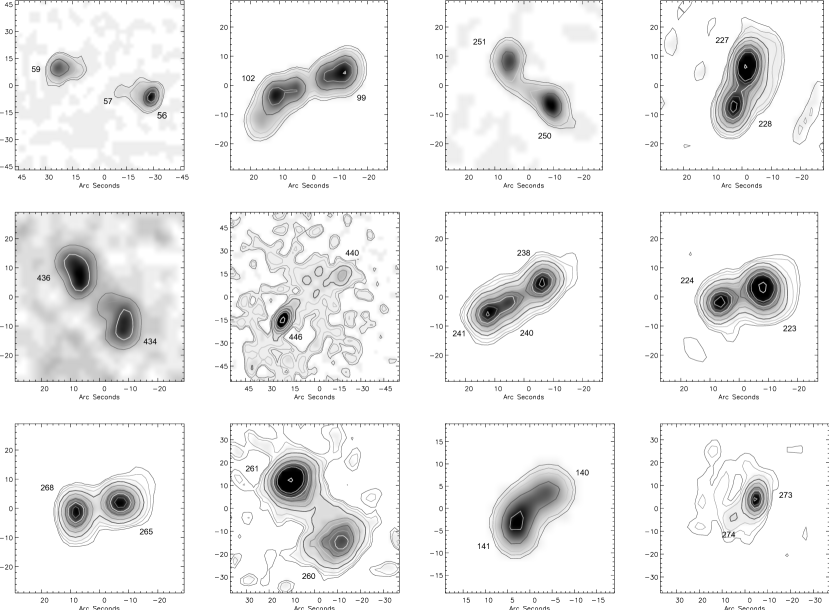
4.2 Complex sources
Radio sources are often made up of multiple components, as seen in Figure 3. The source counts need to be corrected for the multi-component sorces, so that the fluxes of physically related components are summed together, rather than being treated as separate sources. Magliocchetti et al. (1998) have proposed criteria to identify the double and compact source populations, by plotting the separation of the nearest neighbour of a component against the summed flux of the two components, and selecting components where the ratio of their fluxes, and is in the range 0.25 4. In Figure 4 the sum of the fluxes of nearest neighbours are plotted against their separation.

The dashed line marks the boundary satisfying the separation criterion defined by Magliocchetti et al. (1998):
| (1) |
where is in arc seconds. Therefore 53 radio sources in the present survey (i.e. 10 of the 530 catalogued entries) should be considered to be a part of double or multiple sources according to the Magliocchetti et al. (1998) criterion, and this will be taken account of in the source counts discussed later. These components, and their suggested associations are listed in Table 3.
| Components | RA | Dec | Dist | Sc | Sc |
|---|---|---|---|---|---|
| h:m:s.s | d:m:s.s | ′′ | mJy | mJy | |
| (1) | (2) | (3) | (4) | (5) | (6) |
| 47+49 | 4:43:09.2 | -53:39:30.0 | 9 | 1.651 | 0.029 |
| 65+67 | 4:43:38.8 | -53:47:24.1 | 17 | 0.521 | 0.026 |
| 69+70 | 4:43:43.3 | -53:22:18.1 | 11 | 1.050 | 0.034 |
| 99+102 | 4:44:18.9 | -53:24:38.8 | 20 | 18.617 | 0.241 |
| 122+123 | 4:44:35.9 | -53:36:01.4 | 8 | 1.515 | 0.031 |
| 140+141 | 4:44:53.1 | -53:41:00.4 | 8 | 6.949 | 0.058 |
| 166+169 | 4:45:19.3 | -53:12:26.2 | 16 | 1.075 | 0.028 |
| 171+172+175 | 4:45:22.6 | -53:09:09.4 | 20 | 1.450 | 0.021 |
| 179+180 | 4:45:25.8 | -53:06:08.2 | 16 | 0.593 | 0.042 |
| 212+213 | 4:46:03.1 | -53:44:41.6 | 17 | 0.469 | 0.026 |
| 223+224 | 4:46:16.6 | -53:39:21.9 | 15 | 67.264 | 0.431 |
| 227+228 | 4:46:20.4 | -52:56:23.8 | 13 | 65.058 | 0.445 |
| 238+240+241 | 4:46:32.6 | -53:47:00.4 | 18 | 71.759 | 0.172 |
| 250+251 | 4:46:43.7 | -53:17:59.8 | 20 | 6.669 | 0.062 |
| 248+253 | 4:46:46.0 | -53:01:00.5 | 110 | 20.188 | 0.141 |
| 265+268 | 4:47:03.2 | -53:35:39.4 | 15 | 37.415 | 0.181 |
| 284+286 | 4:47:16.2 | -52:59:27.8 | 17 | 0.935 | 0.399 |
| 305+306 | 4:47:32.2 | -53:20:22.8 | 10 | 1.102 | 0.020 |
| 318+320 | 4:47:44.0 | -53:10:37.4 | 20 | 3.771 | 0.052 |
| 336+337 | 4:48:02.5 | -53:26:14.4 | 7 | 0.635 | 0.031 |
| 371+373 | 4:48:40.6 | -52:59:31.5 | 33 | 1.073 | 0.399 |
| 378+379+380 | 4:48:44.9 | -53:00:04.8 | 30 | 3.712 | 0.043 |
| 410+411 | 4:49:28.5 | -53:26:05.0 | 11 | 0.572 | 0.026 |
| 425+428 | 4:49:53.7 | -53:12:02.8 | 28 | 0.854 | 0.036 |
| 434+436 | 4:50:14.7 | -53:25:08.6 | 23 | 6.499 | 0.049 |
4.3 Flux density and positional accuracy
The flux density and positional accuracy are presented in Table 2, and the method for calculating the positional accuracy are described in Hopkins et al. (2002), and the intensity scales are derived and fully described in Equations 1–5 of Hopkins et al. (2003). Since the methods for measuring the positional and intensity scale accuracy form part of the methodology of the technique, the reader is referred to the papers presenting this technique, rather than repeating them here. However, to check the positional accuracy, the ATCA data were cross correlated against the SUMSS survey (Mauch et al. 2003), where 8 of the bright ATCA sources were found to be within 10′′ of a SUMSS source (the SUMSS half-power beam width is 45′′ 57′′ ). After eliminating three components which are resolved and appear as double radio sources in the ATCA data, the average offset between the positions in the two catalogues (ATCA-SUMSS) was (RA,Dec) = (+0.43′′ 2.31′′ , -2.57′′ 2.56′′ ), which are consistent with the absolute and systematic errors reported in the SUMSS Catalogue. The ATCA component catalogue was also cross-correlated with the positions of bright compact optical galaxies from our CTIO MOSAIC-II survey (see Table 1), which was astrometrically referenced against HST guide stars, and sources from the DENIS database. The mean of the offsets to the 166 bright galaxies shown in Figure 5 was RA = -0.16′′ 0.37′′ and Dec = -0.05′′ 0.46′′ , which is also consistent with the SUMSS result.

4.4 Summary of flux density corrections for systematic effects
There are two main systematic effects which have been taken into account to estimate the ATCA flux densities, specifically clean bias and bandwidth smearing effects. Bandwidth smearing is the radio analog of optical chromatic aberration, resulting from the finite width of the receiver channels compared to the observing frequency. It reduces the peak flux density of a source while correspondingly increasing, or blurring, the source size in the radial direction such that the total integrated flux density is conserved, but the peak flux is reduced.
From Condon et al. (1998) the reduction in the peak flux from a compact radio source as a result of bandwidth smearing is given by:
| (2) |
where and refer to the off-axis peak flux and the peak flux at the centre of axis of the primary beam, and are the bandwidth and observing frequency respectively, is the off-axis distance, and is the synthesised beamwidth. Prandoni et al. (2000a) have made a detailed study of this for the ATCA telescope, finding similar behaviour.
Fortunately, the closely spaced mosaicing strategy used for the ATCA SEP observations allows the smearing effect to be measured directly, by monitoring peak and integrated flux densities of four bright compact sources that were present in virtually every one of the observed fields, but at different distances from the centre of the beam. Figure 6 shows the measured smearing factor , which we define as the ratio of the peak flux of a compact source normalised to that which it has when at the centre of a beam, as a function of distance from the beam centre.

This Figure shows that the experimental data points are reasonably well fit by the theoretical relationship of Condon et al. (1998), which is overlaid as a solid line on Figure 6. This correction was taken into account when estimating the peak fluxes listed in Table 2.
It is well known that as well as needing to consider this effect for single pointings, large mosaiced fields and chromatic aberration, it can also act to reduce point source fluxes in a complex way (e.g. Bondi et al. 2008, White et al. 2010). We have empirically examined the effect of bandwidth smearing on our mosaiced data by following the approach adopted by Bondi et al. (2008) to compare the fluxes of bright sources observed close to the centres of individual pointings, with their fluxes determined after mosaicing together to form a merged image. Although the bandwidth smearing can be accounted for using the above equation from Condon et al. (1998), as Bondi et al. (2008) discuss, the contribution of this to measurements of the peak fluxes in radio surveys is more difficult to rigorously quantify for mosaiced data, where the smearing would need to be modelled with a more complicated function that represents the spacing pattern of the individual pointings. Due to the difficulty in rigorously calculating this, we have therefore followed the Bondi et al. (2008) approach to estimate the most probable reduction to the peak flux densities, as this correction will slightly modify estimates of the estimated source sizes.
Therefore, we ran the same procedure that was used to produce the final radio catalogue, on each of the individual pointings. For the strongest unresolved sources ( 1 mJy) the peak and total flux densities measured from the final mosaiced image, were compared with the corresponding peak and total flux densities from the individual pointings, using sources that were no further than 5′ away from an individual pointing (this is consistent with the Bondi et al. 2008 approach for the VLA, which is supported for ATCA from our own results shown in Fig. 7). The total flux densities of each source in the mosaic were in good agreement (the median value was measured to be 1.01 with an rms dispersion of 0.02), as would be expected for complete recovery of the flux. However, for components whose peak fluxes are affected by bandwidth smearing, the peak fluxes could be underestimated in the final mosaic on average by up to 20. The peak fluxes listed in Table 2 have all been corrected for this, according to the centre of the mosaiced image of Right Ascension (J2000) = 4h 46m 46s.5, Declination (J2000) -53∘ 24′ 59′′.0.

The other main effect that can influence fluxes is clean bias. Radio surveys, and in particular those consisting of short snapshot observations, have a tendency to be affected by the clean bias effect where the deconvolution process leads to a systematic underestimation of both the peak and total source fluxes. This is a consequence of the constraints on the cleaning algorithm due to sparse uv coverage (see Becker et al. 1995, White et al. 1997, Condon et al. 1998), and has the effect of redistributing flux from point sources to noise peaks in the image, reducing the flux density of the real sources. As the amount of flux which is taken away from real sources is independent of the source flux densities, the fractional error this causes is most pronounced for weak sources. Prandoni et al. (2000a, b) have shown that it is possible to mitigate clean bias if the CLEANing process is stopped well before the maximum residual flux has reached the theoretical noise level. Consequently the cleaning limit was set at 5 times the theoretical noise, to ensure that the clean bias does not significantly affect the source fluxes in the present survey (Garrett et al. 2000). Gruppioni et al. (1999) adopted a similar strategy in an ATCA survey of the ELAIS N1 field, and found the effect to be insignificant (less than 2.5) for the faintest sources (5 detections) but had no effect on sources brighter than 10 for similar numbers of CLEAN cycles as those performed on the present ATCA data. We therefore conclude that clean bias will have a negligible affect on the present data.
5 Differential Counts
In Figure 8 the differential radio source counts are shown from the ATCA-ADFS field, normalised to a static Euclidean universe (dd (sr-1mJy1.5)). These source counts are broadly consistent with previous results at 1.4 GHz (e.g. the compilation of Windhorst et al. (1993), the PHOENIX Deep Survey (Hopkins et al. 2003), and the shallow survey of Kollgaard et al. (1994)).

The data from Figure 8 are given in Table 4, where the integrated flux bins and mean fluxes for each of the bin centres are listed in columns (1 and 2), the number of sources corrected for clean and resolution bias are shown in column (3), and the number of sources corrected for the area coverage and multi-component sources in Column 4, and in the final column (5) the differential source counts and their associated errors as defined by Kollgaard et al. (1994) are listed.
| flux bin | mean flux | N0 | Nc | |
|---|---|---|---|---|
| mJy | mJy | sr-1 Jy1.5 | ||
| (1) | (2) | (3) | (4) | (5) |
| 0.21–0.23 | 0.22 | 16 | 25.45 | 2.350.47 |
| 0.23–0.25 | 0.24 | 14 | 19.50 | 2.240.51 |
| 0.25–0.28 | 0.265 | 23 | 30.30 | 2.960.54 |
| 0.28–0.315 | 0.298 | 20 | 24.24 | 2.720.55 |
| 0.315–0.413 | 0.364 | 51 | 48.01 | 3.110.45 |
| 0.413–0.566 | 0.490 | 49 | 50.72 | 4.370.61 |
| 0.566–0.813 | 0.690 | 49 | 50.72 | 6.300.88 |
| 0.813–1.21 | 1.011 | 32 | 37.77 | 7.541.23 |
| 1.21–1.70 | 1.455 | 11 | 18.36 | 7.471.75 |
| 1.70–3.151 | 2.425 | 17 | 22.66 | 10.182.14 |
| 3.151–5.416 | 4.283 | 10 | 12.95 | 15.934.43 |
| 5.416–9.742 | 7.579 | 9 | 10.79 | 28.418.65 |
| 9.742–18.33 | 14.036 | 4 | 8.63 | 52.4117.84 |
| 18.33–36.08 | 27.205 | 7 | 7.55 | 113.741.35 |
| 36.08–74.32 | 55.200 | 2 | 3.24 | 129.772.07 |
To model the observed source counts a two component model was used consisting of a classical bright radio loud population and a fainter star-forming population. It is well established that classical bright radio galaxies require strong evolution in order to fit the observed source counts at radio wavelengths (Longair 1966, Rowan-Robinson 1970). The source counts above 10 mJy are dominated by giant radio galaxies and QSOs (powered by accretion onto black holes, commonly joined together in the literature under the generic term AGN). Radio loud sources dominate the source counts down to levels of 1 mJy, however, at the sub-mJy level the normalised source counts flatten as a new population of faint radio sources emerge (Windhorst et al. 1985). The dominance of starburst galaxies in the sub-mJy population is already well established (Gruppioni et al. 2008), where the number of blue galaxies with star-forming spectral signatures is seen to increase strongly. Rowan-Robinson et al. (1980, 1993), Hopkins et al. (1998), and others have concluded that the source counts at these faintest levels require two populations, AGNs and starburst galaxies. This latter population can best be modelled as a dusty star-forming population, under the assumption that it is the higher redshift analogue of the IRAS star-forming population (Rowan-Robinson et al. 1993, Pearson Rowan-Robinson 1996). In this scenario, the radio emission originates from the non-thermal synchrotron emission from relativistic electrons accelerated by supernovae remnants in the host galaxies.
To represent the radio loud population the luminosity function of Dunlop Peacock (1990) was used (parameters in Table C3 in their paper) to model the local space density with an assumption that the population evolves in luminosity with increasing redshift. The luminosity evolution follows a power law with redshift of , broadly consistent with both optically and X-ray selected quasars (Boyle et al. 1987). The spectrum of the radio loud population was obtained from Elvis, Lockman Fassnacht (1994), assuming a steep radio spectrum source of (, =1).
To model the faint sub-mJy population we use the IRAS 60 m luminosity function of Saunders et al. (2000), with the parameters for the star-forming population, defined by warmer 100 m / 60 m IRAS colours, given in Pearson (2001, 2005), and Sedgwick et al. (2012).
To convert the infrared luminosity function to radio wavelengths, we derive below the ratio of the 60 m luminosity to the radio luminosity, from the well established correlation between the far-IR and radio flux (e.g. Helou, Soifer & Rowan-Robinson (1985), Yun, Reddy & Condon (2001), Appleton et al. (2004)).
Helou et al. (1985) defined this relation between the far-infrared flux, and the 1.4 GHz radio emission, in terms of the factor given by,
| (3) |
The far-infrared flux defined by Condon (1991) in terms of the 60 m and 100 m emission can be written as,
| (4) |
where the spectrum between 60 m and 100 m is defined by a spectral index ,
| (5) |
such that,
| (6) |
substituting the above relation into Equation 3, assuming a value of =2.3 (Condon 1991,1992) and a value of =2.7 (Hacking et al. 1987), it is then easy to show that:
| (7) |
To convert the infrared luminosity function to radio wavelengths we adopt the above ratio. We utilise the spectral template of the archetypical starburst galaxy of M82 from the models of Efstathiou, Rowan-Robinson Siebenmorgen (2000) for the spectral energy distribution of the star-forming population. The radio and far-infrared fluxes are correlated due to the presence of hot OB stars in giant molecular clouds that heat the surrounding dust producing the infrared emission. These stars subsequently end their lives as supernovae with the radio emission powered by the synchrotron emission from their remnants. The radio spectrum is characterised by a power law of (, =0.8).
Pure luminosity evolution for the star-forming population is assumed with a best fit power law . This infrared representation of the star-forming population was preferred over using the radio luminosity function directly, since it creates a phenomenological link between the radio emission and the infrared which is responsible for the bulk of the emission in the star-forming population. The observed number counts at fainter fluxes (1mJy) vary widely from survey to survey resulting in a distribution of the best fitting evolution parameterisation. Huynh et al. (2005) used the radio luminosity function of Condon et al. (2002) and derived a best fitting evolution parameterisation , slightly lower than the work presented here. Hopkins (2004) and Hopkins et al. (1998) used radio and infrared luminosity functions respectively obtaining evolution in the sub-mJy population and respectively. Comparing our observations and assumed evolution with the results of our survey in the AKARI deep field at the North Ecliptic Pole (Paper 1) we find that our derived evolution for the AGN and star forming components (, respectively) are consistent with the values arrived at for the survey at the North Ecliptic Pole ( for both components). Both of our surveys at both ecliptic poles (each covering areas of 1 deg2, similar to the VLA-COSMOS survey of Bondi et al. (2008) and larger than the other surveys depicted in Figure 9) result in number counts at the lower end of the emerging picture on excess sub-mJy radio counts, as shown in Figure 9.

6 Cross-matches with deep field catalogues at other wavelengths
To compare the ATCA radio catalogue with the AKARI FIS 90 m ADF-S catalogue (Shirahata et al. ), we have cross-matched AKARI sources and radio components to search for positional coincidences 6′′ based on the AKARI positional uncertainty as defined in Verdugo et al. (2007) and the radio components reported in this paper. In the case of the possible double or complex radio sources (see Figures 4 and 3) we have also searched for candidate identification along a line joining the presumed associated radio components. The AKARI FIS catalogue covers the entire 12 deg2 of the ADF-S and contains 391, 2282, 315 and 216 sources at 65 m, 90 m, 140 m, 160 m above 5 detection sensitivities of 28.47 mJy, 12.81 mJy, 121.03 mJy and 372.68 mJy respectively. From this cross matching we recovered 35 sources in common to both catalogues, twenty-five of which are also reported in the 70 m catalogue (Clements et al. 2011). We list the ATCA-AKARI cross-matched sources in Table 5, along with R-band detections from our CTIO MOSAIC-II survey (or in a few cases that are marked with a dagger symbol from DENIS R-band fluxes), and redshifts from the AAT/AAOmega redshift survey. The data are described in the Figure caption of Table 5. The 41 cross matched sources, all of which lay within a 5′′ error circle, the mean positional agreement was 1.931.25′′, showing very good agreement of the coordinate systems.
| No | S20cm | CTIO | J | H | K | AKARI | AKARI | AKARI | HSO | HSO | HSO | Redshift | ||
|---|---|---|---|---|---|---|---|---|---|---|---|---|---|---|
| mJy | R mag | mag | mag | mag | 24 m | 70 m | 65 m | 90 m | 140 m | 250 m | 350 m | 500 m | ||
| mJy | mJy | mJy | mJy | mJy | mJy | mJy | mJy | |||||||
| 18 | 2.291 | 14.1† | 13.7 | 13.2 | 12.0 | 12.8 | 118.1 | 84.0 | 126.8 | - | - | - | - | 0.044 |
| 55 | 0.317 | 15.9† | 14.9 | 14.0 | 13.9 | 5.4 | 43.3 | 41.6 | 58.2 | - | 91.9 | 39.6 | 8.4 | 0.092 |
| 63 | 0.335 | 17.9† | - | - | - | 0.7 | 35.8 | - | 53.4 | - | 115.9 | 63.7 | 29.5 | - |
| 72 | 0.257 | - | - | - | - | - | - | - | - | - | - | - | - | 0.423 |
| 77 | 0.419 | 20.6 | - | - | - | 1.1 | - | - | 15.5 | - | 84.8 | 52.3 | 28.8 | - |
| 83 | 0.321 | 18.9 | - | - | - | - | - | - | - | - | 64.6 | 42.1 | 23.6 | - |
| 84 | 0.234 | 18.9 | - | - | - | - | - | - | - | - | - | - | - | 0.329 |
| 100 | 0.476 | 22.0 | - | - | - | 0.8 | 44.1 | - | 51.2 | - | 77.9 | 39.4 | 8.6 | - |
| 112 | 0.890 | - | - | - | - | 1.1 | 49.3 | - | 90.1 | - | 69.1 | 38.3 | 23.4 | - |
| 120 | 0.203 | 21.4 | - | - | - | - | - | - | - | - | 58.4 | 40.4 | 32.4 | 0.825 |
| 125 | 0.415 | 16.9 | 16.4 | 15.8 | 14.9 | 5.2 | 91.5 | - | 91.2 | - | 115.9 | 63.6 | 29.5 | 0.164 |
| 132 | 0.257 | 23.6 | - | - | - | 3.0 | - | - | 37.4 | - | 104.5 | 74.7 | 37.6 | - |
| 138 | 0.464 | 18.6 | - | - | - | - | - | - | - | - | - | - | - | 0.472 |
| 143 | 0.381 | 21.5 | - | - | - | - | - | - | 19.1 | - | - | - | - | 0.732 |
| 146 | 0.401 | - | - | - | - | 2.1 | 38.8 | - | 45.6 | - | 85.7 | 42.2 | 11.0 | 0.393 |
| 159 | 0.210 | 20.5 | - | - | - | - | - | - | - | - | - | - | - | 0.577 |
| 164 | 0.258 | 17.6 | 16.6 | 15.8 | 15.2 | 1.5 | - | - | 22.8 | - | - | - | - | - |
| 168 | 0.273 | - | - | - | - | - | - | - | - | - | 58.9 | 37.4 | 8.3 | - |
| 170 | 0.312 | 21.3 | - | - | - | 3.1 | 69.2 | - | 77.8 | - | 86.3 | 48.2 | 20.9 | - |
| 184 | 0.457 | 19.2 | - | - | - | - | - | - | - | - | - | - | - | 0.327 |
| 187 | 8.675 | 17.9† | 16.4 | - | - | 22.0 | 35.4 | - | 19.3 | - | - | - | - | 0.121 |
| 194 | 0.510 | 19.2 | - | - | - | 5.4 | 88.8 | 44.8 | 96.9 | - | 64.1 | 22.2 | 1.8 | 0.290 |
| 195 | 0.492 | 17.9 | 16.5 | - | - | 6.0 | 49.2 | - | 48.1 | - | - | - | - | 0.237 |
| 203 | 0.361 | - | - | - | - | - | - | - | - | - | 64.8 | 47.3 | 26.4 | - |
| 206 | 0.952 | 17.5 | - | - | - | - | - | - | - | - | 75.1 | 45.2 | 18.6 | 0.361 |
| 214 | 0.276 | 14.3 | 13.4 | - | 12.2 | 3.7 | 105.5 | - | 115.9 | - | 145.9 | 58.4 | 13.7 | - |
| 225 | 0.177 | - | - | - | - | - | - | - | - | - | - | - | - | 0.181 |
| 235 | 0.942 | 23.1 | - | - | - | 2.5 | - | - | 24.7 | - | 86.2 | 59.2 | 31.5 | - |
| 252 | 0.350 | 22.3 | - | - | - | 6.7 | 36.7 | - | 36.4 | - | - | - | - | 0.154 |
| 255 | 0.295 | 22.3 | - | - | - | - | - | - | - | - | 62.9 | 39.7 | 22.4 | - |
| 266 | 0.929 | - | - | - | - | - | - | - | - | - | 55.5 | 45.1 | 31.9 | - |
| 277 | 0.798 | 15.3 | 14.5 | - | 13.3 | 2.6 | 80.0 | - | 103.2 | 245.0 | 158.7 | 68.6 | 20.4 | - |
| 283 | 0.300 | - | - | - | - | 0.2 | - | - | 15.3 | - | - | - | - | - |
| 284 | 0.594 | - | - | - | - | 3.8 | 67.2 | - | 65.9 | - | 75.3 | 39.8 | 24.6 | - |
| 290 | 1.182 | - | - | - | - | - | - | - | - | - | 59.2 | 45.3 | 22.1 | - |
| 297 | 0.270 | 17.8 | 16.6 | 15.8 | 15.5 | 3.3 | 45.8 | 49.4 | 63.0 | - | - | - | - | 0.069 |
| 301 | 0.154 | 18.8 | - | - | - | - | - | - | 40.5 | - | - | - | - | 0.223 |
| 302 | 0.273 | 21.2 | - | - | - | - | - | - | 13.6 | - | - | - | - | 0.760 |
| 309 | 0.215 | - | - | - | - | 1.3 | - | - | 25.7 | - | - | - | - | - |
| 330 | 0.263 | - | - | - | - | 7.7 | 53.3 | - | 40.2 | - | - | - | - | 0.181 |
| 333 | 0.184 | - | - | - | - | - | - | - | 27.2 | - | 64.3 | 32.7 | 11.1 | 0.108 |
| 336 | 0.301 | - | - | - | - | - | - | - | - | - | 191.2 | 83.9 | 10.1 | - |
| 337 | 0.334 | 17.1 | 13.6 | 12.8 | 12.3 | - | 112.1 | 91.9 | 161.5 | 439.0 | 186.4 | 82.8 | 52.8 | 0.0463 |
| 341 | 0.166 | - | 14.7 | 13.8 | 13.6 | 5.0 | 69.6 | - | 101.3 | - | 87.8 | 39.0 | 16.2 | - |
| 346 | 0.269 | - | - | - | - | 0.6 | - | - | 29.2 | - | - | - | - | - |
| 350 | 0.282 | - | - | - | - | 1.5 | 37.9 | - | 48.9 | - | - | - | - | - |
| 358 | 0.798 | - | - | - | - | - | - | - | 143.0 | - | 110.7 | 48.9 | 12.6 | 0.1140 |
| 359 | 0.397 | - | - | - | - | - | - | - | - | - | 59.6 | 46.7 | 28.0 | - |
| No | S20cm | CTIO | J | H | K | AKARI | AKARI | AKARI | HSO | HSO | HSO | Redshift | ||
|---|---|---|---|---|---|---|---|---|---|---|---|---|---|---|
| mJy | R mag | mag | mag | mag | 24 m | 70 m | 65 m | 90 m | 140 m | 250 m | 350 m | 500 m | ||
| mJy | mJy | mJy | mJy | mJy | mJy | mJy | mJy | |||||||
| 410 | 0.301 | 16.3† | 16.5 | 16.0 | 15.3 | 2.2 | 45.2 | - | 46.8 | - | 88.7 | 35.4 | 25.1 | 0.413 |
| 419 | 0.409 | 17.7† | - | - | - | 3.6 | 66.7 | 48.9 | 71.7 | - | 72.7 | 34.1 | - | 0.346 |
| 421 | 0.617 | 16.5† | 15.9 | 15.3 | 14.5 | 5.0 | 79.3 | 62.1 | 92.1 | - | 64.5 | 32.3 | 12.3 | 0.145 |
| 426 | 0.370 | - | - | - | - | - | - | - | 30.1 | - | 65.3 | 33.2 | 16.9 | 0.159 |
| 452 | 0.578 | 10.3† | 12.4 | 11.6 | 11.4 | - | - | 20.8 | 355.9 | 618.9 | 101.9 | 78.8 | - | 0.0393 |
| 482 | 3.386 | - | - | - | - | 0.7 | - | - | 39.1 | - | 55.9 | 62.5 | 54.5 | - |
| 487 | 5.249 | 17.2† | 16.8 | 15.9 | 15.1 | 8.1 | 70.5 | - | 81.9 | - | 62.4 | 33.8 | 16.7 | 0.064 |
| 491 | 14.68 | - | - | - | - | 0.7 | - | - | 39.3 | - | 71.4 | 31.2 | - | - |
6.1 Infrared cross matches (, )
Figure 10 shows the comparison between the fluxes of matched ATCA radio – 90 m sources detected in our survey as well as a larger sample of radio and 90 m fluxes taken by cross-correlating with the AKARI All-Sky Survey FIS catalogue (Yamamura et al. 2010, Oyabu et al. 2009, 2010) with the compilation of radio sources given by Dixon (1970). Although this Figure does not apply a -correction to the measured fluxes, it does show us that although many of the ATCA-ADFS sources fall on an extrapolation of sources from Dixon’s list to lower fluxes, several of them may be radio loud compared to the majority (in other words lie significantly to the right of the trend line), and which therefore may have active nuclei. Of these, the two most extreme are the following. Firstly, ATCA component 18 (J04421266-5355520) at redshift 0.044 appears on the NED extragalactic database as a bright edge-on spiral galaxy with DENIS Blue and Red magnitudes of 14.6 and 14.1 respectively, and in the GALEX FUV and NUV bands with 22.39 and 21.03 mag respectively. Secondly, ATCA component 187 is a bright radio source previously detected in the SUMSS survey (SUMSS J044532-540211) with a radio flux of 1.22 mJy at 834 MHz, suggesting that it may have brightened considerably (assuming a normal spectral index), and associated with an object having DENIS Blue and Red magnitudes of 18.4 and 17.7 mag respectively and a magnitude of 21.68 in the GALEX NUV band.

The radio identifications in Table 2 were cross-correlated with the 24 m and 70 m catalogues (Scott et al. 2010), finding 173 and 31 matches at 24 m and 70 m respectively, using the single pixel size (2.45′′ and 4.0′′ at 24 m and 70 m respectively) as the search radius. The results of the 24 m cross-matches are shown in Figure 11, and the large scatter of the plots highlights the difficulties of using the 24 m fluxes as indicators of the radio flux.

.
This plot resembles that of Norris et al. (2006) showing a wide dispersion. To check for chance associations, the radio coordinates were incremented by 60′′ in both RA and Dec, and this new list of positions was cross-correlated with the data to simulate what should be blank fields, resulting in 5 matches. Assuming that these are chance associations, the majority of the matched components ( 97) are likely to be real associations. The brightest source shown in Figure 11 is ATCA component 187, which is associated with an R = 17.7 magnitude galaxy, and has a redshift of 0.121 (see Table 5). The ATCA components with detections which have flux densities 10 mJy are 11, 12, 155, 160, 236, 446, 448, 458, 530.
6.2 Radio luminosity
The radio luminosity of the sources listed in Table 5 was calculated, assuming a cosmology of 0 = 70 km s-1 Mpc-1, with matter and cosmological constant density parameters of M = 0.3, = 0.7. The redshifts were measured using AAOmega, the fibre-fed optical spectrograph at the Anglo Australian Observatory as described by Sedgwick et al. (2011), and the resultant plot of the radio luminosity against redshift is shown in Figure 12, where we assume a mean radio spectral index of = -0.7 (where ) and apply the usual form of the -correction () = z-(1+α) at redshift .

From studies of the local 1.4 GHz luminosity function, Sadler et al. (2002) and Mauch Sadler (2007) have shown that the low luminosity population with radio luminosity 1023 W Hz-1 will mostly be luminous star-forming galaxies rather than radio-loud AGN (Eales et al. 2009, Jarvis et al. 2010, Hardcastle et al. 2010). Although most of the cross-matched ATCA/AKARI sources shown in Fig. 10 fall on the trend shown from the wider sample of cross matches between AKARI and Dixon’s catalogue, ATCA components 18 and 187 appear to be radio-loud, although at the lower end of the luminosities reported from the local luminosity function for this class. However, since most of the other cross-matches fit the trend-line, we conclude that the ATCA/AKARI cross identifications primarily trace the star-forming galaxy population.
6.3 Infrared Colours
To further investigate the nature of the ATCA/AKARI population we compare the infrared colours of our components from our ATCA survey with cross matches in both the AKARI 90 m and 24 m & 70 m bands. In Figure 13 we plot the 24 m /90 m – 90 m /70 m colour distribution of our sources. The models were derived from the SEDs smoothed by the filter bands, and are overlaid onto the spectral tracks of an ensemble of star-forming galaxies from the models of Efstathiou et al. (2000) with increasing far-infrared luminosity from L, , , together with the spectral track of an AGN torus from the models of Efstathiou & Rowan-Robinson (1995). From Figure 13 the infrared colours of the ATCA/AKARI population are consistent with those of star-forming galaxies, although there are selection effects (the requirement to have a 90 m cross-match) which may bias this, and which would need to be tested with more sensitive infrared observations.
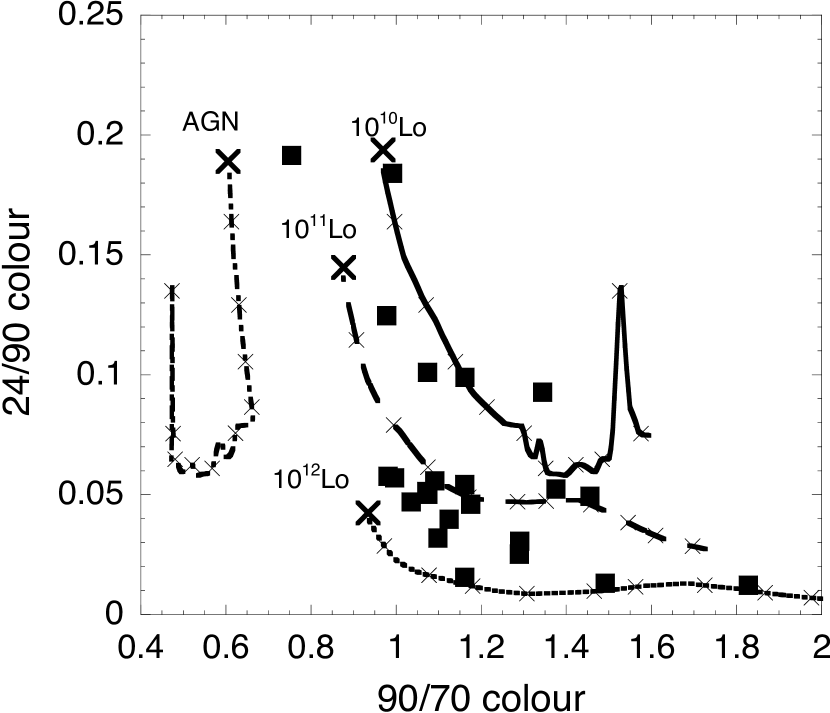
As a further check, the line ratios of [OIII]/H- (lines at wavelengths of 486.1, 495.8, 500.7nm) and [OIII]/[OII] (OII doublet at 372.7 nm) were checked from the AAOmega spectra for the sources with redshifts 0.1, with the result that only one component (ATCA 302) shows ratios that are close to typical AGN values (Sedgwick et al. ). Therefore the radio luminosities (Figure 12), infrared colour-colour plots (Figure 13) and AAOmega spectra all show a consistent picture, suggesting that the ATCA/AKARI cross-identifications predominantly trace a star-bursting population.
6.4 Optical identifications
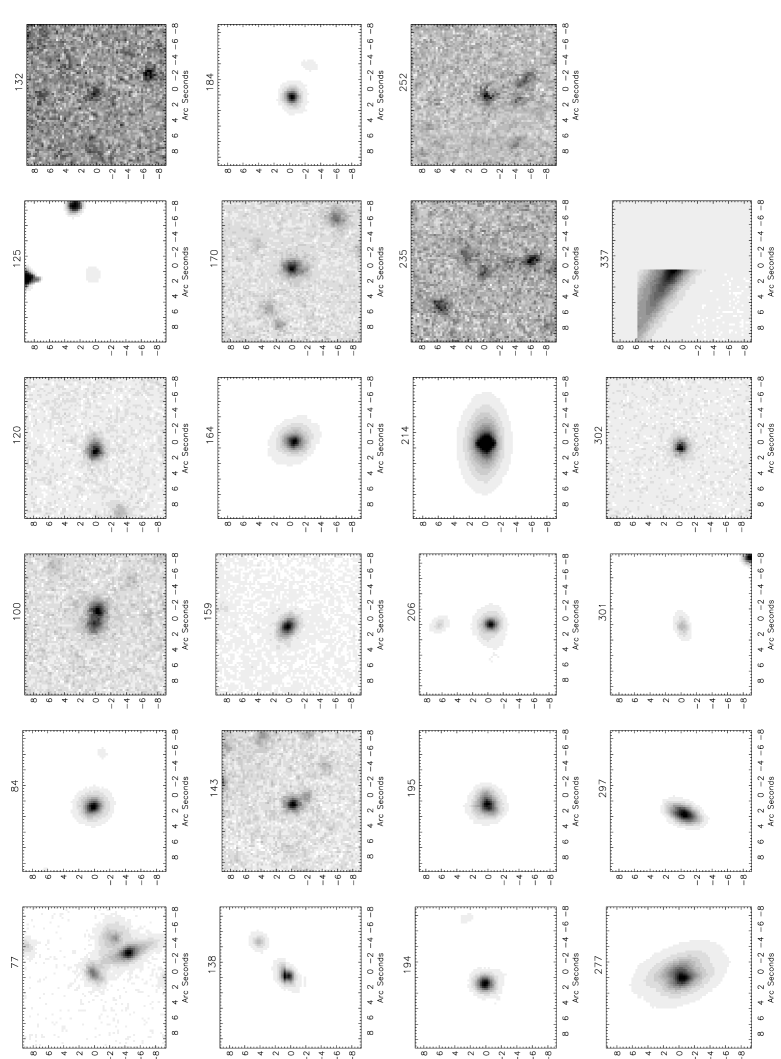
The positions of the components listed in Table 5 were compared with those in the CTIO MOSAIC-II survey (see Table 1), taking a maximum search radius of 1′′ (based on the offsets to bright radio sources described in Section 4.3. The number of galaxies as a function of R-magnitude was calculated from the CTIO MOSAIC-II survey, which covers an area of size 1.84 0.64 degrees centred at RA (J2000) = 4h 43m 32.8s, Declination (J2000) = -5334′51′′ . Based on our choice of a radio error box of 1′′ search radius, the chance possibility that a 23rd magnitude galaxy (the most numerous in the above plot) should randomly coincide with a radio component is 0.6. Making an additional correction for the fact that some of the galaxies are extended or saturated, the chance association of a galaxy with a radio component is still 1.
Postage stamp cutouts for 18′′18′′ regions around the sources with CTIO MOSAIC-II matches in Table 5 are shown in Figure 14, where the radio component is located at the centre of each box.
The full radio catalogue (Table 2) was then cross-correlated against the CTIO MOSAIC-II survey, resulting in 95 matches within a search radius of 1′′ . To test the false identification rate, arbitrary 60′′ offsets were again added to both the RA and Dec coordinates of the radio components, and the cross-match was repeated, resulting in only two galaxies as probably false identifications, which is roughly consistent with out estimate of the likely false detection rate discussed previously. We can therefore be confident to a high degree of the efficacy of our cross identifications. These are shown, along with the (probably false) detections arbitrarily shifting the radio pointing positions, in Figure 15.
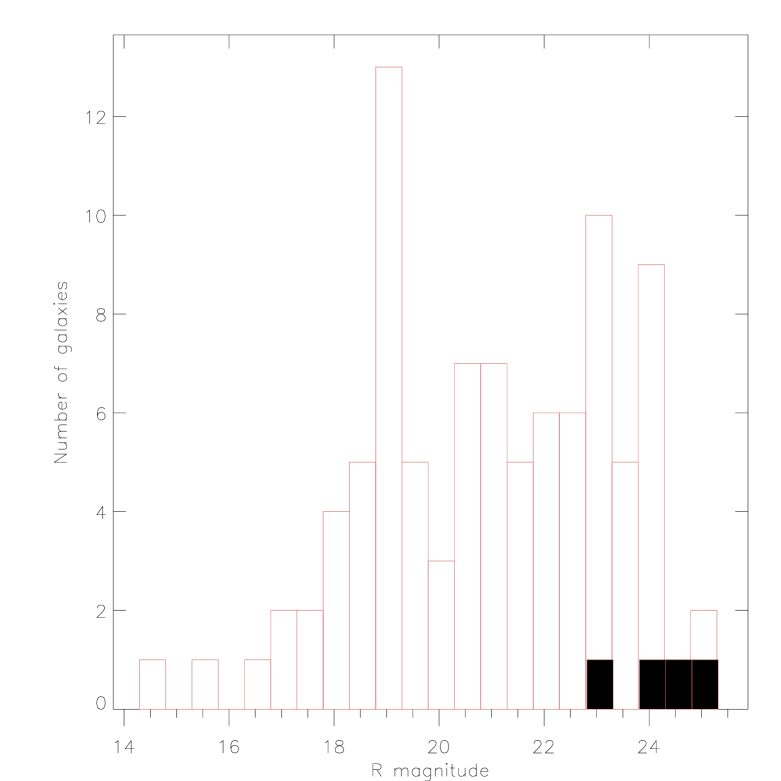
The distribution of associated galaxies with magnitude is similar to that found in the CDFS field by Simpson et al. (2006) and Mainieri et al. (2008), with the majority of the number of detections rising from an R-magnitude 17.
6.5 Sub-millimetre cross matches
The ATCA radio catalogue was searched for matches with the ASTE/AzTEC 1.1 mm deep survey (Hatsukade et al. 2011) which contains the locations of 198 potential sub-millimetre galaxies over a 0.25 degree2 area. We find one credible match that is consistent with the positional errors, lying 5.5′′ from ATCA component 120 with AzTEC J044435.35-534346.6. This has a de-boosted 1.1 mm flux of 2.80.5 mJy; a 20 cm radio flux 0.203 mJy; an R-magnitude of 21.4 from our CTIO imaging survey; and is at the highest redshift of 0.825 amongst the ATCA/AKARI detections detected in the AAT AAOmega redshift survey (Sedgwick et al. 2011).
We have also cross-correlated the ATCA catalogue with the BLAST South Ecliptic Pole catalogue (Valiante et al. 2010) finding five cross matched associations within 10′′ of a radio position (i.e. searching to one third of the BLAST beam width). These sources, and their 250 m fluxes are ATCA component numbers 112, 125, 168, 316 and 409 with 250 m fluxes of 205 mJy, 119 mJy, 177 mJy, 467 mJy and 130 mJy respectively. The first two of these are also listed in Table 5 as having AKARI cross-matches. We have also cross-correlated the ATCA radio sources with the -HerMES Public Data release catalogue, finding 41 cross-matches, the majority confirming our AKARI detections.
7 Conclusions
-
1.
A deep radio survey has been made of a 1.1 degree2 area around the ATCA-ADF-S field using the ATCA telescope at 20 cm wavelength, and 2.5 degree2 to lower sensitivity. The best sensitivity of the survey was 21 Jy beam-1, achieved with a synthesised beam of 6.2′′ 4.9′′. The analysis methodology was carefully chosen to mitigate the various effects that can affect the efficacy of radio synthesis array observations, resulting in a final catalogue of 530 radio components, with the faintest integrated fluxes at about the 100 Jy level. The present catalogue of radio components will form the basis of a further paper reporting cross correlation against extant AKARI and deep optical imaging. Our derived sub-mJy number counts are consistent with, but lie at the lower end of the emerging picture for the excess in the radio counts below 1 mJy. Fitting an evolving galaxy model to our derived counts, we find a consistent picture of radio-loud dominated sources at bright fluxes and an emerging population of star-forming galaxies at radio flux levels 1 mJy.
-
2.
Cross-correlating these with far-infrared sources from AKARI, archival optical photometry, and BLAST data, we find 51 components lying within 1′′ of a radio position in at least one further catalogue. From optical identifications of a small segment of the radio image, we find 95 cross matches, with most galaxies having R-magnitudes in the range 18-24 magnitudes, similar to that found in other optical deep field identifications. The redshifts of these vary between the local universe and redshifts of up to 0.825. Associating with the catalogue, we find 173 matches at 24 m, within one pixel, of which a small sample are clearly radio loud compared to the bulk of the galaxies.
-
3.
The radio luminosity plot suggests that the majority of the radio sources with 90 m counterparts are luminous star forming galaxies. This conclusion is supported by a comparison of the infrared colours of our matched sources which are well described by the colours expected from star-forming galaxies.
-
4.
There is one cross match with an ASTE source, and five cross matches with BLAST submillimetre galaxies from the radio sources detected in the present this survey, two of which are also detected also detected at by AKARI at 90 m, and 41 detections with , of which 12 had not previously been identified by AKARI.
8 Acknowledgements
This work is based on observations with AKARI, a project with the participation of ESA. We also express our thanks to The Australia Telescope Compact Array for the substantial allocation of observing time; to the staff of the Narrabri Observatory for technical support; and the UK Science and Technology Facilities Council, for support. The UK-Japan AKARI Consortium has also received funding awards from the Sasakawa Foundation, The British Council, and the DAIWA Foundation, which facilitated travel and exchange activities, for which we are very grateful. This work was supported by KAKENHI (19540250 and 21111004).
References
- Appleton et al. (2004) Appleton, P. N., Fadda, D. T., Marleau, F. R. et al. 2004, ApJS, 154, 147
- Bertin & Arnouts (1996) Bertin E. Arnouts S. 1996, AAS, 117, 393
- Bondi et al. (2003) Bondi, M., Ciliegi, P., Zamorani, G. et al. 2003, AAS, 403, 857
- Boyle (1987) Boyle B.J., Fong R., Shanks T. et al. 1987, MNRAS, 227, 717
- Bracco (1987) Bracco, A.; Cooray, A.; Veneziani, M.; Amblard, A. et al. 2011, MNRAS, 412, 1151
- Clements (2011) Clements, D., Bendo, G., Pearson, C. et al. 2011, MNRAS, 411, 373
- Condon (1991) Condon, J. J. 1991, in ’The interpretation of modern synthesis observations of spiral galaxies; Proceedings of the Workshop, Albuquerque’, ASPC, 115, 1693
- Condon (1992) Condon, J. J. 1992, ARAA, 30, 575.
- Condon et al. (1998) Condon, J. J., Cotton, W. D., Greisen, E. W., Yin, Q.F et al. . 1998, AJ, 115, 1693
- Condon et al. (2002) Condon, J.J., Cotton, W.D., Broderick, J.J. 2002, AJ, 124, 675
- Dixon et al. (1970) Dixon, R.S. 1970, ApJS., Astrophys. J., 20, 1 (using on-line version 43 from the HEASARC archive)
- Dunlop & Peacock (1990) Dunlop J.S., Peacock J.A., 1990, MNRAS, 247, 19
- Eales (2009) Eales, S.; Dunne, L.; Clements, D,; Cooray, A. et al. 2009, PASP, 122, 499
- Efstathiou (2000) Efstathiou A., Rowan-Robinson M., Siebenmorgen R., 2000, MNRAS, 313, 734
- Efstathiou & Rowan-Robinson (1995) Efstathiou A., Rowan-Robinson M., 1995, MNRAS, 273, 649
- Elvis (1994) Elvis M., Lockman, F.J., Fassnacht, C. 1994, ApJS, 95, 413
- Fomalont et al. (2006) Fomalont, E. B., Kellermann, K. I., Cowie, L. L. et al. 2006, ApJS, 167, 103.
- Gruppioni et al. (2008) Gruppioni, C., Pozzi, F., Polletta, M. et al. 2008, MNRAS, 684, 136
- Hajian et al. (2012) Hajian, A., Viero, M.P., Addison, G., Aguirre, P. et al. 2012, ApJ., 744, 40.
- Hardcastle (2010) Hardcastle, M.J., Virdee, J.S., Jarvis, M.J., Bonfield, D.J. et al. 1998, MNRAS, 409, 122
- Hatsukade et al. (2011) Hatsukade, B., Kohno, K., Aretxaga, I., Austermann, J. E. et al. 2011, MNRAS, 411, 102
- Helou (1985) Helou G., Soifer T.T., Rowan-Robinson M. 1985, ApJ, 298, 7
- Hopkins (1998) Hopkins A.M., Mobasher B., Cram L. et al. 1998, MNRAS, 296, 839
- Hopkins et al. (2002) Hopkins, A.M., Miller, C.J., Connolly, A.J. et al. 2002, AJ, 123,1086
- Hopkins (2003) Hopkins A.M., Afonso J., Chan B. et al. 2003, AJ, 125, 465
- Hopkins (2004) Hopkins, A. M. 2004, ApJ, 615, 209
- Huynh (2005) Huynh M.T., Jackson C.A., Norris R.P. et al. , 2005, AJ, 130, 1388
- Jarvis (2010) Jarvis, Matt J., Smith, D. J. B., Bonfield, D. G., Hardcastle, M. J. et al. 2010, MNRAS, 409, 92
- Jones (2009) Jones, D. H., Read, M.A., Saunders, W., Colless, M. et al. 2009, MNRAS, 399, 683
- Kawada et al. (2007) Kawada M., et al. 2007, PASJ, 59, 389
- Kollgaard et al. (1994) Kollgaard, R.I., Brinkmann, W., Chester, M.M. et al. 1994, ApJS, 93, 145
- Longair (1966) Longair M.S., 1966, MNRAS, 133, 421
- Magliocchetti et al. (1998) Magliocchetti, M., Maddox, S.J., Lahav, O. et al. 1998. MNRAS, 300, 257
- Mainieri et al. (2008) Mainieri, V., Kellermann, K. I., Fomalont, E. B., Miller, N. 2008, ApJ., 179, 95
- Malek et al. (2009) Malek, K., Pollo, A., Shirahata, M. et al. 2009, 418, 519. AKARI, a Light to Illuminate the Misty Universe ASP Conference Series, Vol. 418, proceedings of a conference held 16-19 February 2009 at the University of Tokyo, Tokyo, Japan. Edited by Takashi Onaka, Glenn J. White, Takao Nakagawa, and Issei Yamamura. San Francisco: Astronomical Society of the Pacific
- Malek et al. (2010) Malek, K., Pollo, A., Takeuchi, T. T., Bienias, P. et al. 2010, AA, 514, A11
- Matsuhara (2006) Matsuhara, H., Wada, T., Matsuura, S. et al. 2006, PASJ, 58, 673
- Matsuura (2009) Matsuura, S. et al. 2009, 418, 347. AKARI, a Light to Illuminate the Misty Universe ASP Conference Series, Vol. 418, proceedings of a conference held 16-19 February 2009 at the University of Tokyo, Tokyo, Japan. Edited by Takashi Onaka, Glenn J. White, Takao Nakagawa, and Issei Yamamura. San Francisco: Astronomical Society of the Pacific
- Matsuura (2011) Matsuura, S., Shirahata, M., Kawada, M. et al. 2011. ApJ., 737, 2
- Mauch (2003) Mauch,T., Murphy, T., Buttery, H.J. et al. 2003. MNRAS, 342, 1117
- MauchSadler (2007) Mauch, T., Sadler, E., 2007, MNRAS, 375, 931
- Middleberg (2006) Middleberg, E. 2006, Pub. Astr. Soc. Australia, 2006, 23, 64
- Morganti et al. (2004) Morganti, R., Garrett, M. A., Chapman, S. et al. 2004. AA, 424, 371.
- Murakami et al. (2007) Murakami, H., Baba, H., Barthel, P. et al. . 2007, PASJ, 59, 389
- Norris et al. (2006) Norris,R.P., Afonso,J., Appleton,P.N., Boyle, B.J. et al. 2006, AJ, 132, 2409
- Oliver (2010) Oliver, S. J., Wang, L., Smith, A. J., Altieri, B., et al. 2010. AA, 518, L21.
- Owen Morrison (2008) Owen, F.R. Morrison, G.E. 2008. AJ, 136, 1889.
- Oyabu (2009) Oyabu, S., Yun, M.S., Murayama, T., Sanders, D.B. et al. 2009, ApJ., 130, 2019
- Oyabu (2010) Oyabu, S., Yamamura, I., Alfageme, C. et al. 2010. Proc. SPIE 7731, 77312P
- Pilbratt et al. (2010) Pilbratt, G. L. et al. 2010, A&A, 518, 1
- Pearson (2001) Pearson C.P., 2001, MNRAS, 325, 1511
- Pearson (2005) Pearson C.P., 2005, MNRAS, 358, 1417
- Pearson & Rowan-Robinson (1996) Pearson C.P. Rowan-Robinson M., 1996, MNRAS, 283, 174
- Prandoni (2000a) Prandoni, I., Gregorini, L., Parma, P. et al. 2000a, AA Suppl, 146, 31
- Prandoni et al. (2000b) Prandoni, I., Gregorini, L., Parma, P. et al. 2000b, AA Suppl, 146, 41
- Rowan-Robinson (1980) Rowan-Robinson, M., Phillips, T. G., White, G.J., 1980, MNRAS, 82, 381
- Rowan-Robinson (1970) Rowan-Robinson M., 1970, MNRAS, 149, 365
- Rowan-Robinson (1980) Rowan-Robinson, M., Phillips, T. G., White, G.,1980, A A, 82, 381
- Rowan-Robinson (1993) Rowan-Robinson M., Benn C.R., Lawrence A. et al. 1993, MNRAS, 263, 192
- Sadler (2002) Sadler,E.M., Carole,p., Jackson,A., Cannon,R.D. et al. 2002, MNRAS 329, 227
- Sault (1995) Sault R.J., Teuben P.J., Wright M.C.H., 1995, , ed. R. Shaw, H.E. Payne, J.J.E. Hayes, ASP Conf. Ser., 77, 433-436
- Saunders (2000) Saunders W., Sutherland, W.J., Maddox, S.J. et al. 2000, MNRAS, 317, 55
- Schlegel (1998) Schlegel,D.P., Finkbeiner, M., Douglas, P. Davis, M. 1998, ApJ., 500, 525
- Scott (2010) Scott, K.S., Stabenau, H.F., Braglia, F.G. Borys, C. et al., 2010, ApJS, 191, 212
- Sedgwick (2009) Sedgwick,C., Serjeant,S., Sirothia,S., Pal, S. et al. 2009, 418, 519. AKARI, a Light to Illuminate the Misty Universe ASP Conference Series, Vol. 418, proceedings of a conference held 16-19 February 2009 at the University of Tokyo, Tokyo, Japan. Edited by Takashi Onaka, Glenn J. White, Takao Nakagawa, and Issei Yamamura. San Francisco: Astronomical Society of the Pacific
- Sedgwick (2011) Sedgwick, C., Serjeant, S., Pearson, C., et al. 2011, MNRAS, 416, 1862
- Sedgwick (2012) Sedgwick, C., Serjeant, S., Pearson, C., et al. 2012, astro-ph 1202.1435
- Shirahara (2009) Shirahata, M., Matsuura, S., Kawada, M. et al. 2009, 418, 301. AKARI, a Light to Illuminate the Misty Universe ASP Conference Series, Vol. 418, proceedings of a conference held 16-19 February 2009 at the University of Tokyo, Tokyo, Japan. Edited by Takashi Onaka, Glenn J. White, Takao Nakagawa, and Issei Yamamura. San Francisco: Astronomical Society of the Pacific
- Simpson (2006) Simpson, C., Martinez-Sansigre, A., Rawlings, S., Ivison, R. et al. 2006, MNRAS, 372, 741
- Swinyard (2009) Swinyard, B.M., Nakagawa, T., Merken, P., Royer, P. et al. 2009, Experimental Astronomy, 23, 193
- Valiante et al. (2010) Valiante, E., Ade, P.A.R., Bock, J.J. et al. 2010, ApJ Suppl, 191, 222
- Verdugo et al. (2017) Verdugo, E., Yamamura, I., Pearson C., et al. 2007, AKARI FIS data user manual, ver. 1.3: (http://www.sciops.esa.int/SA/ASTROF/docs/FIS_IDUM_1.3.pdf)
- Wada et al. (2008) Wada, T., Matsuhara, H., Oyabu, S. et al. 2008, PASJ, 60,517
- White et al. (1997) White, R. L., Becker, R. H., Helfand, D. J. et al. 1997, ApJ, 475, 479
- White (2009) White, G.J., Etxaluze, M., Matsuhara, H. et al. 2009, 418, 313. AKARI, a Light to Illuminate the Misty Universe ASP Conference Series, Vol. 418, proceedings of a conference held 16-19 February 2009 at the University of Tokyo, Tokyo, Japan. Edited by Takashi Onaka, Glenn J. White, Takao Nakagawa, and Issei Yamamura. San Francisco: Astronomical Society of the Pacific
- White et al. (2010a) White, G. J. et al. 2010a, AA, 517, A54 (Paper 1)
- White et al. (2010b) White, G. J. et al. 2010b, CDS source catalogue: J/A+A/517/A54
- Windhorst et al. (1985) Windhorst, R.A., Miley G.K., Oweb, F.N. et al. 1985, ApJ, 289, 494
- Windhorst et al. (1993) Windhorst R.A., Fomalont E.B., Partridge R.B. et al. 1993, ApJ, 405, 498
- Yamamura et al. (2010) Yamamura, I., Makiuti, S., Ikeda, N., Fukuda, Y, Oyabu, S, Koga, T., White, G. J., 2010, VizieR On-line Data Catalog: 2298, 0.
- Yun et al. (2001) Yun, M.S., Reddy, N.A., Condon, J.J. 2001, ApJ, 554, 803
| No | Source name | RA | DEC | RA | DEC | Speak | Speak | Stotal | Stotal | |||
|---|---|---|---|---|---|---|---|---|---|---|---|---|
| h:m:s.s | d:m:s.s | mJy | mJy | mJy | mJy | ′′ | ′′ | |||||
| beam-1 | beam-1 | |||||||||||
| (1) | (2) | (3) | (4) | (5) | (6) | (7) | (8) | (9) | (10) | (11) | (12) | (13) |
| 1 | ATCA-ADFS J044041-534043 | 4:40:41.5 | -53:40:43.5 | 0.14 | 0.03 | 2.951 | 0.286 | 7.392 | 0.368 | 12.1 | 2.7 | -84.0 |
| 2 | ATCA-ADFS J044116-532554 | 4:41:16.4 | -53:25:54.0 | 0.00 | 0.00 | 1.498 | 0.153 | 4.427 | 0.206 | 8.7 | 6.6 | -48.1 |
| 3 | ATCA-ADFS J044116-531845 | 4:41:16.9 | -53:18:45.8 | 0.07 | 0.31 | 1.568 | 0.260 | 5.310 | 0.317 | 13.5 | 3.5 | -9.3 |
| 4 | ATCA-ADFS J044117-531853 | 4:41:17.9 | -53:18:53.5 | 0.03 | 0.02 | 1.866 | 0.260 | 2.632 | 0.274 | 6.7 | -40.6 | |
| 5 | ATCA-ADFS J044120-533214 | 4:41:20.1 | -53:32:14.9 | 0.03 | 0.02 | 1.603 | 0.116 | 5.893 | 0.137 | 14.1 | 4.9 | -53.8 |
| 6 | ATCA-ADFS J044120-531626 | 4:41:20.7 | -53:16:26.3 | 0.79 | 0.16 | 1.626 | 0.260 | 6.553 | 0.359 | 14.8 | 5.8 | -87.5 |
| 7 | ATCA-ADFS J044121-531637 | 4:41:21.9 | -53:16:37.9 | 0.17 | 0.05 | 1.966 | 0.260 | 7.431 | 0.361 | 12.6 | 6.6 | -88.1 |
| 8 | ATCA-ADFS J044122-534349 | 4:41:22.0 | -53:43:49.1 | 0.01 | 0.01 | 0.686 | 0.096 | 1.051 | 0.100 | |||
| 9 | ATCA-ADFS J044123-534402 | 4:41:23.8 | -53:44:02.8 | 0.07 | 0.01 | 0.932 | 0.096 | 2.413 | 0.121 | 10.3 | 4.4 | -86.0 |
| 10 | ATCA-ADFS J044124-531600 | 4:41:24.1 | -53:16:00.1 | 0.32 | 0.13 | 1.677 | 0.260 | 4.353 | 0.340 | 8.6 | 5.5 | 86.1 |
| 11 | ATCA-ADFS J044141-533707 | 4:41:41.9 | -53:37:07.6 | 0.00 | 0.00 | 6.011 | 0.116 | 11.775 | 0.178 | 7.5 | 3.6 | -80.4 |
| 12 | ATCA-ADFS J044145-535304 | 4:41:45.5 | -53:53:04.4 | 0.00 | 0.00 | 11.728 | 0.187 | 23.327 | 0.210 | 8.7 | 2.0 | 59.2 |
| 13 | ATCA-ADFS J044156-531452 | 4:41:56.5 | -53:14:52.4 | 0.00 | 0.01 | 4.390 | 0.507 | 10.187 | 0.521 | 9.8 | 2.5 | -38.7 |
| 14 | ATCA-ADFS J044203-534302 | 4:42:03.9 | -53:43:02.1 | 0.00 | 0.00 | 0.639 | 0.050 | 0.726 | 0.050 | |||
| 15 | ATCA-ADFS J044205-533253 | 4:42:05.0 | -53:32:53.3 | 0.25 | 0.02 | 0.356 | 0.071 | 1.363 | 0.074 | 20.9 | -79.4 | |
| 16 | ATCA-ADFS J044208-535941 | 4:42:08.4 | -53:59:41.2 | 0.41 | 0.04 | 0.584 | 0.080 | 0.923 | 0.095 | 12.2 | -73.9 | |
| 17 | ATCA-ADFS J044212-531047 | 4:42:12.6 | -53:10:47.9 | 0.01 | 0.03 | 1.184 | 0.190 | 1.974 | 0.197 | 6.6 | -18.2 | |
| 18 | ATCA-ADFS J044212-535551 | 4:42:12.6 | -53:55:51.6 | 0.01 | 0.01 | 1.374 | 0.080 | 2.291 | 0.087 | 7.8 | 47.6 | |
| 19 | ATCA-ADFS J044212-530209 | 4:42:13.0 | -53:02:09.8 | 0.04 | 0.11 | 2.977 | 0.399 | 3.947 | 0.484 | 6.6 | 3.7 | |
| 20 | ATCA-ADFS J044213-530802 | 4:42:13.6 | -53:08:02.5 | 0.06 | 0.11 | 1.166 | 0.190 | 2.322 | 0.216 | 9.4 | -23.0 | |
| 21 | ATCA-ADFS J044214-531632 | 4:42:14.5 | -53:16:32.3 | 0.05 | 0.06 | 0.629 | 0.105 | 1.949 | 0.115 | 11.0 | 5.0 | 36.3 |
| 22 | ATCA-ADFS J044215-530257 | 4:42:16.0 | -53:02:57.8 | 2.04 | 0.12 | 2.132 | 0.399 | 10.925 | 0.505 | 16.0 | 7.7 | -84.6 |
| 23 | ATCA-ADFS J044217-530136 | 4:42:17.5 | -53:01:36.7 | 0.22 | 0.46 | 2.491 | 0.399 | 8.066 | 0.500 | 13.9 | 3.0 | -32.2 |
| 24 | ATCA-ADFS J044221-533338 | 4:42:21.4 | -53:33:38.5 | 0.00 | 0.00 | 2.091 | 0.071 | 3.137 | 0.081 | |||
| 25 | ATCA-ADFS J044221-535247 | 4:42:21.6 | -53:52:47.8 | 0.14 | 0.09 | 0.381 | 0.064 | 0.815 | 0.074 | 8.9 | 2.8 | 55.9 |
| 26 | ATCA-ADFS J044222-533800 | 4:42:22.0 | -53:38:00.6 | 0.01 | 0.01 | 0.405 | 0.062 | 0.490 | 0.063 | |||
| 27 | ATCA-ADFS J044226-530145 | 4:42:26.8 | -53:01:45.8 | 0.00 | 0.01 | 2.224 | 0.399 | 5.916 | 0.494 | 10.8 | 3.3 | -36.8 |
| 28 | ATCA-ADFS J044231-535716 | 4:42:31.2 | -53:57:16.0 | 0.07 | 0.06 | 0.898 | 0.080 | 1.540 | 0.101 | 7.5 | 49.3 | |
| 29 | ATCA-ADFS J044231-533800 | 4:42:31.2 | -53:38:00.8 | 0.00 | 0.00 | 0.276 | 0.053 | 0.433 | 0.054 | 2.8 | -82.2 | |
| 30 | ATCA-ADFS J044232-535228 | 4:42:32.0 | -53:52:28.0 | 0.08 | 0.05 | 0.244 | 0.058 | 0.661 | 0.061 | 7.7 | 6.7 | 69.5 |
| 31 | ATCA-ADFS J044232-534604 | 4:42:32.5 | -53:46:04.9 | 0.01 | 0.01 | 0.807 | 0.053 | 1.278 | 0.057 | 2.2 | 56.2 | |
| 32 | ATCA-ADFS J044241-535307 | 4:42:41.1 | -53:53:07.5 | 0.00 | 0.00 | 0.887 | 0.080 | 1.556 | 0.081 | 8.4 | 41.1 | |
| 33 | ATCA-ADFS J044245-533035 | 4:42:45.7 | -53:30:35.6 | 0.01 | 0.00 | 0.485 | 0.058 | 0.699 | 0.059 | 7.2 | -52.6 | |
| 34 | ATCA-ADFS J044245-532957 | 4:42:45.9 | -53:29:57.8 | 0.07 | 0.03 | 0.280 | 0.056 | 0.497 | 0.058 | 4.1 | -87.7 | |
| 35 | ATCA-ADFS J044247-535316 | 4:42:47.7 | -53:53:16.8 | 0.00 | 0.01 | 0.762 | 0.080 | 1.052 | 0.081 | |||
| 36 | ATCA-ADFS J044250-534242 | 4:42:50.3 | -53:42:42.5 | 0.08 | 0.04 | 0.202 | 0.042 | 0.383 | 0.045 | 7.2 | 3.3 | 64.5 |
| 37 | ATCA-ADFS J044252-533800 | 4:42:52.6 | -53:38:00.9 | 0.01 | 0.01 | 0.253 | 0.048 | 0.315 | 0.049 | |||
| 38 | ATCA-ADFS J044255-540036 | 4:42:55.8 | -54:00:36.9 | 0.01 | 0.02 | 0.990 | 0.123 | 1.817 | 0.124 | 9.2 | 28.0 | |
| 39 | ATCA-ADFS J044259-525327 | 4:42:59.2 | -52:53:27.7 | 0.03 | 0.03 | 3.976 | 0.383 | 4.167 | 0.388 | |||
| 40 | ATCA-ADFS J044303-525330 | 4:43:03.3 | -52:53:30.1 | 0.14 | 0.20 | 3.094 | 0.383 | 3.274 | 0.416 | |||
| 41 | ATCA-ADFS J044304-535158 | 4:43:04.1 | -53:51:59.0 | 0.00 | 0.01 | 1.179 | 0.039 | 1.466 | 0.051 | |||
| 42 | ATCA-ADFS J044304-525446 | 4:43:04.6 | -52:54:46.2 | 0.05 | 0.43 | 2.277 | 0.383 | 4.691 | 0.469 | 12.5 | 1.4 | |
| 43 | ATCA-ADFS J044305-533538 | 4:43:05.3 | -53:35:38.6 | 0.00 | 0.00 | 2.286 | 0.060 | 3.074 | 0.067 | |||
| 44 | ATCA-ADFS J044305-534634 | 4:43:05.3 | -53:46:34.8 | 0.00 | 0.00 | 1.643 | 0.039 | 2.072 | 0.042 | |||
| 45 | ATCA-ADFS J044305-525549 | 4:43:05.3 | -52:55:49.2 | 3.32 | 0.73 | 4.034 | 0.383 | 2.782 | 0.383 | |||
| 46 | ATCA-ADFS J044308-534105 | 4:43:08.7 | -53:41:05.4 | 0.00 | 0.01 | 0.239 | 0.033 | 0.271 | 0.033 | |||
| 47† | ATCA-ADFS J044308-533928 | 4:43:08.8 | -53:39:28.1 | 0.03 | 0.01 | 0.532 | 0.038 | 0.906 | 0.043 | 3.1 | -62.1 | |
| 48 | ATCA-ADFS J044308-540537 | 4:43:08.9 | -54:05:37.1 | 0.01 | 0.02 | 1.099 | 0.123 | 3.357 | 0.128 | 11.9 | 4.0 | 31.8 |
| 49† | ATCA-ADFS J044309-533931 | 4:43:09.7 | -53:39:31.8 | 0.07 | 0.03 | 0.351 | 0.038 | 0.742 | 0.041 | 7.6 | 4.0 | -53.9 |
| 50 | ATCA-ADFS J044313-533458 | 4:43:13.3 | -53:34:58.8 | 0.00 | 0.00 | 63.317 | 0.060 | 79.299 | 0.465 |
| No | Source name | RA | DEC | RA | DEC | Speak | Speak | Stotal | Stotal | |||
|---|---|---|---|---|---|---|---|---|---|---|---|---|
| h:m:s.s | d:m:s.s | mJy | mJy | mJy | mJy | ′′ | ′′ | |||||
| beam-1 | beam-1 | |||||||||||
| (1) | (2) | (3) | (4) | (5) | (6) | (7) | (8) | (9) | (10) | (11) | (12) | (13) |
| 51 | ATCA-ADFS J044316-534148 | 4:43:16.6 | -53:41:48.4 | 0.00 | 0.00 | 2.265 | 0.038 | 3.040 | 0.059 | |||
| 52 | ATCA-ADFS J044317-524701 | 4:43:17.1 | -52:47:01.5 | 0.01 | 0.01 | 8.447 | 1.066 | 8.516 | 1.113 | |||
| 53 | ATCA-ADFS J044317-533807 | 4:43:17.9 | -53:38:07.7 | 0.00 | 0.00 | 0.641 | 0.038 | 0.851 | 0.040 | |||
| 54 | ATCA-ADFS J044319-533910 | 4:43:19.7 | -53:39:10.7 | 0.00 | 0.00 | 0.285 | 0.045 | 0.352 | 0.045 | |||
| 55 | ATCA-ADFS J044321-533932 | 4:43:21.5 | -53:39:32.3 | 0.00 | 0.00 | 0.281 | 0.042 | 0.317 | 0.042 | |||
| 56 | ATCA-ADFS J044321-532404 | 4:43:21.7 | -53:24:04.3 | 0.02 | 0.02 | 2.578 | 0.045 | 5.960 | 0.187 | 7.6 | 4.7 | -23.7 |
| 57 | ATCA-ADFS J044323-532401 | 4:43:23.5 | -53:24:01.5 | 0.25 | 0.04 | 0.263 | 0.045 | 1.325 | 0.050 | 14.0 | 8.6 | -72.3 |
| 58 | ATCA-ADFS J044326-535437 | 4:43:26.5 | -53:54:37.5 | 0.00 | 0.00 | 1.937 | 0.055 | 3.137 | 0.062 | 6.4 | 28.2 | |
| 59 | ATCA-ADFS J044327-532350 | 4:43:27.3 | -53:23:50.2 | 0.04 | 0.02 | 1.663 | 0.045 | 6.763 | 0.134 | 10.7 | 8.6 | -85.0 |
| 60 | ATCA-ADFS J044330-535405 | 4:43:30.3 | -53:54:05.7 | 0.01 | 0.01 | 0.496 | 0.055 | 0.551 | 0.058 | |||
| 61 | ATCA-ADFS J044331-531822 | 4:43:31.2 | -53:18:22.6 | 0.04 | 0.09 | 0.215 | 0.060 | 0.714 | 0.064 | 10.7 | 6.0 | 9.3 |
| 62 | ATCA-ADFS J044332-532000 | 4:43:32.5 | -53:20:00.9 | 0.00 | 0.01 | 0.735 | 0.059 | 0.962 | 0.061 | |||
| 63 | ATCA-ADFS J044334-535743 | 4:43:34.6 | -53:57:44.0 | 0.00 | 0.00 | 0.477 | 0.054 | 0.335 | 0.054 | |||
| 64 | ATCA-ADFS J044334-533414 | 4:43:34.9 | -53:34:14.1 | 0.00 | 0.00 | 0.443 | 0.062 | 0.459 | 0.062 | |||
| 65† | ATCA-ADFS J044338-534715 | 4:43:38.6 | -53:47:15.6 | 0.00 | 0.00 | 0.296 | 0.040 | 0.344 | 0.040 | |||
| 66 | ATCA-ADFS J044338-525935 | 4:43:38.7 | -52:59:35.8 | 0.00 | 0.00 | 1.794 | 0.228 | 2.174 | 0.232 | |||
| 67† | ATCA-ADFS J044338-534732 | 4:43:39.0 | -53:47:32.5 | 0.00 | 0.00 | 0.203 | 0.035 | 0.177 | 0.035 | |||
| 68 | ATCA-ADFS J044340-535000 | 4:43:40.9 | -53:50:00.9 | 0.03 | 0.06 | 1.834 | 0.039 | 4.059 | 0.155 | 9.1 | 2.3 | -29.0 |
| 69† | ATCA-ADFS J044343-532222 | 4:43:43.0 | -53:22:22.7 | 0.01 | 0.03 | 0.295 | 0.047 | 0.511 | 0.050 | 8.1 | -7.0 | |
| 70† | ATCA-ADFS J044343-532213 | 4:43:43.7 | -53:22:13.6 | 0.00 | 0.00 | 0.398 | 0.047 | 0.540 | 0.047 | 6.8 | -5.3 | |
| 71 | ATCA-ADFS J044344-535722 | 4:43:44.7 | -53:57:22.6 | 0.02 | 0.07 | 0.278 | 0.041 | 0.578 | 0.044 | 10.0 | 7.2 | |
| 72 | ATCA-ADFS J044345-533535 | 4:43:45.4 | -53:35:35.3 | 0.01 | 0.01 | 0.201 | 0.030 | 0.257 | 0.031 | |||
| 73 | ATCA-ADFS J044352-524820 | 4:43:52.2 | -52:48:21.0 | 0.00 | 0.00 | 3.735 | 0.401 | 2.878 | 0.402 | |||
| 74 | ATCA-ADFS J044352-525142 | 4:43:53.0 | -52:51:42.5 | 0.02 | 0.02 | 2.607 | 0.401 | 4.701 | 0.416 | 6.8 | 2.6 | -43.8 |
| 75 | ATCA-ADFS J044353-530240 | 4:43:53.6 | -53:02:40.2 | 0.02 | 0.04 | 2.697 | 0.093 | 9.588 | 0.176 | 15.1 | 3.1 | -27.9 |
| 76 | ATCA-ADFS J044354-533829 | 4:43:54.2 | -53:38:29.4 | 0.00 | 0.00 | 0.259 | 0.030 | 0.332 | 0.030 | |||
| 77 | ATCA-ADFS J044354-532112 | 4:43:54.9 | -53:21:12.8 | 0.02 | 0.03 | 0.277 | 0.040 | 0.419 | 0.043 | |||
| 78 | ATCA-ADFS J044355-534527 | 4:43:55.2 | -53:45:27.8 | 0.00 | 0.00 | 0.195 | 0.029 | 0.229 | 0.029 | |||
| 79 | ATCA-ADFS J044355-531626 | 4:43:55.3 | -53:16:26.1 | 0.00 | 0.01 | 0.433 | 0.040 | 0.636 | 0.041 | |||
| 80 | ATCA-ADFS J044355-535634 | 4:43:55.7 | -53:56:34.1 | 0.00 | 0.00 | 1.577 | 0.041 | 2.031 | 0.049 | |||
| 81 | ATCA-ADFS J044356-524739 | 4:43:56.0 | -52:47:39.5 | 0.05 | 0.06 | 2.453 | 0.401 | 4.143 | 0.434 | 6.9 | -24.4 | |
| 82 | ATCA-ADFS J044356-532307 | 4:43:56.6 | -53:23:07.7 | 0.00 | 0.00 | 0.412 | 0.040 | 0.469 | 0.040 | |||
| 83 | ATCA-ADFS J044357-533739 | 4:43:57.8 | -53:37:39.3 | 0.01 | 0.02 | 0.207 | 0.030 | 0.321 | 0.032 | |||
| 84 | ATCA-ADFS J044359-533034 | 4:43:59.7 | -53:30:34.6 | 0.02 | 0.04 | 0.228 | 0.031 | 0.234 | 0.032 | |||
| 85 | ATCA-ADFS J040440-525110 | 4:044:0.5 | -52:51:10.4 | 0.00 | 0.00 | 44.456 | 0.401 | 86.987 | 0.606 | 8.5 | -36.7 | |
| 86 | ATCA-ADFS J044405-533315 | 4:44:05.8 | -53:33:15.7 | 0.00 | 0.00 | 0.392 | 0.030 | 0.396 | 0.030 | |||
| 87 | ATCA-ADFS J044406-533927 | 4:44:06.3 | -53:39:27.1 | 0.00 | 0.00 | 0.350 | 0.030 | 0.394 | 0.030 | |||
| 88 | ATCA-ADFS J044406-533400 | 4:44:06.4 | -53:34:00.1 | 0.00 | 0.01 | 0.255 | 0.029 | 0.144 | 0.029 | |||
| 89 | ATCA-ADFS J044407-534637 | 4:44:07.2 | -53:46:37.8 | 0.01 | 0.02 | 0.170 | 0.027 | 0.208 | 0.027 | |||
| 90 | ATCA-ADFS J044408-530643 | 4:44:08.4 | -53:06:43.2 | 0.01 | 0.01 | 1.327 | 0.093 | 2.691 | 0.103 | 9.2 | -18.4 | |
| 91 | ATCA-ADFS J044408-534044 | 4:44:08.7 | -53:40:44.1 | 0.00 | 0.00 | 0.448 | 0.030 | 0.421 | 0.030 | |||
| 92 | ATCA-ADFS J044409-532858 | 4:44:09.5 | -53:28:58.2 | 0.00 | 0.00 | 0.260 | 0.031 | 0.334 | 0.031 | |||
| 93 | ATCA-ADFS J044410-533325 | 4:44:10.3 | -53:33:25.5 | 0.00 | 0.00 | 0.293 | 0.029 | 0.129 | 0.029 | |||
| 94 | ATCA-ADFS J044412-533708 | 4:44:12.8 | -53:37:08.9 | 0.00 | 0.00 | 2.848 | 0.030 | 3.378 | 0.041 | |||
| 95 | ATCA-ADFS J044413-525347 | 4:44:13.0 | -52:53:47.8 | 6.18 | 2.08 | 1.617 | 0.168 | 1.250 | 0.169 | |||
| 96 | ATCA-ADFS J044413-534507 | 4:44:13.9 | -53:45:07.8 | 0.00 | 0.00 | 0.319 | 0.030 | 0.360 | 0.030 | |||
| 97 | ATCA-ADFS J044415-530531 | 4:44:15.5 | -53:05:31.0 | 0.01 | 0.04 | 0.884 | 0.093 | 1.521 | 0.109 | 8.9 | -20.0 | |
| 98 | ATCA-ADFS J044417-533833 | 4:44:17.3 | -53:38:33.4 | 0.00 | 0.01 | 0.219 | 0.030 | 0.215 | 0.030 | |||
| 99† | ATCA-ADFS J044417-532435 | 4:44:17.8 | -53:24:35.1 | 0.02 | 0.01 | 2.996 | 0.031 | 9.352 | 0.185 | 10.5 | 5.8 | -65.8 |
| 100 | ATCA-ADFS J044418-534632 | 4:44:18.4 | -53:46:32.6 | 0.00 | 0.00 | 0.421 | 0.030 | 0.476 | 0.030 |
| No | Source name | RA | DEC | RA | DEC | Speak | Speak | Stotal | Stotal | |||
|---|---|---|---|---|---|---|---|---|---|---|---|---|
| h:m:s.s | d:m:s.s | mJy | mJy | mJy | mJy | ′′ | ′′ | |||||
| beam-1 | beam-1 | |||||||||||
| (1) | (2) | (3) | (4) | (5) | (6) | (7) | (8) | (9) | (10) | (11) | (12) | (13) |
| 101 | ATCA-ADFS J044419-535132 | 4:44:19.3 | -53:51:32.7 | 0.00 | 0.01 | 0.224 | 0.032 | 0.239 | 0.032 | |||
| 102† | ATCA-ADFS J044419-532442 | 4:44:19.9 | -53:24:42.7 | 0.07 | 0.04 | 2.513 | 0.031 | 9.265 | 0.241 | 12.9 | 5.9 | -55.1 |
| 103 | ATCA-ADFS J044420-534032 | 4:44:20.8 | -53:40:32.8 | 0.01 | 0.01 | 0.178 | 0.030 | 0.197 | 0.030 | |||
| 104 | ATCA-ADFS J044421-534006 | 4:44:21.2 | -53:40:06.6 | 0.09 | 0.05 | 0.129 | 0.030 | 0.312 | 0.032 | 8.8 | 4.8 | -79.0 |
| 105 | ATCA-ADFS J044421-534135 | 4:44:21.4 | -53:41:35.4 | 0.02 | 0.06 | 0.420 | 0.030 | 0.674 | 0.040 | 7.7 | 13.2 | |
| 106 | ATCA-ADFS J044422-531407 | 4:44:22.1 | -53:14:07.1 | 0.00 | 0.01 | 0.553 | 0.056 | 0.789 | 0.057 | |||
| 107 | ATCA-ADFS J044422-534251 | 4:44:22.2 | -53:42:51.6 | 0.05 | 0.06 | 0.144 | 0.030 | 0.148 | 0.032 | |||
| 108 | ATCA-ADFS J044425-533732 | 4:44:25.9 | -53:37:32.2 | 0.00 | 0.00 | 0.193 | 0.034 | 0.235 | 0.034 | |||
| 109 | ATCA-ADFS J044428-534728 | 4:44:28.4 | -53:47:28.5 | 0.00 | 0.00 | 0.208 | 0.031 | 0.248 | 0.031 | |||
| 110 | ATCA-ADFS J044430-540457 | 4:44:30.9 | -54:04:57.5 | 0.00 | 0.00 | 1.971 | 0.080 | 3.529 | 0.090 | 9.3 | -7.0 | |
| 111 | ATCA-ADFS J044431-535420 | 4:44:32.0 | -53:54:20.2 | 0.00 | 0.00 | 0.261 | 0.034 | 0.319 | 0.034 | |||
| 112 | ATCA-ADFS J044432-540544 | 4:44:32.0 | -54:05:44.8 | 0.02 | 0.04 | 0.681 | 0.083 | 0.890 | 0.094 | |||
| 113 | ATCA-ADFS J044432-530604 | 4:44:32.1 | -53:06:04.9 | 0.00 | 0.00 | 0.847 | 0.093 | 1.332 | 0.093 | 6.2 | -19.3 | |
| 114 | ATCA-ADFS J044432-532237 | 4:44:32.5 | -53:22:37.5 | 0.01 | 0.02 | 0.178 | 0.035 | 0.197 | 0.035 | |||
| 115 | ATCA-ADFS J044433-535234 | 4:44:33.0 | -53:52:34.1 | 0.00 | 0.00 | 1.431 | 0.030 | 1.600 | 0.034 | |||
| 116 | ATCA-ADFS J044433-524317 | 4:44:33.7 | -52:43:17.1 | 0.02 | 0.04 | 6.883 | 1.151 | 16.162 | 1.196 | 10.3 | -35.7 | |
| 117 | ATCA-ADFS J044433-535036 | 4:44:33.7 | -53:50:36.8 | 0.00 | 0.00 | 7.727 | 0.030 | 9.242 | 0.095 | |||
| 118 | ATCA-ADFS J044434-535516 | 4:44:34.5 | -53:55:16.2 | 0.00 | 0.00 | 2.096 | 0.044 | 2.565 | 0.049 | |||
| 119 | ATCA-ADFS J044434-534949 | 4:44:34.6 | -53:49:49.5 | 0.01 | 0.01 | 0.160 | 0.030 | 0.181 | 0.030 | |||
| 120 | ATCA-ADFS J044434-534346 | 4:44:34.7 | -53:43:46.3 | 0.01 | 0.01 | 0.213 | 0.033 | 0.203 | 0.033 | |||
| 121 | ATCA-ADFS J044435-530533 | 4:44:35.2 | -53:05:33.5 | 0.00 | 0.00 | 1.169 | 0.093 | 2.333 | 0.098 | 9.9 | -13.1 | |
| 122† | ATCA-ADFS J044435-533604 | 4:44:35.6 | -53:36:04.3 | 0.05 | 0.11 | 0.449 | 0.027 | 0.834 | 0.043 | 8.2 | 10.0 | |
| 123† | ATCA-ADFS J044436-533558 | 4:44:36.2 | -53:35:58.4 | 0.05 | 0.04 | 0.303 | 0.027 | 0.681 | 0.030 | 7.5 | 4.4 | 21.6 |
| 124 | ATCA-ADFS J044436-534522 | 4:44:36.7 | -53:45:22.2 | 0.00 | 0.00 | 1.734 | 0.027 | 1.638 | 0.033 | |||
| 125 | ATCA-ADFS J044436-534632 | 4:44:36.7 | -53:46:32.2 | 0.00 | 0.00 | 0.302 | 0.030 | 0.415 | 0.030 | |||
| 126 | ATCA-ADFS J044437-524346 | 4:44:37.3 | -52:43:47.0 | 0.00 | 0.00 | 12.943 | 1.151 | 34.043 | 1.242 | 11.1 | 2.6 | -29.2 |
| 127 | ATCA-ADFS J044437-533655 | 4:44:37.7 | -53:36:55.3 | 0.00 | 0.00 | 0.244 | 0.033 | 0.230 | 0.033 | |||
| 128 | ATCA-ADFS J044437-533325 | 4:44:37.7 | -53:33:25.9 | 0.00 | 0.00 | 0.343 | 0.027 | 0.365 | 0.027 | |||
| 129 | ATCA-ADFS J044439-540524 | 4:44:39.1 | -54:05:24.3 | 0.00 | 0.01 | 1.356 | 0.083 | 2.549 | 0.093 | 10.2 | -5.7 | |
| 130 | ATCA-ADFS J044439-530617 | 4:44:39.7 | -53:06:17.3 | 0.00 | 0.01 | 0.510 | 0.023 | 0.510 | 0.023 | |||
| 131 | ATCA-ADFS J044441-530441 | 4:44:41.3 | -53:04:41.3 | 0.02 | 0.06 | 0.459 | 0.027 | 0.459 | 0.027 | |||
| 132 | ATCA-ADFS J044441-532112 | 4:44:41.9 | -53:21:12.7 | 0.06 | 0.08 | 0.289 | 0.033 | 0.257 | 0.033 | |||
| 133 | ATCA-ADFS J044443-533859 | 4:44:43.3 | -53:38:59.3 | 0.00 | 0.00 | 0.126 | 0.031 | 0.154 | 0.031 | |||
| 134 | ATCA-ADFS J044445-533858 | 4:44:45.8 | -53:38:58.0 | 3.21 | 0.00 | 0.130 | 0.030 | 0.114 | 0.030 | |||
| 135 | ATCA-ADFS J044446-532244 | 4:44:46.0 | -53:22:44.4 | 0.00 | 0.01 | 0.160 | 0.034 | 0.234 | 0.034 | |||
| 136 | ATCA-ADFS J044446-524619 | 4:44:46.3 | -52:46:19.9 | 0.02 | 0.02 | 1.612 | 0.204 | 2.271 | 0.207 | 6.5 | -30.5 | |
| 137 | ATCA-ADFS J044450-533856 | 4:44:50.4 | -53:38:56.3 | 0.00 | 0.00 | 2.972 | 0.027 | 3.047 | 0.035 | |||
| 138 | ATCA-ADFS J044451-532713 | 4:44:51.4 | -53:27:13.9 | 0.00 | 0.00 | 0.285 | 0.028 | 0.464 | 0.028 | 7.3 | 8.6 | |
| 139 | ATCA-ADFS J044451-535751 | 4:44:51.6 | -53:57:51.3 | 0.01 | 0.01 | 0.329 | 0.049 | 0.383 | 0.050 | |||
| 140† | ATCA-ADFS J044453-534057 | 4:44:53.1 | -53:40:57.6 | 0.01 | 0.00 | 1.467 | 0.027 | 2.338 | 0.033 | 3.3 | -60.8 | |
| 141† | ATCA-ADFS J044453-534103 | 4:44:53.7 | -53:41:03.2 | 0.01 | 0.02 | 2.376 | 0.027 | 4.611 | 0.113 | 8.7 | -20.2 | |
| 142 | ATCA-ADFS J044455-531423 | 4:44:55.2 | -53:14:23.4 | 0.00 | 0.02 | 0.183 | 0.027 | 0.183 | 0.027 | |||
| 143 | ATCA-ADFS J044455-533405 | 4:44:55.4 | -53:34:05.7 | 0.00 | 0.00 | 0.285 | 0.027 | 0.381 | 0.027 | |||
| 144 | ATCA-ADFS J044456-532346 | 4:44:56.1 | -53:23:46.9 | 0.02 | 0.02 | 0.139 | 0.028 | 0.164 | 0.029 | |||
| 145 | ATCA-ADFS J044456-532608 | 4:44:56.3 | -53:26:08.1 | 0.00 | 0.00 | 0.255 | 0.028 | 0.283 | 0.028 | |||
| 146 | ATCA-ADFS J044456-531530 | 4:44:56.8 | -53:15:30.7 | 0.02 | 0.02 | 0.199 | 0.037 | 0.401 | 0.038 | 6.3 | 4.4 | 16.2 |
| 147 | ATCA-ADFS J044457-535549 | 4:44:57.7 | -53:55:49.9 | 0.00 | 0.00 | 0.520 | 0.044 | 0.630 | 0.046 | |||
| 148 | ATCA-ADFS J044459-535457 | 4:44:59.0 | -53:54:57.2 | 0.00 | 0.00 | 0.246 | 0.036 | 0.273 | 0.036 | |||
| 149 | ATCA-ADFS J040450-533449 | 4:045:0.8 | -53:34:49.4 | 0.00 | 0.00 | 1.079 | 0.027 | 1.237 | 0.029 | |||
| 150 | ATCA-ADFS J044503-525332 | 4:45:03.9 | -52:53:32.1 | 0.01 | 0.01 | 1.804 | 0.204 | 3.678 | 0.209 | 8.6 | -20.6 |
| No | Source name | RA | DEC | RA | DEC | Speak | Speak | Stotal | Stotal | |||
|---|---|---|---|---|---|---|---|---|---|---|---|---|
| h:m:s.s | d:m:s.s | mJy | mJy | mJy | mJy | ′′ | ′′ | |||||
| beam-1 | beam-1 | |||||||||||
| (1) | (2) | (3) | (4) | (5) | (6) | (7) | (8) | (9) | (10) | (11) | (12) | (13) |
| 151 | ATCA-ADFS J044504-531756 | 4:45:04.6 | -53:17:56.5 | 1.11 | 0.08 | 0.211 | 0.032 | 0.133 | 0.032 | |||
| 152 | ATCA-ADFS J044504-525431 | 4:45:04.9 | -52:54:31.9 | 0.01 | 0.02 | 0.629 | 0.100 | 1.304 | 0.103 | 7.8 | 2.8 | 0.3 |
| 153 | ATCA-ADFS J044506-531726 | 4:45:06.9 | -53:17:26.8 | 0.00 | 0.01 | 0.191 | 0.032 | 0.265 | 0.032 | 7.5 | -4.6 | |
| 154 | ATCA-ADFS J044507-525423 | 4:45:07.6 | -52:54:23.8 | 0.00 | 0.00 | 6.554 | 0.100 | 10.806 | 0.126 | 6.8 | -24.2 | |
| 155 | ATCA-ADFS J044508-541153 | 4:45:08.1 | -54:11:53.3 | 0.00 | 0.01 | 11.230 | 0.274 | 25.146 | 0.396 | 11.7 | -13.0 | |
| 156 | ATCA-ADFS J044508-533835 | 4:45:08.6 | -53:38:35.7 | 0.00 | 0.02 | 0.205 | 0.027 | 0.205 | 0.027 | |||
| 157 | ATCA-ADFS J044508-525818 | 4:45:08.7 | -52:58:18.6 | 0.01 | 0.01 | 1.106 | 0.100 | 2.262 | 0.105 | 9.2 | -25.3 | |
| 158 | ATCA-ADFS J044508-535021 | 4:45:08.9 | -53:50:21.9 | 0.01 | 0.04 | 0.147 | 0.031 | 0.271 | 0.031 | 9.4 | -10.3 | |
| 159 | ATCA-ADFS J044509-533751 | 4:45:09.7 | -53:37:51.4 | 0.00 | 0.00 | 0.156 | 0.023 | 0.210 | 0.023 | |||
| 160 | ATCA-ADFS J044512-540511 | 4:45:12.6 | -54:05:11.4 | 0.00 | 0.00 | 6.211 | 0.083 | 10.826 | 0.161 | 9.1 | -16.7 | |
| 161 | ATCA-ADFS J044513-530633 | 4:45:13.7 | -53:06:33.9 | 0.00 | 0.00 | 0.600 | 0.063 | 0.825 | 0.063 | |||
| 162 | ATCA-ADFS J044516-540332 | 4:45:16.9 | -54:03:32.4 | 0.05 | 0.13 | 0.342 | 0.080 | 0.727 | 0.085 | 9.2 | -3.8 | |
| 163 | ATCA-ADFS J044518-531643 | 4:45:18.1 | -53:16:43.4 | 0.00 | 0.00 | 0.912 | 0.033 | 1.099 | 0.037 | |||
| 164 | ATCA-ADFS J044518-535119 | 4:45:18.3 | -53:51:19.8 | 0.01 | 0.01 | 0.155 | 0.033 | 0.258 | 0.034 | 7.6 | -31.6 | |
| 165 | ATCA-ADFS J044518-540631 | 4:45:18.5 | -54:06:31.1 | 0.02 | 0.07 | 1.650 | 0.083 | 2.999 | 0.137 | 10.1 | -18.4 | |
| 166† | ATCA-ADFS J044518-531231 | 4:45:18.5 | -53:12:31.0 | 0.00 | 0.00 | 0.492 | 0.042 | 0.705 | 0.042 | 6.3 | -1.4 | |
| 167 | ATCA-ADFS J044518-523853 | 4:45:18.7 | -52:38:53.4 | 0.01 | 0.01 | 4.669 | 0.581 | 7.379 | 0.598 | 8.8 | -34.6 | |
| 168 | ATCA-ADFS J044519-531045 | 4:45:19.5 | -53:10:45.6 | 0.00 | 0.00 | 0.215 | 0.038 | 0.273 | 0.038 | |||
| 169† | ATCA-ADFS J044520-531221 | 4:45:20.0 | -53:12:21.4 | 0.01 | 0.06 | 0.178 | 0.035 | 0.370 | 0.036 | 9.9 | -13.2 | |
| 170 | ATCA-ADFS J044520-532010 | 4:45:20.1 | -53:20:10.3 | 0.01 | 0.02 | 0.262 | 0.033 | 0.312 | 0.033 | |||
| 171† | ATCA-ADFS J044521-530918 | 4:45:21.1 | -53:09:18.6 | 0.01 | 0.01 | 0.155 | 0.041 | 0.246 | 0.041 | 7.0 | -14.6 | |
| 172† | ATCA-ADFS J044522-530853 | 4:45:22.2 | -53:08:53.4 | 0.00 | 0.00 | 0.379 | 0.042 | 0.588 | 0.042 | 6.7 | -18.4 | |
| 173 | ATCA-ADFS J044522-532644 | 4:45:22.8 | -53:26:44.5 | 0.00 | 0.00 | 0.164 | 0.025 | 0.180 | 0.025 | |||
| 174 | ATCA-ADFS J044523-530910 | 4:45:23.1 | -53:09:10.4 | 0.31 | 0.15 | 0.160 | 0.041 | 0.335 | 0.046 | 7.6 | 4.0 | 63.2 |
| 175† | ATCA-ADFS J044523-530430 | 4:45:23.5 | -53:04:30.8 | 0.00 | 0.00 | 0.280 | 0.053 | 0.386 | 0.053 | |||
| 176 | ATCA-ADFS J044523-530914 | 4:45:23.9 | -53:09:14.9 | 0.00 | 0.01 | 0.258 | 0.041 | 0.284 | 0.041 | |||
| 177 | ATCA-ADFS J044524-531844 | 4:45:24.2 | -53:18:44.2 | 0.00 | 0.00 | 0.752 | 0.033 | 0.943 | 0.034 | |||
| 178 | ATCA-ADFS J044524-530609 | 4:45:24.9 | -53:06:09.4 | 0.00 | 0.02 | 0.171 | 0.026 | 0.171 | 0.026 | |||
| 179† | ATCA-ADFS J044525-530509 | 4:45:25.8 | -53:05:10.0 | 0.00 | 0.00 | 0.616 | 0.063 | 0.742 | 0.063 | |||
| 180† | ATCA-ADFS J044526-530607 | 4:45:26.6 | -53:06:07.1 | 0.00 | 0.00 | 0.261 | 0.056 | 0.422 | 0.057 | 6.3 | 35.7 | |
| 181 | ATCA-ADFS J044527-535318 | 4:45:27.3 | -53:53:18.5 | 0.03 | 0.03 | 0.253 | 0.041 | 0.318 | 0.044 | |||
| 182 | ATCA-ADFS J044527-531153 | 4:45:27.6 | -53:11:53.7 | 0.00 | 0.00 | 0.388 | 0.036 | 0.581 | 0.036 | |||
| 183 | ATCA-ADFS J044527-533930 | 4:45:28.0 | -53:39:30.3 | 0.00 | 0.00 | 10.459 | 0.035 | 15.530 | 0.194 | |||
| 184 | ATCA-ADFS J044530-532131 | 4:45:30.4 | -53:21:31.5 | 0.00 | 0.00 | 0.307 | 0.034 | 0.457 | 0.034 | 6.4 | -1.2 | |
| 185 | ATCA-ADFS J044531-524044 | 4:45:31.4 | -52:40:45.0 | 0.10 | 0.21 | 2.332 | 0.392 | 4.700 | 0.468 | 10.1 | -23.5 | |
| 186 | ATCA-ADFS J044532-540422 | 4:45:32.1 | -54:04:22.6 | 0.01 | 0.03 | 0.866 | 0.123 | 1.551 | 0.132 | 8.3 | -20.2 | |
| 187 | ATCA-ADFS J044532-540210 | 4:45:32.6 | -54:02:10.1 | 0.00 | 0.00 | 5.219 | 0.123 | 8.675 | 0.159 | 8.7 | -24.9 | |
| 188 | ATCA-ADFS J044533-540429 | 4:45:33.6 | -54:04:29.3 | 0.01 | 0.02 | 1.946 | 0.123 | 3.921 | 0.149 | 9.5 | -27.3 | |
| 189 | ATCA-ADFS J044534-532414 | 4:45:34.3 | -53:24:14.9 | 0.01 | 0.01 | 0.145 | 0.031 | 0.247 | 0.031 | 6.4 | 2.9 | 11.4 |
| 190 | ATCA-ADFS J044535-533850 | 4:45:35.7 | -53:38:50.3 | 0.00 | 0.00 | 0.176 | 0.033 | 0.362 | 0.033 | 6.5 | 4.6 | 52.4 |
| 191 | ATCA-ADFS J044536-535557 | 4:45:36.6 | -53:55:57.0 | 0.01 | 0.02 | 0.341 | 0.058 | 0.491 | 0.059 | 7.3 | -32.9 | |
| 192 | ATCA-ADFS J044537-534939 | 4:45:37.2 | -53:49:39.5 | 0.00 | 0.00 | 0.418 | 0.038 | 0.552 | 0.038 | |||
| 193 | ATCA-ADFS J044537-533829 | 4:45:37.5 | -53:38:29.8 | 0.00 | 0.00 | 0.219 | 0.033 | 0.296 | 0.033 | |||
| 194 | ATCA-ADFS J044538-534726 | 4:45:38.6 | -53:47:26.8 | 0.00 | 0.00 | 0.380 | 0.038 | 0.510 | 0.038 | |||
| 195 | ATCA-ADFS J044541-535246 | 4:45:41.1 | -53:52:46.1 | 0.01 | 0.02 | 0.364 | 0.038 | 0.492 | 0.039 | |||
| 196 | ATCA-ADFS J044541-531132 | 4:45:41.8 | -53:11:32.8 | 0.00 | 0.01 | 0.231 | 0.027 | 0.304 | 0.027 | |||
| 197 | ATCA-ADFS J044544-534430 | 4:45:44.6 | -53:44:30.7 | 0.00 | 0.00 | 1.167 | 0.035 | 1.428 | 0.036 | |||
| 198 | ATCA-ADFS J044547-530108 | 4:45:47.7 | -53:01:08.1 | 0.00 | 0.00 | 0.667 | 0.077 | 1.158 | 0.077 | 6.5 | 2.0 | -23.5 |
| 199 | ATCA-ADFS J044549-533916 | 4:45:49.8 | -53:39:16.2 | 0.00 | 0.00 | 0.320 | 0.035 | 0.402 | 0.035 | |||
| 200 | ATCA-ADFS J044553-531231 | 4:45:53.7 | -53:12:32.0 | 0.19 | 0.48 | 0.107 | 0.037 | 0.609 | 0.039 | 18.9 | 6.4 | 23.7 |
| No | Source name | RA | DEC | RA | DEC | Speak | Speak | Stotal | Stotal | |||
|---|---|---|---|---|---|---|---|---|---|---|---|---|
| h:m:s.s | d:m:s.s | mJy | mJy | mJy | mJy | ′′ | ′′ | |||||
| beam-1 | beam-1 | |||||||||||
| (1) | (2) | (3) | (4) | (5) | (6) | (7) | (8) | (9) | (10) | (11) | (12) | (13) |
| 200 | ATCA-ADFS J044553-531231 | 4:45:53.7 | -53:12:32.0 | 0.19 | 0.48 | 0.107 | 0.037 | 0.609 | 0.039 | 18.9 | 6.4 | 23.7 |
| 201 | ATCA-ADFS J044554-533522 | 4:45:54.1 | -53:35:22.4 | 0.00 | 0.00 | 2.729 | 0.031 | 3.294 | 0.038 | |||
| 202 | ATCA-ADFS J044554-534203 | 4:45:54.4 | -53:42:03.6 | 0.01 | 0.01 | 0.150 | 0.036 | 0.293 | 0.036 | 7.6 | 2.7 | -45.5 |
| 203 | ATCA-ADFS J044554-533817 | 4:45:54.7 | -53:38:17.9 | 0.00 | 0.00 | 0.359 | 0.031 | 0.361 | 0.031 | |||
| 204 | ATCA-ADFS J044555-535951 | 4:45:55.4 | -53:59:51.2 | 0.00 | 0.00 | 0.813 | 0.058 | 1.091 | 0.059 | |||
| 205 | ATCA-ADFS J044555-534001 | 4:45:55.4 | -53:40:01.7 | 0.00 | 0.03 | 0.201 | 0.031 | 0.201 | 0.031 | |||
| 206 | ATCA-ADFS J044556-531633 | 4:45:56.0 | -53:16:33.8 | 0.00 | 0.00 | 0.773 | 0.034 | 0.952 | 0.035 | |||
| 207 | ATCA-ADFS J044557-531304 | 4:45:57.9 | -53:13:04.6 | 0.02 | 0.05 | 0.145 | 0.037 | 0.395 | 0.038 | 10.0 | 4.1 | -14.3 |
| 208 | ATCA-ADFS J044558-532101 | 4:45:58.5 | -53:21:01.3 | 0.00 | 0.00 | 0.390 | 0.034 | 0.505 | 0.035 | |||
| 209 | ATCA-ADFS J040460-533624 | 4:046:0.4 | -53:36:24.5 | 0.00 | 0.00 | 0.707 | 0.031 | 0.841 | 0.033 | |||
| 210 | ATCA-ADFS J044601-531837 | 4:46:01.1 | -53:18:37.1 | 0.00 | 0.02 | 0.189 | 0.028 | 0.172 | 0.028 | |||
| 211 | ATCA-ADFS J044601-525350 | 4:46:01.3 | -52:53:50.4 | 0.00 | 0.00 | 1.032 | 0.103 | 0.541 | 0.104 | |||
| 212† | ATCA-ADFS J044602-534438 | 4:46:02.3 | -53:44:38.3 | 0.02 | 0.03 | 0.150 | 0.036 | 0.258 | 0.037 | 3.4 | 43.4 | |
| 213† | ATCA-ADFS J044604-534444 | 4:46:04.0 | -53:44:44.9 | 0.01 | 0.01 | 0.152 | 0.036 | 0.211 | 0.036 | |||
| 214 | ATCA-ADFS J044605-534955 | 4:46:05.3 | -53:49:55.9 | 0.00 | 0.00 | 0.546 | 0.043 | 0.276 | 0.043 | |||
| 215 | ATCA-ADFS J044606-525438 | 4:46:06.1 | -52:54:38.9 | 0.00 | 0.00 | 0.976 | 0.077 | 1.373 | 0.078 | |||
| 216 | ATCA-ADFS J044606-535634 | 4:46:06.4 | -53:56:34.7 | 0.00 | 0.01 | 0.354 | 0.062 | 0.506 | 0.063 | 6.7 | -17.4 | |
| 217 | ATCA-ADFS J044607-530442 | 4:46:07.9 | -53:04:42.0 | 0.00 | 0.00 | 0.443 | 0.048 | 0.594 | 0.048 | |||
| 218 | ATCA-ADFS J044608-535811 | 4:46:08.8 | -53:58:11.8 | 0.00 | 0.00 | 0.588 | 0.058 | 0.731 | 0.058 | |||
| 219 | ATCA-ADFS J044610-533716 | 4:46:10.0 | -53:37:16.9 | 0.00 | 0.00 | 0.400 | 0.031 | 0.505 | 0.031 | |||
| 220 | ATCA-ADFS J044614-530741 | 4:46:14.2 | -53:07:42.0 | 0.00 | 0.00 | 0.195 | 0.036 | 0.216 | 0.036 | |||
| 221 | ATCA-ADFS J044614-532319 | 4:46:14.3 | -53:23:19.1 | 0.00 | 0.00 | 0.905 | 0.034 | 0.839 | 0.036 | |||
| 222 | ATCA-ADFS J044614-535407 | 4:46:14.8 | -53:54:07.3 | 0.00 | 0.00 | 2.780 | 0.096 | 5.077 | 0.102 | 7.6 | -40.5 | |
| 223† | ATCA-ADFS J044615-533919 | 4:46:15.8 | -53:39:19.6 | 0.00 | 0.00 | 22.492 | 0.051 | 45.194 | 0.652 | 6.7 | 4.1 | 9.6 |
| 224† | ATCA-ADFS J044617-533924 | 4:46:17.3 | -53:39:24.2 | 0.01 | 0.01 | 11.846 | 0.051 | 22.070 | 0.562 | 4.0 | -49.5 | |
| 225 | ATCA-ADFS J044617-531156 | 4:46:17.5 | -53:11:56.5 | 0.00 | 0.01 | 0.154 | 0.029 | 0.177 | 0.029 | |||
| 226 | ATCA-ADFS J044617-531919 | 4:46:18.0 | -53:19:19.6 | 0.00 | 0.00 | 0.297 | 0.041 | 0.305 | 0.041 | |||
| 227† | ATCA-ADFS J044620-525617 | 4:46:20.0 | -52:56:17.5 | 0.00 | 0.00 | 20.759 | 0.064 | 40.815 | 0.559 | 8.5 | -8.1 | |
| 228† | ATCA-ADFS J044620-525630 | 4:46:20.5 | -52:56:30.1 | 0.01 | 0.04 | 11.333 | 0.064 | 24.243 | 0.693 | 9.1 | -15.6 | |
| 229 | ATCA-ADFS J044621-531244 | 4:46:21.3 | -53:12:44.5 | 0.01 | 0.01 | 0.270 | 0.032 | 0.279 | 0.033 | |||
| 230 | ATCA-ADFS J044621-535001 | 4:46:21.9 | -53:50:01.6 | 0.01 | 0.01 | 0.292 | 0.049 | 0.322 | 0.050 | |||
| 231 | ATCA-ADFS J044622-524104 | 4:46:22.1 | -52:41:04.3 | 8.27 | 1.67 | 2.601 | 0.324 | 3.619 | 0.329 | 13.9 | 0.8 | |
| 232 | ATCA-ADFS J044622-532725 | 4:46:22.7 | -53:27:25.7 | 0.00 | 0.00 | 0.571 | 0.034 | 0.586 | 0.035 | |||
| 233 | ATCA-ADFS J044623-532549 | 4:46:23.2 | -53:25:49.5 | 0.00 | 0.00 | 5.402 | 0.034 | 7.158 | 0.081 | |||
| 234 | ATCA-ADFS J044623-535123 | 4:46:23.4 | -53:51:23.3 | 0.00 | 0.01 | 0.450 | 0.061 | 0.670 | 0.062 | |||
| 235 | ATCA-ADFS J044626-534942 | 4:46:26.6 | -53:49:42.9 | 0.00 | 0.01 | 0.572 | 0.061 | 0.942 | 0.062 | 6.6 | -20.9 | |
| 236 | ATCA-ADFS J044629-532004 | 4:46:29.5 | -53:20:04.2 | 0.00 | 0.00 | 27.077 | 0.042 | 28.928 | 0.241 | |||
| 237 | ATCA-ADFS J044630-532854 | 4:46:30.3 | -53:28:54.0 | 0.00 | 0.00 | 0.908 | 0.034 | 0.958 | 0.035 | |||
| 238† | ATCA-ADFS J044631-534655 | 4:46:31.6 | -53:46:55.4 | 0.00 | 0.00 | 10.910 | 0.061 | 20.590 | 0.249 | 6.7 | 3.4 | -41.9 |
| 239 | ATCA-ADFS J044632-530332 | 4:46:32.5 | -53:03:32.6 | 0.00 | 0.02 | 0.197 | 0.031 | 0.197 | 0.031 | |||
| 240† | ATCA-ADFS J044632-534702 | 4:46:33.0 | -53:47:02.2 | 0.00 | 0.00 | 7.419 | 0.061 | 28.037 | 0.421 | 14.7 | 5.1 | -68.3 |
| 241† | ATCA-ADFS J044633-534704 | 4:46:33.5 | -53:47:05.0 | 0.02 | 0.01 | 10.250 | 0.061 | 23.175 | 0.500 | 8.0 | 4.4 | -55.2 |
| 242 | ATCA-ADFS J044634-531115 | 4:46:34.1 | -53:11:15.7 | 0.00 | 0.00 | 0.306 | 0.033 | 0.366 | 0.033 | |||
| 243 | ATCA-ADFS J044637-531026 | 4:46:37.3 | -53:10:26.7 | 0.00 | 0.00 | 3.340 | 0.033 | 4.117 | 0.042 | |||
| 244 | ATCA-ADFS J044638-533251 | 4:46:38.8 | -53:32:51.0 | 0.00 | 0.00 | 0.349 | 0.040 | 0.450 | 0.040 | |||
| 245 | ATCA-ADFS J044639-525544 | 4:46:39.5 | -52:55:44.8 | 0.00 | 0.00 | 0.557 | 0.064 | 0.702 | 0.064 | |||
| 246 | ATCA-ADFS J044641-540925 | 4:46:41.1 | -54:09:25.9 | 0.01 | 0.02 | 12.401 | 0.564 | 32.397 | 0.690 | 13.7 | -33.2 | |
| 247 | ATCA-ADFS J044641-534716 | 4:46:41.4 | -53:47:16.2 | 0.00 | 0.00 | 0.732 | 0.061 | 1.002 | 0.061 | |||
| 248† | ATCA-ADFS J044642-530146 | 4:46:42.6 | -53:01:46.4 | 0.00 | 0.00 | 4.213 | 0.037 | 5.786 | 0.054 | |||
| 249 | ATCA-ADFS J044642-532614 | 4:46:42.7 | -53:26:14.8 | 0.00 | 0.00 | 0.476 | 0.034 | 0.441 | 0.034 | |||
| 250† | ATCA-ADFS J044642-531806 | 4:46:42.9 | -53:18:06.9 | 0.01 | 0.01 | 2.176 | 0.042 | 3.662 | 0.106 | 7.6 | 2.2 | 33.8 |
| No | Source name | RA | DEC | RA | DEC | Speak | Speak | Stotal | Stotal | |||
|---|---|---|---|---|---|---|---|---|---|---|---|---|
| h:m:s.s | d:m:s.s | mJy | mJy | mJy | mJy | ′′ | ′′ | |||||
| beam-1 | beam-1 | |||||||||||
| (1) | (2) | (3) | (4) | (5) | (6) | (7) | (8) | (9) | (10) | (11) | (12) | (13) |
| 251† | ATCA-ADFS J044644-531752 | 4:46:44.5 | -53:17:53.0 | 0.00 | 0.01 | 1.574 | 0.042 | 3.007 | 0.067 | 8.9 | 0.9 | |
| 252 | ATCA-ADFS J044646-531642 | 4:46:46.3 | -53:16:42.7 | 0.00 | 0.00 | 0.334 | 0.041 | 0.350 | 0.041 | |||
| 253† | ATCA-ADFS J044649-530014 | 4:46:49.4 | -53:00:14.7 | 0.00 | 0.00 | 7.702 | 0.064 | 14.402 | 0.115 | 3.7 | -1.7 | |
| 254 | ATCA-ADFS J044650-540754 | 4:46:50.6 | -54:07:54.5 | 0.03 | 0.04 | 1.724 | 0.244 | 2.488 | 0.273 | |||
| 255 | ATCA-ADFS J044650-530916 | 4:46:50.7 | -53:09:16.6 | 0.01 | 0.01 | 0.206 | 0.033 | 0.295 | 0.033 | |||
| 256 | ATCA-ADFS J044652-531923 | 4:46:52.5 | -53:19:23.7 | 0.00 | 0.00 | 0.611 | 0.042 | 0.573 | 0.043 | |||
| 257 | ATCA-ADFS J044653-534837 | 4:46:53.2 | -53:48:37.5 | 0.02 | 0.02 | 0.562 | 0.061 | 0.940 | 0.063 | 3.3 | -41.7 | |
| 258 | ATCA-ADFS J044653-533211 | 4:46:53.8 | -53:32:11.0 | 0.00 | 0.00 | 1.721 | 0.040 | 1.897 | 0.045 | |||
| 259 | ATCA-ADFS J044654-524023 | 4:46:54.2 | -52:40:23.1 | 0.00 | 0.00 | 4.845 | 0.324 | 2.529 | 0.326 | |||
| 260 | ATCA-ADFS J044655-535805 | 4:46:55.0 | -53:58:05.4 | 0.02 | 0.02 | 6.558 | 0.096 | 46.427 | 0.438 | 14.9 | 12.3 | -48.9 |
| 261 | ATCA-ADFS J044657-535740 | 4:46:57.3 | -53:57:40.3 | 0.00 | 0.00 | 20.375 | 0.096 | 85.243 | 0.622 | 10.5 | 9.1 | -45.5 |
| 262 | ATCA-ADFS J044658-532329 | 4:46:58.7 | -53:23:29.9 | 0.00 | 0.00 | 0.255 | 0.038 | 0.304 | 0.038 | |||
| 263 | ATCA-ADFS J044701-531113 | 4:47:01.5 | -53:11:14.0 | 0.00 | 0.00 | 0.578 | 0.033 | 0.658 | 0.033 | |||
| 264 | ATCA-ADFS J044701-534159 | 4:47:01.6 | -53:41:59.2 | 0.00 | 0.00 | 0.463 | 0.051 | 0.769 | 0.051 | 2.2 | -18.5 | |
| 265† | ATCA-ADFS J044702-533537 | 4:47:02.4 | -53:35:37.7 | 0.00 | 0.00 | 10.258 | 0.040 | 19.883 | 0.139 | 5.5 | -85.8 | |
| 266 | ATCA-ADFS J044703-530411 | 4:47:03.4 | -53:04:11.2 | 0.00 | 0.00 | 0.772 | 0.037 | 0.929 | 0.039 | |||
| 267 | ATCA-ADFS J044703-531503 | 4:47:03.7 | -53:15:03.3 | 0.00 | 0.00 | 0.759 | 0.033 | 0.790 | 0.035 | |||
| 268† | ATCA-ADFS J044704-533541 | 4:47:04.0 | -53:35:41.1 | 0.00 | 0.01 | 9.918 | 0.040 | 17.532 | 0.332 | 6.9 | 2.5 | -3.3 |
| 269 | ATCA-ADFS J044706-535434 | 4:47:06.2 | -53:54:34.4 | 0.00 | 0.00 | 1.758 | 0.197 | 4.192 | 0.199 | 9.3 | 3.1 | 7.5 |
| 270 | ATCA-ADFS J044706-532346 | 4:47:06.4 | -53:23:46.0 | 0.00 | 0.01 | 0.203 | 0.032 | 0.275 | 0.032 | |||
| 271 | ATCA-ADFS J044706-532621 | 4:47:06.5 | -53:26:21.5 | 0.00 | 0.00 | 0.624 | 0.034 | 0.686 | 0.034 | |||
| 272 | ATCA-ADFS J044706-534229 | 4:47:06.6 | -53:42:29.4 | 0.03 | 0.02 | 0.378 | 0.051 | 0.649 | 0.056 | 3.4 | 51.7 | |
| 273 | ATCA-ADFS J044706-525312 | 4:47:06.8 | -52:53:12.7 | 0.00 | 0.00 | 10.851 | 0.125 | 17.523 | 0.202 | 7.3 | -8.8 | |
| 274 | ATCA-ADFS J044707-525320 | 4:47:07.8 | -52:53:20.5 | 0.01 | 0.01 | 1.128 | 0.121 | 2.849 | 0.123 | 9.0 | 4.4 | -37.8 |
| 275 | ATCA-ADFS J044708-530245 | 4:47:08.4 | -53:02:45.2 | 0.01 | 0.02 | 0.161 | 0.044 | 0.328 | 0.045 | 6.7 | 4.1 | -12.5 |
| 276 | ATCA-ADFS J044710-533410 | 4:47:10.1 | -53:34:10.2 | 0.06 | 1.27 | 0.400 | 0.039 | 0.230 | 0.039 | |||
| 277 | ATCA-ADFS J044710-534604 | 4:47:10.5 | -53:46:04.8 | 0.01 | 0.01 | 0.685 | 0.087 | 0.798 | 0.090 | |||
| 278 | ATCA-ADFS J044710-532036 | 4:47:10.8 | -53:20:36.6 | 0.00 | 0.00 | 0.275 | 0.028 | 0.294 | 0.028 | |||
| 279 | ATCA-ADFS J044711-524023 | 4:47:12.0 | -52:40:23.1 | 0.03 | 0.03 | 1.955 | 0.314 | 3.973 | 0.334 | 8.9 | -38.6 | |
| 280 | ATCA-ADFS J044712-530247 | 4:47:12.0 | -53:02:47.7 | 0.00 | 0.00 | 1.288 | 0.037 | 1.592 | 0.038 | |||
| 281 | ATCA-ADFS J044712-530352 | 4:47:12.8 | -53:03:52.9 | 0.00 | 0.00 | 0.459 | 0.037 | 0.648 | 0.037 | |||
| 282 | ATCA-ADFS J044715-525406 | 4:47:15.2 | -52:54:06.4 | 0.32 | 0.69 | 0.261 | 0.059 | 2.223 | 0.070 | 21.2 | 10.1 | -8.2 |
| 283 | ATCA-ADFS J044715-531130 | 4:47:15.9 | -53:11:30.4 | 0.00 | 0.00 | 0.251 | 0.030 | 0.300 | 0.030 | |||
| 284† | ATCA-ADFS J044716-525919 | 4:47:16.0 | -52:59:19.8 | 0.01 | 0.01 | 0.295 | 0.049 | 0.594 | 0.050 | 6.5 | 4.1 | 16.5 |
| 285 | ATCA-ADFS J044716-532643 | 4:47:16.1 | -53:26:43.9 | 0.00 | 0.00 | 0.779 | 0.032 | 0.941 | 0.034 | |||
| 286† | ATCA-ADFS J044716-525935 | 4:47:16.5 | -52:59:35.9 | 0.01 | 0.01 | 0.216 | 0.049 | 0.341 | 0.049 | 3.2 | -75.2 | |
| 287 | ATCA-ADFS J044716-525730 | 4:47:16.5 | -52:57:30.5 | 0.00 | 0.00 | 0.535 | 0.059 | 0.665 | 0.059 | |||
| 288 | ATCA-ADFS J044717-525635 | 4:47:17.1 | -52:56:35.7 | 0.01 | 0.02 | 0.461 | 0.059 | 0.757 | 0.063 | 7.8 | -2.0 | |
| 289 | ATCA-ADFS J044718-531543 | 4:47:18.8 | -53:15:43.1 | 0.00 | 0.01 | 0.194 | 0.025 | 0.242 | 0.025 | |||
| 290 | ATCA-ADFS J044719-533423 | 4:47:20.0 | -53:34:23.0 | 0.00 | 0.00 | 1.080 | 0.039 | 1.182 | 0.041 | |||
| 291 | ATCA-ADFS J044719-525035 | 4:47:20.0 | -52:50:35.8 | 0.00 | 0.00 | 2.818 | 0.121 | 4.792 | 0.135 | 7.8 | -11.2 | |
| 292 | ATCA-ADFS J044720-530829 | 4:47:20.7 | -53:08:29.9 | 0.00 | 0.00 | 1.536 | 0.037 | 2.246 | 0.047 | |||
| 293 | ATCA-ADFS J044723-532141 | 4:47:23.2 | -53:21:41.2 | 0.00 | 0.00 | 0.309 | 0.028 | 0.332 | 0.028 | |||
| 294 | ATCA-ADFS J044723-534824 | 4:47:23.3 | -53:48:24.6 | 0.11 | 0.09 | 0.496 | 0.069 | 0.361 | 0.069 | |||
| 295 | ATCA-ADFS J044724-531411 | 4:47:24.4 | -53:14:11.8 | 0.00 | 0.00 | 0.581 | 0.028 | 0.627 | 0.029 | |||
| 296 | ATCA-ADFS J044725-532855 | 4:47:25.3 | -53:28:55.4 | 0.01 | 0.01 | 0.266 | 0.032 | 0.323 | 0.033 | |||
| 297 | ATCA-ADFS J044725-533406 | 4:47:25.3 | -53:34:06.2 | 0.00 | 0.00 | 0.466 | 0.039 | 0.270 | 0.039 | |||
| 298 | ATCA-ADFS J044726-532554 | 4:47:26.1 | -53:25:54.3 | 0.01 | 0.01 | 0.173 | 0.032 | 0.205 | 0.032 | |||
| 299 | ATCA-ADFS J044726-530030 | 4:47:26.9 | -53:00:30.1 | 0.04 | 0.25 | 0.176 | 0.040 | 0.496 | 0.041 | 12.7 | -13.3 | |
| 300 | ATCA-ADFS J044727-523923 | 4:47:27.0 | -52:39:23.7 | 0.16 | 0.12 | 1.822 | 0.314 | 8.875 | 0.364 | 13.1 | 8.9 | 85.3 |
| No | Source name | RA | DEC | RA | DEC | Speak | Speak | Stotal | Stotal | |||
|---|---|---|---|---|---|---|---|---|---|---|---|---|
| h:m:s.s | d:m:s.s | mJy | mJy | mJy | mJy | ′′ | ′′ | |||||
| beam-1 | beam-1 | |||||||||||
| (1) | (2) | (3) | (4) | (5) | (6) | (7) | (8) | (9) | (10) | (11) | (12) | (13) |
| 301 | ATCA-ADFS J044727-532626 | 4:47:27.3 | -53:26:26.6 | 0.00 | 0.00 | 0.304 | 0.032 | 0.154 | 0.032 | |||
| 302 | ATCA-ADFS J044728-532955 | 4:47:28.4 | -53:29:55.9 | 0.01 | 0.01 | 0.281 | 0.034 | 0.273 | 0.035 | |||
| 303 | ATCA-ADFS J044730-530654 | 4:47:30.7 | -53:06:54.7 | 0.10 | 0.41 | 0.076 | 0.025 | 0.230 | 0.027 | 12.6 | 2.8 | 4.8 |
| 304 | ATCA-ADFS J044731-531828 | 4:47:31.8 | -53:18:28.3 | 0.00 | 0.00 | 0.208 | 0.025 | 0.224 | 0.025 | |||
| 305† | ATCA-ADFS J044731-532018 | 4:47:31.9 | -53:20:18.3 | 0.00 | 0.00 | 0.370 | 0.028 | 0.452 | 0.028 | |||
| 306† | ATCA-ADFS J044732-532027 | 4:47:32.5 | -53:20:27.3 | 0.00 | 0.00 | 0.454 | 0.028 | 0.550 | 0.029 | |||
| 307 | ATCA-ADFS J044732-530121 | 4:47:33.0 | -53:01:21.9 | 0.00 | 0.00 | 1.015 | 0.059 | 1.306 | 0.060 | |||
| 308 | ATCA-ADFS J044733-531409 | 4:47:33.5 | -53:14:09.4 | 0.00 | 0.00 | 0.223 | 0.028 | 0.327 | 0.028 | |||
| 309 | ATCA-ADFS J044734-530621 | 4:47:34.0 | -53:06:21.8 | 0.01 | 0.01 | 0.139 | 0.025 | 0.215 | 0.025 | 2.2 | 25.3 | |
| 310 | ATCA-ADFS J044734-530543 | 4:47:34.5 | -53:05:43.9 | 0.03 | 0.03 | 0.101 | 0.025 | 0.133 | 0.025 | |||
| 311 | ATCA-ADFS J044735-530416 | 4:47:35.5 | -53:04:16.2 | 0.00 | 0.01 | 0.274 | 0.037 | 0.351 | 0.038 | |||
| 312 | ATCA-ADFS J044736-534457 | 4:47:36.1 | -53:44:57.3 | 0.01 | 0.01 | 0.314 | 0.057 | 0.457 | 0.057 | |||
| 313 | ATCA-ADFS J044736-523953 | 4:47:36.3 | -52:39:53.9 | 0.06 | 0.06 | 2.132 | 0.314 | 4.857 | 0.355 | 9.5 | 2.6 | -40.5 |
| 314 | ATCA-ADFS J044738-533904 | 4:47:38.3 | -53:39:04.9 | 0.00 | 0.02 | 0.259 | 0.028 | 0.259 | 0.028 | |||
| 315 | ATCA-ADFS J044741-533316 | 4:47:41.6 | -53:33:16.7 | 0.00 | 0.00 | 0.402 | 0.039 | 0.473 | 0.039 | |||
| 316 | ATCA-ADFS J044742-531923 | 4:47:42.2 | -53:19:23.7 | 0.00 | 0.00 | 1.308 | 0.028 | 1.344 | 0.033 | |||
| 317 | ATCA-ADFS J044742-524002 | 4:47:42.2 | -52:40:02.2 | 0.06 | 0.12 | 1.598 | 0.314 | 4.906 | 0.338 | 11.4 | 4.5 | 26.7 |
| 318† | ATCA-ADFS J044743-531028 | 4:47:43.5 | -53:10:28.9 | 0.01 | 0.03 | 1.502 | 0.028 | 2.907 | 0.097 | 9.0 | -10.7 | |
| 319 | ATCA-ADFS J044744-530526 | 4:47:44.1 | -53:05:26.5 | 0.00 | 0.00 | 0.268 | 0.035 | 0.365 | 0.035 | |||
| 320† | ATCA-ADFS J044744-531045 | 4:47:44.6 | -53:10:45.9 | 0.09 | 0.06 | 0.286 | 0.028 | 0.864 | 0.036 | 10.0 | 5.8 | -51.5 |
| 321 | ATCA-ADFS J044745-533401 | 4:47:45.1 | -53:34:01.5 | 0.00 | 0.00 | 0.285 | 0.037 | 0.322 | 0.037 | |||
| 322 | ATCA-ADFS J044745-530343 | 4:47:46.0 | -53:03:43.2 | 0.01 | 0.02 | 0.161 | 0.034 | 0.286 | 0.035 | 6.3 | 2.6 | -12.3 |
| 323 | ATCA-ADFS J044750-532343 | 4:47:50.7 | -53:23:43.7 | 0.01 | 0.00 | 0.171 | 0.027 | 0.224 | 0.027 | |||
| 324 | ATCA-ADFS J044750-540516 | 4:47:50.9 | -54:05:16.1 | 0.17 | 0.09 | 4.030 | 0.590 | 4.886 | 0.728 | |||
| 325 | ATCA-ADFS J044751-540037 | 4:47:51.6 | -54:00:37.4 | 0.10 | 0.07 | 1.514 | 0.197 | 2.510 | 0.219 | 9.6 | -52.1 | |
| 326 | ATCA-ADFS J044752-530706 | 4:47:52.1 | -53:07:06.3 | 0.00 | 0.00 | 1.970 | 0.037 | 2.405 | 0.038 | |||
| 327 | ATCA-ADFS J044752-533309 | 4:47:52.9 | -53:33:09.8 | 0.00 | 0.00 | 0.762 | 0.039 | 0.967 | 0.039 | |||
| 328 | ATCA-ADFS J044753-534808 | 4:47:53.3 | -53:48:08.9 | 0.00 | 0.00 | 1.142 | 0.087 | 1.457 | 0.087 | |||
| 329 | ATCA-ADFS J044756-532424 | 4:47:56.5 | -53:24:24.4 | 0.00 | 0.00 | 0.279 | 0.032 | 0.341 | 0.032 | |||
| 330 | ATCA-ADFS J044756-531334 | 4:47:56.8 | -53:13:34.6 | 0.00 | 0.00 | 0.167 | 0.028 | 0.263 | 0.028 | 2.1 | 18.1 | |
| 331 | ATCA-ADFS J044757-533032 | 4:47:57.5 | -53:30:32.9 | 0.00 | 0.00 | 1.034 | 0.031 | 1.243 | 0.032 | |||
| 332 | ATCA-ADFS J044758-533605 | 4:47:58.8 | -53:36:05.4 | 0.00 | 0.00 | 0.789 | 0.039 | 0.983 | 0.041 | |||
| 333 | ATCA-ADFS J044759-533140 | 4:47:59.4 | -53:31:40.2 | 0.00 | 0.00 | 0.175 | 0.030 | 0.184 | 0.030 | |||
| 334 | ATCA-ADFS J044759-530504 | 4:47:59.4 | -53:05:04.9 | 0.00 | 0.00 | 0.187 | 0.032 | 0.217 | 0.032 | |||
| 335 | ATCA-ADFS J044759-530003 | 4:47:59.5 | -53:00:03.4 | 0.00 | 0.00 | 0.643 | 0.055 | 0.328 | 0.055 | |||
| 336† | ATCA-ADFS J044802-532611 | 4:48:02.4 | -53:26:11.7 | 0.03 | 0.07 | 0.143 | 0.029 | 0.301 | 0.030 | 10.1 | -6.4 | |
| 337† | ATCA-ADFS J044802-532617 | 4:48:02.7 | -53:26:17.4 | 0.02 | 0.04 | 0.176 | 0.029 | 0.334 | 0.030 | 10.8 | -39.1 | |
| 338 | ATCA-ADFS J044804-533855 | 4:48:04.3 | -53:38:55.2 | 0.12 | 0.34 | 0.699 | 0.061 | 0.421 | 0.061 | |||
| 339 | ATCA-ADFS J044805-532010 | 4:48:05.2 | -53:20:10.8 | 0.00 | 0.00 | 0.949 | 0.029 | 1.082 | 0.030 | |||
| 340 | ATCA-ADFS J044805-531658 | 4:48:05.4 | -53:16:58.4 | 0.01 | 0.03 | 0.424 | 0.029 | 0.856 | 0.035 | 10.2 | -18.2 | |
| 341 | ATCA-ADFS J044808-532540 | 4:48:08.3 | -53:25:40.4 | 0.35 | 2.75 | 0.266 | 0.028 | 0.166 | 0.028 | |||
| 342 | ATCA-ADFS J044808-531128 | 4:48:08.4 | -53:11:28.9 | 0.00 | 0.00 | 0.820 | 0.030 | 0.974 | 0.032 | |||
| 343 | ATCA-ADFS J044810-532450 | 4:48:10.9 | -53:24:50.7 | 0.00 | 0.00 | 0.475 | 0.031 | 0.530 | 0.031 | |||
| 344 | ATCA-ADFS J044812-531629 | 4:48:12.1 | -53:16:29.1 | 0.00 | 0.00 | 0.705 | 0.029 | 0.809 | 0.031 | |||
| 345 | ATCA-ADFS J044812-531745 | 4:48:12.2 | -53:17:45.2 | 0.00 | 0.00 | 0.471 | 0.029 | 0.213 | 0.029 | |||
| 346 | ATCA-ADFS J044813-531927 | 4:48:13.8 | -53:19:27.2 | 0.00 | 0.00 | 0.191 | 0.029 | 0.269 | 0.029 | |||
| 347 | ATCA-ADFS J044813-533804 | 4:48:13.9 | -53:38:04.3 | 0.00 | 0.00 | 0.374 | 0.039 | 0.470 | 0.039 | |||
| 348 | ATCA-ADFS J044817-530733 | 4:48:17.5 | -53:07:33.1 | 0.00 | 0.01 | 0.316 | 0.037 | 0.687 | 0.037 | 6.7 | 5.1 | 56.0 |
| 349 | ATCA-ADFS J044818-533753 | 4:48:18.7 | -53:37:53.1 | 0.00 | 0.00 | 0.350 | 0.039 | 0.283 | 0.039 | |||
| 350 | ATCA-ADFS J044820-531012 | 4:48:20.2 | -53:10:12.5 | 0.00 | 0.00 | 0.200 | 0.028 | 0.282 | 0.028 |
| No | Source name | RA | DEC | RA | DEC | Speak | Speak | Stotal | Stotal | |||
|---|---|---|---|---|---|---|---|---|---|---|---|---|
| h:m:s.s | d:m:s.s | mJy | mJy | mJy | mJy | ′′ | ′′ | |||||
| beam-1 | beam-1 | |||||||||||
| (1) | (2) | (3) | (4) | (5) | (6) | (7) | (8) | (9) | (10) | (11) | (12) | (13) |
| 351 | ATCA-ADFS J044823-532144 | 4:48:23.7 | -53:21:44.9 | 0.00 | 0.00 | 0.962 | 0.029 | 1.088 | 0.032 | |||
| 352 | ATCA-ADFS J044823-534125 | 4:48:23.8 | -53:41:25.6 | 0.04 | 0.04 | 0.414 | 0.061 | 0.670 | 0.069 | 2.8 | 38.4 | |
| 353 | ATCA-ADFS J044824-531440 | 4:48:24.0 | -53:14:40.0 | 0.00 | 0.00 | 0.860 | 0.030 | 0.946 | 0.033 | |||
| 354 | ATCA-ADFS J044826-530138 | 4:48:26.6 | -53:01:38.1 | 0.00 | 0.00 | 0.676 | 0.037 | 0.857 | 0.037 | |||
| 355 | ATCA-ADFS J044827-530547 | 4:48:27.8 | -53:05:47.9 | 0.00 | 0.01 | 0.176 | 0.035 | 0.197 | 0.035 | |||
| 356 | ATCA-ADFS J044828-534600 | 4:48:28.3 | -53:46:00.8 | 0.01 | 0.01 | 0.592 | 0.061 | 0.827 | 0.065 | |||
| 357 | ATCA-ADFS J044828-531924 | 4:48:28.4 | -53:19:25.0 | 0.00 | 0.01 | 0.152 | 0.029 | 0.196 | 0.029 | |||
| 358 | ATCA-ADFS J044830-530157 | 4:48:30.6 | -53:01:57.8 | 0.00 | 0.00 | 0.635 | 0.037 | 0.798 | 0.039 | |||
| 359 | ATCA-ADFS J044831-530730 | 4:48:31.0 | -53:07:30.9 | 0.02 | 0.01 | 0.242 | 0.034 | 0.297 | 0.036 | |||
| 360 | ATCA-ADFS J044831-530801 | 4:48:31.3 | -53:08:02.0 | 0.01 | 0.02 | 0.334 | 0.037 | 0.466 | 0.040 | |||
| 361 | ATCA-ADFS J044832-524111 | 4:48:32.6 | -52:41:11.5 | 0.00 | 0.00 | 145.708 | 0.478 | 304.702 | 1.858 | 9.6 | 0.8 | |
| 362 | ATCA-ADFS J044833-524107 | 4:48:33.5 | -52:41:07.7 | 0.00 | 0.02 | 305.631 | 0.478 | 625.248 | 14.080 | 9.4 | 6.7 | |
| 363 | ATCA-ADFS J044833-530610 | 4:48:33.5 | -53:06:11.0 | 0.01 | 0.01 | 0.147 | 0.036 | 0.230 | 0.036 | |||
| 364 | ATCA-ADFS J044833-530820 | 4:48:33.5 | -53:08:20.9 | 0.00 | 0.00 | 0.168 | 0.034 | 0.237 | 0.034 | |||
| 365 | ATCA-ADFS J044835-532718 | 4:48:35.0 | -53:27:18.8 | 0.00 | 0.00 | 0.170 | 0.029 | 0.229 | 0.029 | |||
| 366 | ATCA-ADFS J044836-532613 | 4:48:36.6 | -53:26:13.8 | 0.02 | 0.04 | 0.203 | 0.031 | 0.317 | 0.034 | |||
| 367 | ATCA-ADFS J044836-531927 | 4:48:36.7 | -53:19:27.5 | 0.00 | 0.00 | 0.442 | 0.029 | 0.528 | 0.030 | |||
| 368 | ATCA-ADFS J044837-530812 | 4:48:37.0 | -53:08:12.8 | 0.13 | 0.33 | 0.101 | 0.034 | 0.370 | 0.036 | 14.1 | 4.2 | -19.0 |
| 369 | ATCA-ADFS J044837-533516 | 4:48:37.1 | -53:35:16.9 | 0.01 | 0.02 | 0.254 | 0.039 | 0.461 | 0.041 | 7.1 | -14.5 | |
| 370 | ATCA-ADFS J044837-533104 | 4:48:37.2 | -53:31:04.2 | 0.00 | 0.00 | 0.212 | 0.033 | 0.267 | 0.033 | |||
| 371† | ATCA-ADFS J044838-525935 | 4:48:38.9 | -52:59:35.8 | 0.00 | 0.00 | 0.373 | 0.054 | 0.414 | 0.055 | |||
| 372 | ATCA-ADFS J044842-533108 | 4:48:42.1 | -53:31:08.7 | 0.00 | 0.00 | 0.446 | 0.031 | 0.530 | 0.031 | |||
| 373† | ATCA-ADFS J044842-525927 | 4:48:42.4 | -52:59:27.2 | 0.18 | 0.25 | 0.214 | 0.054 | 0.659 | 0.058 | 11.2 | 4.7 | -41.8 |
| 374 | ATCA-ADFS J044842-532346 | 4:48:42.9 | -53:23:46.0 | 0.00 | 0.00 | 0.523 | 0.029 | 0.775 | 0.030 | 6.3 | -2.6 | |
| 375 | ATCA-ADFS J044842-525142 | 4:48:42.9 | -52:51:42.4 | 0.00 | 0.01 | 6.732 | 0.127 | 22.240 | 0.273 | 15.9 | 4.2 | |
| 376 | ATCA-ADFS J044842-530008 | 4:48:42.9 | -53:00:08.2 | 0.01 | 0.01 | 1.262 | 0.059 | 2.103 | 0.070 | 3.1 | 17.3 | |
| 377 | ATCA-ADFS J044845-532532 | 4:48:45.1 | -53:25:32.6 | 0.00 | 0.00 | 0.246 | 0.033 | 0.354 | 0.033 | |||
| 378† | ATCA-ADFS J044845-530004 | 4:48:45.7 | -53:00:04.9 | 0.07 | 0.07 | 0.292 | 0.052 | 0.831 | 0.055 | 9.6 | 5.5 | 51.4 |
| 379† | ATCA-ADFS J044846-530001 | 4:48:46.1 | -53:00:01.2 | 0.05 | 0.06 | 0.261 | 0.052 | 0.778 | 0.055 | 9.3 | 6.0 | 9.9 |
| 380† | ATCA-ADFS J044848-532555 | 4:48:48.2 | -53:25:55.5 | 0.00 | 0.00 | 0.213 | 0.033 | 0.278 | 0.033 | 6.3 | 5.2 | |
| 381 | ATCA-ADFS J044848-533317 | 4:48:48.6 | -53:33:17.5 | 0.00 | 0.01 | 0.325 | 0.043 | 0.410 | 0.043 | |||
| 382 | ATCA-ADFS J044848-533317 | 4:48:48.6 | -53:31:09.6 | 0.00 | 0.00 | 0.143 | 0.048 | 0.168 | 0.038 | |||
| 383 | ATCA-ADFS J044852-531641 | 4:48:52.9 | -53:16:41.3 | 0.00 | 0.00 | 0.156 | 0.030 | 0.179 | 0.030 | |||
| 384 | ATCA-ADFS J044853-534031 | 4:48:53.7 | -53:40:31.9 | 0.01 | 0.01 | 0.553 | 0.078 | 0.720 | 0.080 | |||
| 385 | ATCA-ADFS J044854-532141 | 4:48:54.7 | -53:21:41.1 | 0.00 | 0.00 | 0.521 | 0.034 | 0.637 | 0.035 | |||
| 386 | ATCA-ADFS J044855-530133 | 4:48:55.5 | -53:01:33.5 | 0.01 | 0.01 | 0.224 | 0.051 | 0.360 | 0.051 | 8.6 | 34.9 | |
| 387 | ATCA-ADFS J044857-530649 | 4:48:57.8 | -53:06:49.8 | 0.02 | 0.06 | 0.204 | 0.042 | 0.245 | 0.045 | |||
| 388 | ATCA-ADFS J044858-531600 | 4:48:58.0 | -53:16:01.0 | 0.05 | 0.03 | 0.124 | 0.031 | 0.222 | 0.032 | 3.7 | -67.9 | |
| 389 | ATCA-ADFS J040490-532535 | 4:049:0.6 | -53:25:35.5 | 0.00 | 0.00 | 5.268 | 0.038 | 7.699 | 0.072 | |||
| 390 | ATCA-ADFS J044901-534111 | 4:49:01.4 | -53:41:11.7 | 0.00 | 0.00 | 0.603 | 0.078 | 0.866 | 0.078 | |||
| 391 | ATCA-ADFS J044903-532723 | 4:49:03.3 | -53:27:23.0 | 0.03 | 0.10 | 0.187 | 0.035 | 0.636 | 0.038 | 13.5 | 3.8 | 17.1 |
| 392 | ATCA-ADFS J044903-535225 | 4:49:03.6 | -53:52:25.1 | 0.00 | 0.00 | 1.553 | 0.160 | 1.472 | 0.160 | |||
| 393 | ATCA-ADFS J044905-531733 | 4:49:05.6 | -53:17:33.0 | 0.00 | 0.00 | 0.427 | 0.034 | 0.477 | 0.034 | |||
| 394 | ATCA-ADFS J044905-525234 | 4:49:06.0 | -52:52:34.8 | 0.01 | 0.04 | 1.097 | 0.179 | 2.782 | 0.184 | 12.1 | -18.5 | |
| 395 | ATCA-ADFS J044906-525247 | 4:49:06.0 | -52:52:47.1 | 0.00 | 0.01 | 2.099 | 0.179 | 4.169 | 0.186 | 7.9 | 2.0 | |
| 396 | ATCA-ADFS J044906-531643 | 4:49:06.4 | -53:16:43.8 | 0.00 | 0.00 | 0.219 | 0.034 | 0.285 | 0.034 | |||
| 397 | ATCA-ADFS J044910-534052 | 4:49:10.9 | -53:40:52.0 | 0.00 | 0.00 | 1.538 | 0.078 | 3.720 | 0.089 | 8.6 | 4.4 | -37.9 |
| 398 | ATCA-ADFS J044913-530936 | 4:49:13.2 | -53:09:36.5 | 0.00 | 0.01 | 0.521 | 0.035 | 0.976 | 0.037 | 7.0 | 2.4 | 14.5 |
| 399 | ATCA-ADFS J044913-524926 | 4:49:13.3 | -52:49:26.6 | 0.00 | 0.02 | 1.400 | 0.179 | 3.291 | 0.188 | 11.4 | 12.2 | |
| 400 | ATCA-ADFS J044914-530221 | 4:49:14.3 | -53:02:21.6 | 0.02 | 0.01 | 3.942 | 0.046 | 12.607 | 0.201 | 11.6 | 5.4 | 74.7 |
| No | Source name | RA | DEC | RA | DEC | Speak | Speak | Stotal | Stotal | |||
|---|---|---|---|---|---|---|---|---|---|---|---|---|
| h:m:s.s | d:m:s.s | mJy | mJy | mJy | mJy | ′′ | ′′ | |||||
| beam-1 | beam-1 | |||||||||||
| (1) | (2) | (3) | (4) | (5) | (6) | (7) | (8) | (9) | (10) | (11) | (12) | (13) |
| 401 | ATCA-ADFS J044914-530716 | 4:49:14.7 | -53:07:16.9 | 0.00 | 0.00 | 0.560 | 0.046 | 0.710 | 0.047 | |||
| 402 | ATCA-ADFS J044917-532530 | 4:49:17.4 | -53:25:30.5 | 0.00 | 0.00 | 0.215 | 0.034 | 0.247 | 0.034 | |||
| 403 | ATCA-ADFS J044920-531748 | 4:49:20.2 | -53:17:48.7 | 0.04 | 0.06 | 0.123 | 0.029 | 0.263 | 0.031 | 7.7 | 3.4 | -18.5 |
| 404 | ATCA-ADFS J044921-524710 | 4:49:21.0 | -52:47:10.6 | 0.00 | 0.00 | 1.517 | 0.179 | 1.646 | 0.179 | |||
| 405 | ATCA-ADFS J044921-531144 | 4:49:21.1 | -53:11:44.6 | 0.01 | 0.01 | 0.178 | 0.039 | 0.257 | 0.039 | 6.7 | -12.8 | |
| 406 | ATCA-ADFS J044922-532122 | 4:49:22.3 | -53:21:22.4 | 0.01 | 0.01 | 0.545 | 0.034 | 0.234 | 0.034 | |||
| 407 | ATCA-ADFS J044922-532500 | 4:49:22.7 | -53:25:00.3 | 0.00 | 0.00 | 0.208 | 0.033 | 0.266 | 0.033 | |||
| 408 | ATCA-ADFS J044923-532431 | 4:49:23.1 | -53:24:31.0 | 0.04 | 0.06 | 0.116 | 0.033 | 0.224 | 0.034 | 9.1 | -34.0 | |
| 409 | ATCA-ADFS J044924-531127 | 4:49:24.3 | -53:11:27.4 | 0.00 | 0.00 | 0.412 | 0.035 | 0.578 | 0.036 | |||
| 410† | ATCA-ADFS J044928-532600 | 4:49:28.3 | -53:26:00.0 | 0.08 | 0.09 | 0.146 | 0.036 | 0.301 | 0.038 | 6.3 | 5.0 | -67.9 |
| 411† | ATCA-ADFS J044928-532610 | 4:49:28.7 | -53:26:10.1 | 0.00 | 0.00 | 0.215 | 0.036 | 0.271 | 0.036 | |||
| 412 | ATCA-ADFS J044928-532045 | 4:49:28.8 | -53:20:45.6 | 0.00 | 0.00 | 0.349 | 0.034 | 0.433 | 0.034 | |||
| 413 | ATCA-ADFS J044929-530814 | 4:49:29.7 | -53:08:14.0 | 0.06 | 0.09 | 0.179 | 0.044 | 0.576 | 0.045 | 11.7 | 4.9 | 37.9 |
| 414 | ATCA-ADFS J044930-531646 | 4:49:30.6 | -53:16:46.8 | 0.00 | 0.00 | 0.546 | 0.034 | 0.705 | 0.034 | |||
| 415 | ATCA-ADFS J044931-532335 | 4:49:31.5 | -53:23:35.3 | 0.00 | 0.00 | 0.347 | 0.034 | 0.417 | 0.034 | |||
| 416 | ATCA-ADFS J044932-533156 | 4:49:32.8 | -53:31:56.9 | 0.06 | 0.02 | 0.229 | 0.046 | 0.461 | 0.049 | 8.4 | 3.2 | 81.3 |
| 417 | ATCA-ADFS J044933-525830 | 4:49:33.5 | -52:58:30.1 | 0.01 | 0.01 | 0.511 | 0.074 | 0.903 | 0.077 | 7.2 | 9.2 | |
| 418 | ATCA-ADFS J044935-524810 | 4:49:35.6 | -52:48:10.2 | 0.00 | 0.00 | 2.011 | 0.179 | 2.896 | 0.181 | 6.4 | 13.0 | |
| 419 | ATCA-ADFS J044939-533420 | 4:49:39.3 | -53:34:20.2 | 0.00 | 0.00 | 0.309 | 0.055 | 0.409 | 0.055 | |||
| 420 | ATCA-ADFS J044944-532145 | 4:49:44.6 | -53:21:45.7 | 1.26 | 1.86 | 0.500 | 0.046 | 0.320 | 0.046 | |||
| 421 | ATCA-ADFS J044947-530555 | 4:49:47.9 | -53:05:55.7 | 0.00 | 0.00 | 0.379 | 0.058 | 0.617 | 0.058 | 3.6 | 76.4 | |
| 422 | ATCA-ADFS J044950-532540 | 4:49:51.0 | -53:25:40.2 | 0.01 | 0.01 | 0.234 | 0.045 | 0.347 | 0.046 | |||
| 423 | ATCA-ADFS J044951-530621 | 4:49:51.3 | -53:06:21.2 | 0.00 | 0.00 | 0.545 | 0.066 | 0.764 | 0.066 | |||
| 424 | ATCA-ADFS J044952-534449 | 4:49:52.2 | -53:44:49.8 | 0.00 | 0.01 | 1.030 | 0.112 | 1.697 | 0.114 | 7.8 | -23.0 | |
| 425† | ATCA-ADFS J044952-531205 | 4:49:52.4 | -53:12:05.6 | 0.00 | 0.00 | 0.831 | 0.054 | 0.369 | 0.054 | |||
| 426 | ATCA-ADFS J044952-533619 | 4:49:52.7 | -53:36:19.2 | 0.00 | 8.84 | 0.491 | 0.069 | 0.370 | 0.069 | |||
| 427 | ATCA-ADFS J044953-525737 | 4:49:53.8 | -52:57:38.0 | 0.00 | 0.00 | 3.114 | 0.106 | 4.553 | 0.112 | |||
| 428† | ATCA-ADFS J044955-531159 | 4:49:55.0 | -53:11:59.4 | 0.00 | 0.00 | 0.339 | 0.049 | 0.485 | 0.049 | |||
| 429 | ATCA-ADFS J044956-532432 | 4:49:56.7 | -53:24:32.4 | 0.12 | 0.12 | 0.525 | 0.050 | 3.381 | 0.070 | 13.1 | 12.6 | 62.9 |
| 430 | ATCA-ADFS J044956-532430 | 4:49:56.7 | -53:24:30.1 | 0.01 | 0.12 | 0.375 | 0.050 | 5.870 | 0.056 | 30.8 | 14.2 | -49.7 |
| 431 | ATCA-ADFS J044958-531509 | 4:49:58.4 | -53:15:09.6 | 0.09 | 0.02 | 0.206 | 0.049 | 0.509 | 0.051 | 10.9 | 3.4 | 79.6 |
| 432 | ATCA-ADFS J045005-533411 | 4:50:05.4 | -53:34:11.0 | 0.00 | 0.00 | 2.742 | 0.067 | 4.189 | 0.075 | |||
| 433 | ATCA-ADFS J045011-531753 | 4:50:11.4 | -53:17:53.7 | 0.00 | 0.00 | 0.859 | 0.046 | 1.160 | 0.047 | |||
| 434† | ATCA-ADFS J045013-532517 | 4:50:13.9 | -53:25:17.1 | 0.03 | 0.09 | 0.659 | 0.050 | 3.225 | 0.073 | 15.0 | 7.1 | 4.1 |
| 435 | ATCA-ADFS J045014-531207 | 4:50:14.3 | -53:12:07.0 | 0.00 | 0.00 | 0.379 | 0.050 | 0.438 | 0.050 | |||
| 43†6 | ATCA-ADFS J045015-532459 | 4:50:15.6 | -53:24:59.9 | 0.01 | 0.03 | 0.860 | 0.050 | 3.274 | 0.067 | 13.0 | 5.6 | 15.8 |
| 437 | ATCA-ADFS J045016-531549 | 4:50:16.1 | -53:15:49.3 | 0.00 | 0.00 | 1.638 | 0.050 | 2.503 | 0.056 | |||
| 438 | ATCA-ADFS J045016-532748 | 4:50:16.2 | -53:27:48.3 | 0.00 | 0.00 | 0.972 | 0.050 | 2.177 | 0.055 | 9.0 | 3.6 | -65.9 |
| 439 | ATCA-ADFS J045024-525706 | 4:50:24.6 | -52:57:06.6 | 0.09 | 0.30 | 0.559 | 0.106 | 3.073 | 0.125 | 16.0 | 7.8 | 13.8 |
| 440 | ATCA-ADFS J045024-534620 | 4:50:24.7 | -53:46:20.4 | 0.01 | 0.01 | 2.627 | 0.254 | 9.443 | 0.272 | 10.7 | 7.1 | -33.8 |
| 441 | ATCA-ADFS J045025-524653 | 4:50:25.1 | -52:46:53.0 | 0.83 | 0.30 | 0.930 | 0.212 | 6.239 | 0.257 | 16.7 | 10.2 | -47.4 |
| 442 | ATCA-ADFS J045025-524630 | 4:50:25.7 | -52:46:30.4 | 0.01 | 0.03 | 1.705 | 0.212 | 2.204 | 0.215 | |||
| 443 | ATCA-ADFS J045026-534552 | 4:50:26.6 | -53:45:52.4 | 0.02 | 0.01 | 0.702 | 0.112 | 1.105 | 0.117 | 6.5 | -59.1 | |
| 444 | ATCA-ADFS J045027-535220 | 4:50:27.2 | -53:52:20.5 | 0.01 | 0.02 | 2.002 | 0.254 | 2.206 | 0.265 | |||
| 445 | ATCA-ADFS J045028-531005 | 4:50:28.1 | -53:10:05.2 | 0.00 | 0.00 | 1.071 | 0.089 | 1.485 | 0.091 | |||
| 446 | ATCA-ADFS J045029-534648 | 4:50:29.0 | -53:46:48.1 | 0.00 | 0.00 | 23.575 | 0.519 | 45.099 | 0.628 | 8.4 | -27.9 | |
| 447 | ATCA-ADFS J045032-531844 | 4:50:32.8 | -53:18:45.0 | 0.00 | 0.00 | 8.557 | 0.079 | 13.048 | 0.108 | |||
| 448 | ATCA-ADFS J045048-534600 | 4:50:48.9 | -53:46:00.0 | 0.00 | 0.00 | 13.588 | 0.519 | 26.833 | 0.545 | 8.5 | -35.9 | |
| 449 | ATCA-ADFS J045049-524627 | 4:50:49.8 | -52:46:27.9 | 0.03 | 0.13 | 2.529 | 0.418 | 5.703 | 0.460 | 9.8 | 9.4 | |
| 450 | ATCA-ADFS J045051-531455 | 4:50:51.1 | -53:14:55.4 | 0.00 | 0.00 | 0.519 | 0.086 | 0.867 | 0.087 | 3.9 | -71.9 |
| No | Source name | RA | DEC | RA | DEC | Speak | Speak | Stotal | Stotal | |||
|---|---|---|---|---|---|---|---|---|---|---|---|---|
| h:m:s.s | d:m:s.s | mJy | mJy | mJy | mJy | ′′ | ′′ | |||||
| beam-1 | beam-1 | |||||||||||
| (1) | (2) | (3) | (4) | (5) | (6) | (7) | (8) | (9) | (10) | (11) | (12) | (13) |
| 451 | ATCA-ADFS J045052-531120 | 4:50:52.7 | -53:11:20.5 | 0.01 | 0.01 | 0.566 | 0.086 | 0.820 | 0.086 | |||
| 452 | ATCA-ADFS J045055-531247 | 4:50:55.6 | -53:12:47.5 | 0.00 | 0.00 | 0.823 | 0.104 | 0.578 | 0.104 | |||
| 453 | ATCA-ADFS J045102-524726 | 4:51:02.5 | -52:47:26.6 | 0.00 | 0.00 | 3.847 | 0.418 | 2.931 | 0.420 | |||
| 454 | ATCA-ADFS J045105-524135 | 4:51:05.6 | -52:41:35.2 | 1.03 | 2.02 | 11.977 | 1.313 | 12.258 | 1.329 | |||
| 455 | ATCA-ADFS J045105-524011 | 4:51:05.8 | -52:40:11.7 | 0.00 | 0.00 | 12.550 | 1.313 | 10.169 | 1.327 | |||
| 456 | ATCA-ADFS J045107-535122 | 4:51:07.5 | -53:51:22.1 | 0.03 | 0.02 | 3.763 | 0.519 | 5.997 | 0.570 | 3.0 | -66.1 | |
| 457 | ATCA-ADFS J045108-524056 | 4:51:08.2 | -52:40:56.1 | 0.01 | 0.02 | 9.444 | 1.313 | 14.216 | 1.359 | 8.5 | 8.2 | |
| 458 | ATCA-ADFS J045111-531005 | 4:51:11.7 | -53:10:05.0 | 0.00 | 0.00 | 27.098 | 0.089 | 51.014 | 0.301 | 4.3 | 68.1 | |
| 459 | ATCA-ADFS J045112-525420 | 4:51:12.5 | -52:54:20.8 | 0.05 | 0.19 | 1.005 | 0.185 | 4.226 | 0.216 | 14.4 | 5.7 | 5.2 |
| 460 | ATCA-ADFS J045112-530950 | 4:51:12.8 | -53:09:50.4 | 0.01 | 0.02 | 0.580 | 0.089 | 0.906 | 0.093 | 6.5 | -28.2 | |
| 461 | ATCA-ADFS J045113-524901 | 4:51:13.5 | -52:49:01.6 | 0.09 | 0.22 | 2.282 | 0.418 | 8.169 | 0.505 | 13.1 | 4.7 | -1.8 |
| 462 | ATCA-ADFS J045114-535300 | 4:51:14.6 | -53:53:00.2 | 0.00 | 0.00 | 8.905 | 0.519 | 4.259 | 0.531 | |||
| 463 | ATCA-ADFS J045115-525405 | 4:51:15.1 | -52:54:05.1 | 0.10 | 0.04 | 1.235 | 0.185 | 2.346 | 0.219 | 6.8 | 4.0 | -87.7 |
| 464 | ATCA-ADFS J045115-535313 | 4:51:15.7 | -53:53:13.4 | 0.23 | 0.26 | 8.194 | 0.519 | 4.318 | 0.520 | |||
| 465 | ATCA-ADFS J045116-535237 | 4:51:16.4 | -53:52:37.1 | 2.77 | 0.15 | 3.641 | 0.519 | 7.347 | 0.673 | 9.1 | 2.7 | -86.2 |
| 466 | ATCA-ADFS J045117-534428 | 4:51:17.3 | -53:44:28.2 | 0.02 | 0.01 | 1.370 | 0.205 | 1.558 | 0.213 | |||
| 467 | ATCA-ADFS J045118-524727 | 4:51:18.2 | -52:47:27.1 | 0.03 | 0.02 | 7.084 | 1.169 | 17.688 | 1.225 | 9.7 | 3.9 | 48.2 |
| 468 | ATCA-ADFS J045118-535307 | 4:51:18.6 | -53:53:07.8 | 0.01 | 0.01 | 8.692 | 0.519 | 9.380 | 0.536 | |||
| 469 | ATCA-ADFS J045119-535211 | 4:51:19.5 | -53:52:11.2 | 0.05 | 0.38 | 3.267 | 0.519 | 7.113 | 0.640 | 12.6 | -7.6 | |
| 470 | ATCA-ADFS J045128-532220 | 4:51:28.7 | -53:22:20.5 | 0.03 | 0.03 | 3.748 | 0.168 | 13.261 | 0.322 | 8.8 | 8.6 | 82.4 |
| 471 | ATCA-ADFS J045136-524710 | 4:51:36.6 | -52:47:10.4 | 0.00 | 0.00 | 6.921 | 1.169 | 23.498 | 1.434 | 12.0 | 5.8 | 89.0 |
| 472 | ATCA-ADFS J045138-524650 | 4:51:39.0 | -52:46:50.6 | 0.01 | 0.01 | 9.279 | 1.169 | 13.088 | 1.207 | |||
| 473 | ATCA-ADFS J045149-524645 | 4:51:49.2 | -52:46:45.4 | 0.25 | 2.63 | 6.273 | 1.169 | 26.447 | 1.436 | 17.0 | 3.8 | 13.4 |
| 474 | ATCA-ADFS J045149-530138 | 4:51:49.8 | -53:01:38.8 | 0.05 | 0.12 | 2.542 | 0.283 | 8.676 | 0.353 | 11.4 | 5.7 | 2.2 |
| 475 | ATCA-ADFS J045149-524827 | 4:51:49.8 | -52:48:27.4 | 0.17 | 0.26 | 5.931 | 1.169 | 17.767 | 1.439 | 10.6 | 4.8 | 26.3 |
| 476 | ATCA-ADFS J045149-524617 | 4:51:49.9 | -52:46:17.8 | 1.33 | 0.12 | 6.887 | 1.169 | 27.034 | 1.273 | 13.0 | 6.7 | 85.5 |
| 477 | ATCA-ADFS J045150-524635 | 4:51:50.5 | -52:46:35.7 | 0.00 | 0.00 | 17.132 | 1.169 | 8.993 | 1.181 | |||
| 478 | ATCA-ADFS J045150-525038 | 4:51:50.5 | -52:50:38.3 | 0.11 | 0.36 | 5.820 | 1.169 | 16.062 | 1.370 | 13.0 | 4.6 | |
| 479 | ATCA-ADFS J045151-524633 | 4:51:51.5 | -52:46:33.1 | 0.04 | 0.01 | 8.867 | 1.169 | 10.264 | 1.179 | |||
| 480 | ATCA-ADFS J045151-524724 | 4:51:51.6 | -52:47:24.1 | 0.00 | 0.00 | 11.761 | 1.169 | 14.152 | 1.195 | |||
| 481 | ATCA-ADFS J045151-524646 | 4:51:51.7 | -52:46:46.7 | 0.03 | 0.26 | 8.903 | 1.169 | 15.664 | 1.458 | 10.2 | -6.6 | |
| 482 | ATCA-ADFS J045151-532021 | 4:51:51.7 | -53:20:21.4 | 0.01 | 0.01 | 1.850 | 0.168 | 3.386 | 0.177 | 6.6 | 3.4 | -63.1 |
| 483 | ATCA-ADFS J045151-524842 | 4:51:51.7 | -52:48:42.4 | 0.04 | 0.10 | 7.938 | 1.169 | 25.015 | 1.386 | 11.9 | 4.1 | 5.2 |
| 484 | ATCA-ADFS J045151-525438 | 4:51:51.9 | -52:54:38.7 | 0.01 | 0.00 | 4.121 | 0.485 | 4.216 | 0.486 | |||
| 485 | ATCA-ADFS J045152-525502 | 4:51:52.5 | -52:55:02.5 | 0.29 | 0.19 | 2.875 | 0.485 | 12.804 | 0.601 | 12.2 | 8.3 | 14.2 |
| 486 | ATCA-ADFS J045154-524724 | 4:51:54.9 | -52:47:24.4 | 0.14 | 0.65 | 9.557 | 1.169 | 16.203 | 1.417 | 9.7 | -24.5 | |
| 487 | ATCA-ADFS J045155-530311 | 4:51:55.2 | -53:03:11.5 | 0.08 | 0.03 | 2.268 | 0.283 | 5.249 | 0.348 | 8.7 | 4.1 | 67.5 |
| 488 | ATCA-ADFS J045156-534525 | 4:51:56.6 | -53:45:25.5 | 0.05 | 0.03 | 3.238 | 0.512 | 6.335 | 0.557 | 5.0 | -78.6 | |
| 489 | ATCA-ADFS J045156-525400 | 4:51:56.9 | -52:54:00.7 | 0.08 | 0.28 | 3.240 | 0.485 | 8.096 | 0.629 | 11.2 | -1.7 | |
| 490 | ATCA-ADFS J045158-534542 | 4:51:58.5 | -53:45:42.8 | 1.98 | 1.28 | 2.648 | 0.512 | 9.577 | 0.777 | 13.8 | 5.1 | 62.5 |
| 491 | ATCA-ADFS J045159-524900 | 4:51:59.1 | -52:49:00.2 | 0.00 | 0.00 | 10.178 | 1.169 | 14.682 | 1.170 | |||
| 492 | ATCA-ADFS J045159-525648 | 4:51:59.8 | -52:56:48.3 | 0.04 | 0.40 | 2.870 | 0.485 | 10.141 | 0.596 | 17.8 | -4.5 | |
| 493 | ATCA-ADFS J045159-525543 | 4:51:59.9 | -52:55:43.6 | 0.01 | 0.01 | 3.313 | 0.485 | 4.881 | 0.506 | 2.2 | 58.6 | |
| 494 | ATCA-ADFS J040520-524812 | 4:052:0.1 | -52:48:12.9 | 0.06 | 0.13 | 7.704 | 1.169 | 18.748 | 1.324 | 11.0 | 24.1 | |
| 495 | ATCA-ADFS J040520-531317 | 4:052:0.3 | -53:13:17.5 | 0.12 | 0.03 | 1.227 | 0.199 | 2.815 | 0.219 | 11.1 | 2.3 | 74.3 |
| 496 | ATCA-ADFS J040520-533002 | 4:052:0.6 | -53:30:02.9 | 0.02 | 0.02 | 1.322 | 0.194 | 2.057 | 0.204 | |||
| 497 | ATCA-ADFS J040520-530852 | 4:052:0.6 | -53:08:52.2 | 0.00 | 0.00 | 2.270 | 0.199 | 1.585 | 0.199 | |||
| 498 | ATCA-ADFS J040520-524942 | 4:052:0.7 | -52:49:43.0 | 0.01 | 0.04 | 8.448 | 1.169 | 12.124 | 1.244 | 6.6 | -2.9 | |
| 499 | ATCA-ADFS J040520-525530 | 4:052:0.9 | -52:55:30.7 | 0.01 | 0.02 | 3.826 | 0.485 | 5.604 | 0.491 | |||
| 500 | ATCA-ADFS J045201-524832 | 4:52:01.8 | -52:48:32.6 | 0.19 | 0.24 | 6.804 | 1.169 | 13.808 | 1.309 | 8.8 | 35.2 |
| No | Source name | RA | DEC | RA | DEC | Speak | Speak | Stotal | Stotal | |||
|---|---|---|---|---|---|---|---|---|---|---|---|---|
| h:m:s.s | d:m:s.s | mJy | mJy | mJy | mJy | ′′ | ′′ | |||||
| beam-1 | beam-1 | |||||||||||
| (1) | (2) | (3) | (4) | (5) | (6) | (7) | (8) | (9) | (10) | (11) | (12) | (13) |
| 501 | ATCA-ADFS J045202-524914 | 4:52:02.2 | -52:49:14.8 | 0.02 | 0.03 | 7.654 | 1.169 | 18.004 | 1.257 | 7.2 | 5.4 | 3.1 |
| 502 | ATCA-ADFS J045203-525035 | 4:52:03.1 | -52:50:35.2 | 0.00 | 0.00 | 15.911 | 1.169 | 9.492 | 1.184 | |||
| 503 | ATCA-ADFS J045203-525347 | 4:52:03.2 | -52:53:47.6 | 0.04 | 0.10 | 3.673 | 0.485 | 5.336 | 0.556 | 7.8 | 22.8 | |
| 504 | ATCA-ADFS J045203-525647 | 4:52:03.7 | -52:56:47.0 | 0.01 | 0.02 | 3.972 | 0.485 | 4.655 | 0.504 | |||
| 505 | ATCA-ADFS J045203-525429 | 4:52:03.9 | -52:54:29.1 | 0.32 | 0.46 | 14.003 | 0.485 | 6.400 | 0.525 | |||
| 506 | ATCA-ADFS J045203-524959 | 4:52:04.0 | -52:49:59.9 | 0.00 | 0.00 | 14.626 | 1.169 | 19.753 | 1.254 | 18.4 | -0.1 | |
| 507 | ATCA-ADFS J045204-534456 | 4:52:04.4 | -53:44:56.3 | 0.00 | 0.00 | 6.034 | 0.512 | 4.865 | 0.523 | |||
| 508 | ATCA-ADFS J045204-533750 | 4:52:04.7 | -53:37:50.4 | 0.00 | 0.00 | 2.550 | 0.264 | 2.467 | 0.264 | |||
| 509 | ATCA-ADFS J045205-525442 | 4:52:05.3 | -52:54:42.0 | 0.05 | 0.04 | 3.959 | 0.485 | 5.402 | 0.572 | 6.8 | 48.9 | |
| 510 | ATCA-ADFS J045205-525422 | 4:52:05.4 | -52:54:22.2 | 0.41 | 0.03 | 2.996 | 0.485 | 9.247 | 0.515 | 11.0 | 5.5 | -77.8 |
| 511 | ATCA-ADFS J045205-530208 | 4:52:05.8 | -53:02:09.0 | 0.00 | 0.00 | 2.563 | 0.283 | 1.913 | 0.289 | |||
| 512 | ATCA-ADFS J045205-534448 | 4:52:05.9 | -53:44:48.4 | 0.01 | 0.04 | 3.722 | 0.512 | 6.822 | 0.535 | 11.3 | 9.2 | |
| 513 | ATCA-ADFS J045205-533724 | 4:52:05.9 | -53:37:24.5 | 0.12 | 0.41 | 1.728 | 0.264 | 3.676 | 0.308 | 13.6 | -21.9 | |
| 514 | ATCA-ADFS J045206-534418 | 4:52:06.7 | -53:44:18.2 | 0.04 | 0.03 | 4.627 | 0.512 | 8.802 | 0.539 | 8.2 | 37.8 | |
| 515 | ATCA-ADFS J045206-534449 | 4:52:06.8 | -53:44:49.5 | 0.01 | 0.16 | 3.419 | 0.512 | 5.640 | 0.549 | 11.6 | 3.9 | |
| 516 | ATCA-ADFS J045206-533804 | 4:52:07.0 | -53:38:04.0 | 0.00 | 0.00 | 3.112 | 0.264 | 1.544 | 0.267 | |||
| 517 | ATCA-ADFS J045207-532938 | 4:52:07.3 | -53:29:38.5 | 0.39 | 0.03 | 1.101 | 0.194 | 2.354 | 0.223 | 12.0 | -88.5 | |
| 518 | ATCA-ADFS J045207-531730 | 4:52:07.5 | -53:17:30.1 | 0.00 | 0.00 | 5.073 | 0.168 | 18.320 | 0.209 | 10.7 | 7.2 | -57.9 |
| 519 | ATCA-ADFS J045208-534433 | 4:52:08.3 | -53:44:33.3 | 0.09 | 0.51 | 3.130 | 0.512 | 9.209 | 0.654 | 13.8 | -19.0 | |
| 520 | ATCA-ADFS J045208-531740 | 4:52:08.5 | -53:17:41.0 | 0.02 | 0.01 | 3.071 | 0.579 | 10.839 | 0.593 | 10.4 | 7.3 | -87.1 |
| 521 | ATCA-ADFS J045208-533736 | 4:52:08.6 | -53:37:36.8 | 0.03 | 0.02 | 1.982 | 0.264 | 3.515 | 0.274 | 7.8 | 38.9 | |
| 522 | ATCA-ADFS J045209-534512 | 4:52:09.4 | -53:45:12.3 | 2.19 | 4.54 | 7.233 | 0.512 | 4.924 | 0.540 | |||
| 523 | ATCA-ADFS J045209-534441 | 4:52:09.5 | -53:44:41.9 | 0.66 | 1.02 | 3.376 | 0.512 | 9.260 | 0.705 | 15.2 | 35.0 | |
| 524 | ATCA-ADFS J045227-530208 | 4:52:27.4 | -53:02:08.5 | 0.03 | 0.06 | 5.782 | 0.916 | 10.416 | 0.996 | 7.2 | -17.6 | |
| 525 | ATCA-ADFS J045227-534005 | 4:52:27.8 | -53:40:05.5 | 0.05 | 0.06 | 11.733 | 1.362 | 37.255 | 1.712 | 10.5 | 5.8 | -38.8 |
| 526 | ATCA-ADFS J045229-525651 | 4:52:29.8 | -52:56:51.2 | 0.10 | 0.07 | 8.503 | 1.502 | 18.082 | 1.666 | 7.7 | 4.0 | 57.5 |
| 527 | ATCA-ADFS J045232-530216 | 4:52:32.4 | -53:02:16.4 | 0.02 | 0.01 | 7.840 | 0.916 | 9.879 | 0.941 | |||
| 528 | ATCA-ADFS J045236-530120 | 4:52:36.7 | -53:01:20.2 | 0.00 | 0.00 | 9.904 | 0.916 | 11.882 | 0.920 | |||
| 529 | ATCA-ADFS J045239-530219 | 4:52:39.0 | -53:02:19.5 | 0.20 | 0.07 | 6.015 | 0.916 | 8.138 | 1.123 | 6.3 | 75.7 | |
| 530 | ATCA-ADFS J045240-531548 | 4:52:40.6 | -53:15:48.7 | 0.02 | 0.02 | 5.478 | 0.672 | 18.272 | 0.761 | 9.7 | 7.0 | 39.5 |