A Detailed Gravitational Lens Model Based on Submillimeter Array111Some of the data presented herein were obtained at the Submillimeter Array, which is a joint project between the Smithsonian Astrophysical Observatory and the Academia Sinica Institute of Astronomy and Astrophysics and is funded by the Smithsonian Institution and the Academia Sinica. and Keck222Some of the data presented herein were obtained at the W.M. Keck Observatory, which is operated as a scientific partnership among the California Institute of Technology, the University of California and the National Aeronautics and Space Administration. The Observatory was made possible by the generous financial support of the W. M. Keck Foundation. Adaptive Optics Imaging of a Herschel 333 Herschel is an ESA space observatory with science instruments provided by European-led Principal Investigator consortia and with important participation from NASA.-ATLAS Sub-millimeter Galaxy at z=4.243
Abstract
We present high-spatial resolution imaging obtained with the Submillimeter Array (SMA) at 880m and the Keck Adaptive Optics (AO) system at -band of a gravitationally lensed sub-millimeter galaxy (SMG) at discovered in the Herschel Astrophysical Terahertz Large Area Survey. The SMA data (angular resolution ) resolve the dust emission into multiple lensed images, while the Keck AO -band data (angular resolution ) resolve the lens into a pair of galaxies separated by . We present an optical spectrum of the foreground lens obtained with the Gemini-South telescope that provides a lens redshift of . We develop and apply a new lens modeling technique in the visibility plane that shows that the SMG is magnified by a factor of and has an intrinsic infrared (IR) luminosity of . We measure a half-light radius of the background source of kpc which implies an IR luminosity surface density of kpc−2, a value that is typical of SMGs but significantly lower than IR luminous galaxies at . The two lens galaxies are compact (kpc) early-types with Einstein radii of and that imply masses of and . The two lensing galaxies are likely about to undergo a dissipationless merger, and the mass and size of the resultant system should be similar to other early-type galaxies at . This work highlights the importance of high spatial resolution imaging in developing models of strongly lensed galaxies discovered by Herschel.
Subject headings:
galaxies: evolution — galaxies: fundamental parameters — galaxies: high-redshift1. Introduction
It has been known for over a decade that the star-formation rate density in the Universe peaked around redshifts (e.g., Madau et al. 1996; Lilly et al. 1996). More recently, the advent of bolometer arrays in the sub-millimeter (sub-mm) as well as the Spitzer Space Telescope, have established that the contribution of ultra-luminous infrared galaxies (ULIRGs) to the star-formation rate density in the Universe rises sharply with redshift out to (e.g., Blain et al. 1999; Chapman et al. 2005; Le Floc’h et al. 2005; Murphy et al. 2011; Magnelli et al. 2011). Although ULIRGs in the local Universe are known to be rare (Soifer et al. 1986) and have long been thought to arise from a major merger of two gas-rich disk galaxies (e.g., Armus et al. 1987; Murphy et al. 1996; Clements et al. 1996; Bushouse et al. 2002), their nature and role in galaxy evolution at high redshift is not yet well-understood.
The primary obstacle to studying ULIRGs at high-redshift has been one of identification (caused in large part by faintness at optical wavelengths). Surveys to identify ULIRGs have either been limited to small areas on the sky (e.g., the Sub-mm Common User Bolometer Array Half Degree Survey, SHADES; Coppin et al. 2006), low-spatial resolution imaging (e.g., the Balloon-borne Large Aperture Submillimeter Telescope; Pascale et al. 2008) or are sensitive to mid-infrared (mid-IR) radiation which is far from the peak of the spectral energy distribution (SED) of the ULIRG (e.g., Lonsdale et al. 2003). Each of these techniques produce samples of objects that are sufficiently faint at far-IR and sub-mm wavelengths that follow-up observations have been time-consuming and therefore limited to a modest number of objects, both in terms of determining redshifts (e.g., Chapman et al. 2005) and measuring important quantities such as accurate positions (e.g., Dannerbauer et al. 2002; Younger 2007), morphologies (e.g., Bussmann et al. 2009a; Swinbank et al. 2010; Bussmann et al. 2011), and gas and dust masses (e.g., Greve et al. 2005; Tacconi et al. 2006; Coppin et al. 2008; Tacconi et al. 2008; Bussmann et al. 2009b; Michałowski et al. 2010; Kovács et al. 2010; Ivison et al. 2011; Riechers et al. 2011).
This situation is now being remedied following the launch of the Herschel Space Observatory (Herschel ). With a large array of sensitive detectors at 70m, 100m, 160m, 250m, 350m, and 500m, the Photodetector Array Camera and Spectrometer (PACS; Poglitsch et al. 2010) and Spectral and Photometric Imaging Receiver (SPIRE; Griffin et al. 2010) on Herschel are well-suited to surveying large areas of the sky at wavelengths that are ideal for the detection of ULIRGs in the redshift range . The widest such survey is known as the Herschel Astrophysical Terahertz Large Area Survey (H-ATLAS; Eales et al. 2010) and covers 550 deg2 of sky as the largest open-time key project, reaching 5 sensitivities of 130 mJy at 100m, 120 mJy at 160m, 32 mJy at 250m, 36 mJy at 350m, and 45 mJy at 500m (Ibar et al. 2010; Pascale et al. 2011; Rigby et al. 2011).
The wide area coverage of H-ATLAS makes it ideal for building statistically significant samples of rare galaxies. One such example that has been particularly fruitful thus far is the selection of gravitationally lensed objects. These are systems where the light from a distant source (in this case, a ULIRG at ) is deflected by a foreground lens (typically an early type galaxy or group of galaxies) in such a way that the background ULIRG appears to have its angular size and brightness increased. Several authors have predicted that the sub-mm is an efficient waveband to identify lensing systems due to the steep number counts of galaxies selected at sub-mm and mm wavelengths (SMGs) (e.g., Blain 1996; Perrotta et al. 2002; Negrello et al. 2007). Additionally, the fact that most SMGs lie at (Chapman et al. 2005) increases the probability that an interloping galaxy will lie along the line-of-sight. Recently, Negrello et al. (2010) have shown that a selection at 500m of mJy sources within the 14.4 deg2 Science Demonstration Phase field of H-ATLAS identifies strongly lensed systems, low- spiral galaxies (Serjeant & Harrison 2005), and higher- active galactic nuclei (AGN) that are radio-bright and show a synchrotron emission spectrum even into the SPIRE bands (de Zotti et al. 2005). Shallow ground-based optical and radio imaging can be used to remove the latter two classes of objects, leaving only the strongly lensed systems.
The H-ATLAS source catalog already extends to deg2 (Phase 1 catalog; Dunne et al., in prep.). This paper focuses on one source of particular interest drawn from the Phase 1 catalog: H-ATLAS J142413.9+022304 (this object is denoted “ID 141” in Cox et al. 2011, hereafter, we refer to it as G15v2.779). SPIRE photometry of this source shows that it is one of the brightest detected so far in Herschel wide-field surveys and that its SED peaks at wavelengths greater than 500m, suggesting that it lies at . This source has been the target of significant follow-up efforts: the Plateau de Bure Interferometer (PdBI) has detected millimeter (mm) and sub-mm CO emission lines which imply that the redshift of this source is , while data from the Atacama Pathfinder Experiment (APEX) have shown that the dominant cooling line in this galaxy is [CII] emission (Cox et al. 2011). This makes this one of the few SMGs known at (Capak et al. 2008; Schinnerer et al. 2008; Coppin et al. 2009; Daddi et al. 2009a, b). In addition, a faint counterpart ( AB) is detected in both the Sloan Digital Sky Survey (SDSS DR7, York et al. 2000) and the United Kingdom Infrared Deep Sky Survey (UKIDSS, Lawrence et al. 2007) that has a photometric redshift of (Smith et al. 2011). Altogether, the evidence favors a scenario in which the background source is a SMG at high redshift that is being gravitationally lensed by an object at intermediate redshift, consistent with the lensing hypothesis of Negrello et al. (2007, 2010).
Recent observations by the Submillimeter Array (SMA) have shown an elongation along the southeast—northwest direction, possibly an indication of interesting morphological features on scales smaller than (Cox et al. 2011). In this paper, we present high-spatial resolution () SMA imaging at 880m, Keck Adaptive Optics (AO) -band imaging, and Gemini Multi-Object Spectrograph-South (GMOS-S) optical spectroscopy of this object and demonstrate their utility for constraining a detailed model of the lens-source system. We use the SMA, Keck, and Gemini data to probe the source size and magnification factor as well as the luminous plus dark matter mass of the lensing galaxies. The magnification factor is a critical parameter, since it is needed to understand intrinsic properties of the background SMG such as its IR luminosity (, integrated over 8-1000m) as well as molecular gas and dust masses ( and ). G15v2.779 is an example of a gravitationally lensed system discovered in H-ATLAS that permits the simultaneous study of obscured star-formation at high redshift as well as the nature of light and dark matter in galaxies at intermediate redshift.
When the H-ATLAS catalogs are complete, we expect to have candidate lensed systems. In addition, systems identified from the Herschel Multi-tiered Extragalactic Survey (HerMES; Oliver et al. 2010) could bring this total to 500 such objects discovered by Herschel. Recent efforts using near-IR imaging to push to fainter sub-mm flux densities and grow the list of candidates up to appear promising (González-Nuevo et al. 2012). Using similar selection techniques, the South Pole Telescope (SPT) has identified a sample of candidate lensed SMGs within the initial 87 deg2 survey (Vieira et al. 2010). The final survey area will cover 2000 deg2 and is expected to provide a sample of lensed SMGs. Due to the selection at 1.4mm, the SPT sample of lensed SMGs will be complementary to the Herschel sample in the sense that it will be biased towards higher redshift or cooler dust temperatures. Together, both the Herschel and SPT samples offer the opportunity to expand upon the legacy of work on strongly lensed galaxies over a similar redshift range undertaken as part of the Center for Astrophysics Arizona Space Telescope Lens Survey (CASTLeS; Muñoz et al. 1998), the Cosmic Lens All-Sky Survey (CLASS; Myers et al. 2003; Browne et al. 2003), and the Jodrell Bank Very Large Array gravitational lens survey (JVAS; King & Browne 1996) by increasing the sample size of such systems by 1-2 orders of magnitude. In comparison to lensed systems selected via optical spectroscopy (e.g., the Sloan Lens Advanced Camera for Surveys or SLACS and the Baryon Acoustic Oscillation Survey Emission-Line Lensing Survey or BELLS; Bolton et al. 2008; Brownstein et al. 2012), the (sub-)mm selection is highly complementary in that it identifies (1) lensed galaxies that are both more luminous and at higher redshift; and (2) lensing galaxies that span a wider range in optical brightness (in particular, they do not need to be bright enough to be detected in SDSS-III spectroscopy).
Throughout this paper we assume 71 km s-1 Mpc-1, , and . At , this results in a scaling of 6.9 kpc arcsec-1.
2. Observations
2.1. SMA Data
SMA imaging data of G15v2.779 was initially obtained as a short observation conducted in the compact array configuration on 2010 June 16 ( hrs on-source integration time, see Cox et al. 2011). These data yielded a robust detection of the target and provided a total flux density measurement at 880m of mJy. The data also pinpointed the location of the Herschel source: RA 14:24:13.98, Dec +02:23:03.45 (J2000.0) and with a beamsize of 2 hinted at an elongation in the northwest—southeast direction ( degrees east of north; Cox et al. 2011).
Subsequent data in the very extended array configuration were obtained on 2011 January 4 and 6 ( hrs in total, max baseline length of 475 m). Extended array configuration data were obtained to improve uv coverage on 2011 January 28 ( hrs, max baseline length of 226 m). Atmospheric opacity was low () and phase stability was good (phase errors less than 30∘).
We optimized the SMA single-polarization 345 GHz receivers for continuum detection by tuning the primary local oscillator to 339.58 GHz and an intermediate frequency coverage of 4–8 GHz, providing a total of 8 GHz bandwidth (considering both sidebands). The observations did not cover the nearest CO emission line, CO() at about 351 GHz since that frequency is near the high end of the range of the SMA 345 GHz receivers and would have compromised the sensitivity of our continuum observations.
We used the Interactive Data Language (IDL) MIR package to calibrate the uv visibilities. The blazar 3C279 was used as the primary bandpass calibrator while Titan was used as the absolute flux calibrator. The nearby quasars 1337129 (Jy, 19 degrees from target) and 1512090 (Jy, 17 degrees from target) were used for phase gain calibration. The quasar 1458+042 (Jy, 9 degrees from target) was observed to provide an independent check of the reliability of the calibration, particularly phase transfer.
For imaging, we used the Multichannel Image Reconstruction, Image Analysis, and Display (MIRIAD) software package (Sault et al. 1995) with natural weighting for maximum sensitivity. This resulted in an elliptical gaussian beam with a full-width half-maximum (FWHM) of and position angle of 62.4 degrees east of north.
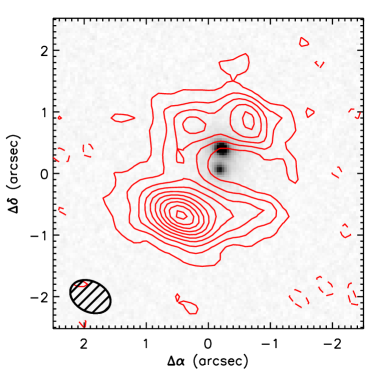
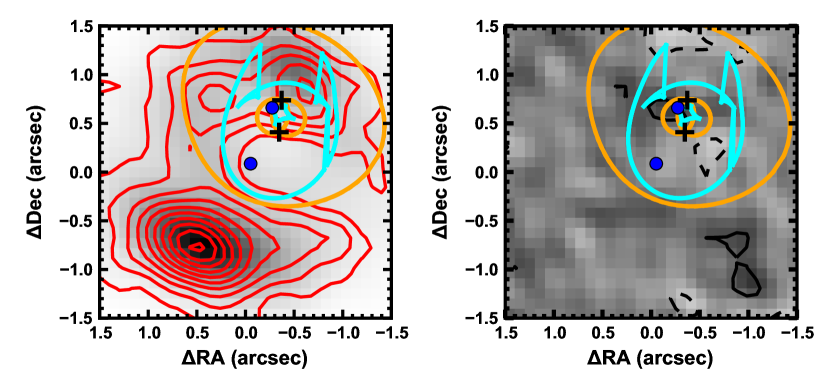
Figure 1 shows the SMA image of this source (combining compact, extended and very extended array configurations) in red contours. The sub-mm emission is resolved into two bright emission regions to the southeast and northwest of the lensing galaxies. These emission regions have peak intensities of mJy beam-1 and mJy beam-1, respectively (quoted 1 uncertainties do not include the estimated absolute calibration uncertainty of 10%). The peaks are located at positions of (RA=14:24:14.006, Dec=+02:23:02.81) and (RA=14:24:13.938, Dec=+02:23:04.40), respectively (the uncertainty in the relative position of these peaks is ). In addition, there is a background of complex substructure that, together with the two bright emission regions, sums to a total flux density of mJy and is likely to be produced by gravitational lensing.
2.2. Keck Adaptive Optics Data
We obtained a 1920 sec -band image of G15v2.779 on 2011 April 13 (UT) as part of program ID C213N2L (PI: H. Fu; e.g., Fu et al. 2012) with the Keck II laser guide-star adaptive-optics system (LGSAO; Wizinowich et al. 2006). An magnitude star 26 south of G15v2.779 served as the tip-tilt reference star. The expected Strehl ratio is about 0.17 at the source position. We used the second generation near-infrared camera (NIRC2444http://www2.keck.hawaii.edu/inst/nirc2/Manual/ObserversManual.html) at pixel-1 scale and executed a nine-point dithering pattern with 3 dithering steps. Three 80 sec exposures were obtained at each dithering position. The natural seeing was about .
We used our own IDL program to reduce the images. After dark subtraction and flat-fielding, sky background and object masks were updated iteratively. For each frame, after subtracting a scaled median sky, the residual background was removed with B-spline models. In the last iteration, we discarded the three frames of the poorest image quality and corrected the NIRC2 geometric distortion using the solution of P. B. Cameron555http://www2.keck.hawaii.edu/inst/nirc2/forReDoc/post_observing/dewarp/ before combining the aligned frames. The resolution of the final image is in FWHM, as measured from the stellar source northwest of G15v2.779. Astrometry was determined from SDSS photometric sources inside the 40 field of view and carries 1 uncertainties in an absolute sense of (in fact, we show in section 3 that the tightest constraints on the astrometry are derived directly from the lens modeling). The flux scale in the image was normalized such that the total flux of the two lensing galaxies matches that seen in the UKIDSS -band data, where the two galaxies have a total magnitude of .
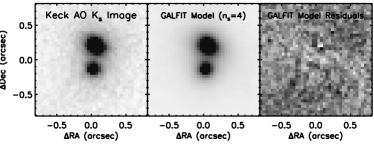
The grayscale of Figure 1 shows the Keck AO -band image of G15v2.779. The backgound SMG is undetected, while the two foreground lensing galaxies are detected at high significance. The AO imaging indicates the secondary lens galaxy is located 0025 east and 0327 south of the primary. A Galfit decomposition of the two sources seen in the Keck image into Sérsic components indicates that a de Vaucouleurs profile is appropriate for both the northern and southern galaxies. In fact, the best-fit models have , but this is probably due to faint, large-scale fluctuations in the background sky level – hereafter, we assume for both galaxies for simplicity. Figure 2 shows the best-fit Galfit model and the residuals after subtracting the model from the data. Table 1 contains the best-fit parameters from the Galfit modeling and their 1 uncertainties. These are underestimates of the true errors as they do not account for degeneracies between the parameters. The two lensing galaxies are highly compact, with effective radii of kpc and kpc. The northern galaxy has (Vega mag) and the southern galaxy has (Vega mag).
The background source is not detected inside a radius, implying a 5 limit of (Vega mag). This corresponds to a flux density 5 limit of Jy. This level of faintness in the near-IR is frequently an indication of systems (e.g. Dannerbauer et al. 2002; Daddi et al. 2009a). If differential magnification effects are insignificant (i.e., ), then this implies a 500m to -band flux density ratio of . At , this corresponds roughly to rest-frame 100m to -band. An interesting comparison example is Mrk 231, a heavily obscured ULIRG in the local universe that has a 100m to -band flux density ratio of . This value is about a factor of 3-4 lower than G15v2.779, suggesting that the obscuration in G15v2.779 is extreme. In section 4.1, we will compare the obscuration in G15v2.779 with other SMGs.
| Lens 1 | Lens 2 | |
|---|---|---|
| (Vega) | ||
| bbSérsic indices are fixed to be (see text for details). | 4 | 4 |
| (kpc) | ||
| (deg) | ||
2.3. Gemini GMOS-S Optical Spectroscopy
Long-slit spectroscopic observations of G15v2.779 were taken using the Gemini GMOS-South instrument on the night of 2011 March 6, under photometric conditions as part of programme GS-2011A-Q-57 (PI: D. J. B. Smith). Two observations of 1800 seconds each were made through a 2 slit, using the R400 grating and the OG515 blocking filter, with dithering both in the wavelength direction and along the slit to minimize the effects of bad columns and gaps between the GMOS-S chips. The central wavelengths for the two observations were 630 and 635 nm, and flat field observations were interspersed between the observations at each wavelength setting, as recommended by the Gemini observatory. CuAr arc lamp exposures were taken for the purposes of wavelength calibration, using the same instrumental setup as for the science exposures, and the spectral resolution obtained was 6.0Å. A position angle of 330∘ East of North was chosen to place the slit along the major axis of the extension seen in the SMA and PdBI observations, and the CCD was binned by 4 pixels in both the spectral and spatial directions. The long-slit data were reduced using the IRAF Gemini GMOS reduction routines, and following the standard GMOS-S reduction steps in the example taken from the Gemini observatory webpages. Since the primary aim of these observations was to obtain a spectroscopic redshift and measure of the Balmer/4000 Å break for the lensing source (or sources), flux calibration was not performed.
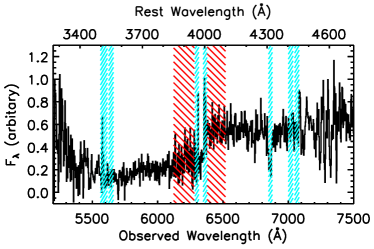
Figure 3 shows the optical spectrum of G15v2.779 obtained with Gemini GMOS-S. Because the slit width is 2, both lensing galaxies are included in this spectrum. A strong break at observed-frame 6350 Å is obvious in the spectrum. Two narrow emission lines on either side of this break coincide with atmospheric features and are likely not produced by astronomical sources. The break in the spectrum likely corresponds to a Balmer/4000 Å break and suggests that both lensing galaxies are at (the redshift and error were estimated using a by-eye comparison of the observed spectrum with a synthesized simple stellar population with solar metallicity and an age of 5 Gyr; Bruzual & Charlot 2003). We note that without spatially resolved spectroscopy it is not possible to confirm that both lensing galaxies are located at the same redshift. The ratio of the flux density longward and shortward of the break is known as the value and is a measure of the average age of the stars within the galaxies. We use the definition from Kauffmann et al. (2003) and measure (we adjust the wavelength window longward of the break to avoid the portion of the spectrum affected by atmospheric emission lines). This value is typical of galaxies dominated by old stellar populations (5-10 Gyr, depending on metallicity; Kauffmann et al. 2003).
3. A Detailed Lens Model
The combination of good sensitivity and high spatial resolution provided by the SMA and Keck AO data (probing the emission from the lensed and lensing galaxies, respectively) permits a detailed study of the parameters of the lensing model that describe this system. The lensed emission is detected only in the SMA data. Since the SMA is an interferometer, the surface brightness map of the lensed emission is obtained with incomplete uv coverage, implying that surface brightness is not necessarily conserved and that the pixel-to-pixel errors in the map are correlated. Furthermore, the lensed emission observed by the SMA comprises multiple, resolved components. For these reasons, it is important to compare model and data in the visibility plane rather than the image plane.
We make use of the publicly available Gravlens software (Keeton 2001) to map emission in the source plane to the image plane for a given lensing mass distribution. Using this software, a model of the lensed emission is constructed based on the density profile of the lens – assumed here to be two singular isothermal ellipsoids (one for each galaxy seen in the Keck AO imaging), the morphology of the source – taken here to be a Sérsic profile, and the position of the source relative to the lens. Although the Sérsic profile represents a crude simplification of the true background source morphology, we use it here because it permits a test of the variation in the lensing properties (e.g., magnification of the background source) as a function of variation in the nature of the source (e.g., half-light radius). Later in this section, we discuss how our best-fit parameters change when a second source is added to the source plane.
The Gravlens lens model (with a single source in the source plane) contains 15 free parameters: the position of the source relative to the SMA 880m emission centroid ( and ), the intrinsic flux of the source (), the half-light radius of the source (), the Sérsic index of the source (), the ellipticity (defined as ) and position angle of the source ( and ), the position of the primary lens relative to the SMA emission centroid ( and ), the mass of the primary lens (parameterized in terms of the angular Einstein radius, ), the ellipticity and position angle of the primary lens ( and ), and the Einstein radius, ellipticity, and position angle of the secondary lens (, , and ).
The 1- absolute astrometric accuracy between the SMA and Keck images is , so in our modeling efforts we allow the position of the lens to vary by as much as in both RA and Dec (i.e., 2 in each direction). In fact, the constraints from the lens model are significantly tighter than , as we show below.
We make use of the Keck AO -band data and fix the position of the secondary lens relative to the primary at and (rotational astrometric uncertainties between the SMA and Keck AO images are sub-dominant to translational uncertainties). Furthermore, we use our GALFIT results and constrain the ellipticity and position angle of the lenses to be within 3 of the best-fit Galfit values (as given in Table 1. We tested models in which the mass of each foreground lensing galaxy was allowed to vary as well as models in which the mass of the secondary lens was fixed to be equal to one-half that of the primary lens. This latter choice assumes that both lens galaxies are located at the same redshift and is supported by the ground-based Gemini GMOS-S spectrum of G15v2.779 (see section 2.3). High-spatial resolution optical or near-IR spectroscopy are needed to resolve the two lensing galaxies and provide a definitive test of the validity of our assumptions.
For a given set of model parameters, Gravlens generates a surface brightness map of the lensed emission. This surface brightness map can then be used as input to MIRIAD’s uvmodel task, which computes the Fourier transform of the image and samples the resulting visibilities in a way that matches the sampling of the actual observed SMA visibility dataset () to produce a “simulated visibility” dataset (). The quality of fit for a given set of model parameters is determined from the chi-squared value () according to the following equation:
| (1) |
where is the 1 uncertainty level for each visibility and is determined from the system temperatures (this corresponds to a natural weighting scheme). Because the measured visibilities are complex, we compute both and and measure the total as the sum of the real and imaginary components.
We employ a Markov chain Monte Carlo (MCMC) technique to sample the posterior probability density function (PDF) of our model parameters. In particular, we use the emcee code (Foreman-Mackey et al. 2012) to implement the MCMC analysis. The algorithm adopted by emcee was originally presented in Goodman & Weare (2010) and uses an affine-invariant ensemble sampler to obtain significant performance advantages over standard MCMC sampling methods.
Here, we summarize the behavior of the ensemble sampler technique. The available parameter space is searched using a set of walkers. During iterations of the MCMC, each walker selects another walker from the ensemble and identifies a new position in parameter space based on the positions of both walkers (this is known as a “stretch move”). Once a new position has been found, the posterior PDF is computed and compared to that of the previous position. New positions with higher probability (i.e., lower ) are always accepted; those with lower probability are sometimes accepted. After a sufficient number of iterations (), the ensemble of walkers samples the parameter space in a way that reflects the posterior PDF. The mean and variance of each parameter can then be measured directly from the history of walker positions. We employ a “burn-in” phase with and (i.e., 50,000 samplings of the posterior PDF) that is used to identify the best-fit model position. This position is then used to initialize the “final” phase with and (i.e., 10,000 samplings of the posterior PDF). To ensure that the posterior PDF was sampled with a sufficient number of iterations, we computed the autocorrelation time for each parameter in a given ensemble of walkers and found that it was of order unity for each parameter. This implies that we have 10,000 independent samplings of the posterior PDF, more than enough to obtain a robust measurement of the mean and uncertainty on each parameter of the model.
During each MCMC iteration, we also measure the magnification factor (we follow the nomenclature in the SMG literature here and use to refer to the total magnification obtained by summing over all individual lensed components) using the following method. First, we take the unlensed, intrinsic source model and measure the total flux density () within an elliptical aperture () centered on the source with ellipticity and position angle equal to that of the source model and with a semi-major axis length of . Next, we take the lensed image of the best-fit model and measure the total flux density () within the aperture , where is determined by using Gravlens to map in the source plane to in the image plane (using the lens parameters which correspond to the best-fit model). The magnification is then computed simply as . The best-fit value and 1 uncertainty are drawn from the posterior PDF as with the other parameters of the model.
The best-fit model (assuming a fixed mass ratio between the primary and secondary lens) produced by Gravlens is shown in Figure 4 and demonstrates that many of the features present in the SMA imaging can be reproduced in detail by Gravlens. The panel on the left shows the SMA imaging overlaid on the inverted, deconvolved map of the best-fit model visibilities. The panel on the right shows the residual image obtained by inverting and deconvolving the residual visibilities (i.e., the cleaned map of the difference between the model and data visibilities). The model fits the two brightest components in the SMA image (the peaks to the southeast and northwest), but fails to reproduce fully the peaks in the map to the northeast and southwest.
We measure the following parameters of interest from the model: , , , , (this position is within 1 of the position indicated from the Keck AO astrometry), , , , kpc, , and degrees east of north. The best-fit model has and 144191 degrees of freedom. These constraints on model parameters are reported in Table 2.
Also reported in Table 2 are the results obtained when the mass of the secondary is allowed to vary relative to the primary. The uncertainties on the mass of each individual lensing galaxy are significantly larger in this case because our lens model constrains the sum of the masses of the two lensing galaxies. The constraint on the sum of the masses is (consistent with the results from models where the mass ratio has been fixed). The Gemini GMOS-S optical spectrum provides evidence that the two lensing galaxies are both . Under that assumption, the secondary is significantly less luminous and hence likely to be significantly less massive. Therefore, for the remainder of the paper we have assumed a 2:1 mass ratio between the primary and secondary. Spatially resolved spectroscopy of the lensing galaxies is needed to prove the validity of this assumption.
| Single-source | Single-source | Two-source | |
|---|---|---|---|
| free | fixed | fixed | |
| () | |||
| () | |||
| (kpc) | |||
| (deg) | |||
| () | — | — | |
| () | — | — | |
| (kpc) | — | — | |
| — | — | 0.5aa Sérsic index of secondary source is fixed at . See section 3 for details. | |
| — | — | ||
| (deg) | — | — | |
| () | |||
| () | |||
| () | |||
| () | |||
| 217796.9 | 217799.1 | 217769.2 | |
| 144190 | 144191 | 144185 | |
The residual map in Figure 4 shows that our single-source model fails to account for the secondary peaks in the map to the northeast and southwest as well as a faint ring of emission partially lined up with the tangential critical curve. We investigated whether adding an additional source in the source plane near the tangential caustic would improve the ability of the model to match these secondary peaks. The new model has six new parameters: the flux of the second source (), the position of the second source relative to the SMA emission centroid ( and , constrained to be within of the tangential caustic), half-light radius of the second source (), the ellipticity of the second source (), and the position angle of the second source (). Initial tests of the two-source model showed that the fitting routine struggled to identify the best-fit model consistently unless the Sérsic index of the second source was fixed at (i.e., a Gaussian profile), so that is what we have adopted here.
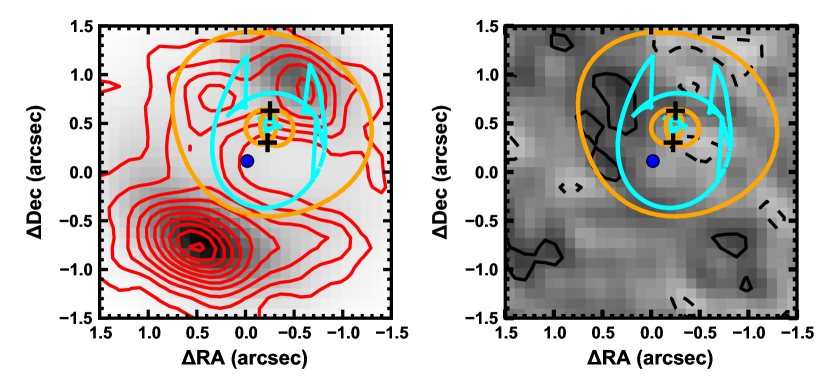
Figure 5 shows the results obtained with the two-source model and Table 2 contains the best-fit model parameters and their 1 uncertainties. The best-fit model has and 144185 degrees of freedom. The magnification factor is , and the Einstein radii of the two lenses are and , values that are very similar to those obtained with the single-source model. These are the parameters of greatest interest, so it is reassuring that they are relatively insensitive to the exact morphology of the background source.
The position of the primary background source is also relatively robust between the two models we have tested, with (, ) relative to the SMA emission centroid. The secondary source is less well-constrained, having a position of , . This position places the secondary source near a caustic, implying that it has experienced a high degree of magnification and has a much lower intrinsic luminosity than the primary source. The primary source maintains a broad profile intermediate between a disk and an elliptical, while the second source is compact ( kpc). In both the single-source and two-source models, the best-fit residual maps show emission to the southwest in the SMA data that the model fails to reproduce. This could be an indication of the presence of a third source in the source plane, but an examination at that level is beyond the scope of this paper. Overall, the agreement between the single-source and two-source model results is encouraging. For the remainder of the paper, we use the results from our single-source model, since it provides nearly as good a fit to the data as the two-source model () but requires six fewer free parameters. Our major conclusions are insensitive to whether the single-source or two-source model is used.
It is interesting that the magnification factor we have measured is somewhat lower than might be expected based on the velocity dispersion and observed luminosity of CO emission lines in G15v2.779. Studies of CO() emission lines in both lensed and unlensed SMGs have found a correlation between the intrinsic (i.e., unlensed) CO() line luminosity and the FWHM of the emission line (Harris et al., submitted; Bothwell et al., in prep.). While CO() data are not yet available for G15v2.779, higher lines have indicated FWHMkm s-1 and km spc2. According to the correlation identified in the previous studies, this FWHM value would imply an (unlensed) line luminosity of km spc2. However, assuming a typical sub-thermal CO() to CO() conversion factor (e.g., Harris et al., in submitted.), our measurement of would indicate km spc2. Possible explanations for this include either an unusual CO()/CO() ratio, a large intrinsic scatter in the luminosity line-width relations in these systems, or a difference in the size-scale of the CO() and the far-IR emitting regions, leading to not being equal to .
4. The Nature of G15v2.779
In this section, we discuss the implications of our results for the nature of G15v2.779. We begin with a focus on the background source and end with the foreground lens properties.
4.1. The Background Source: An optically-obscured SMG at
The magnification factor of the background source is a parameter that is critical to the derivation of any intrinsic property of the source. The properties that we consider here are the total IR luminosity (), the SFR, the projected IR luminosity surface density (), the dust mass (), and the molecular hydrogen gas mass (). We compute as the integral under the full SED as reported in Cox et al. (2011), divided by . Differential magnification effects are an important consideration when computing . Initial studies indicate that when the magnification factor at any given wavelength is modest (), then differential magnification effects are expected to have a minimal influence on the inferred IR luminosity (Serjeant 2012). The contribution from the lensing galaxies to is likely to be minimal, given that they are both early-type galaxies at . We find an intrinsic IR luminosity of , a value that likely makes G15v2.779 one of the intrinsically brightest known SMGs (with an intrinsic, un-lensed sub-mm flux density of mJy).
Using the standard conversion from to SFR (Kennicutt 1998), this corresponds to a SFR of yr-1. This value assumes that all of the IR luminosity originates from star-formation rather than AGN. Hence this value should be regarded as an upper limit on the true SFR, although it should be noted that measurements of the radio luminosity suggest a far-IR to radio flux ratio that is consistent with starburst dominated galaxies (Cox et al. 2011).
The Sérsic index of the background source () is intermediate between an exponential disk profile () and a De Vaucouleurs () profile. The source is significantly extended, having a half-light radius of kpc. This implies a de-projected IR luminosity surface density (computed as , where ) of kpc-2. This range of values for places G15v2.779 within the “normal star-forming” class of galaxies at and is significantly below that of local ULIRGs (which have values in the range kpc-2; Rujopakarn et al. 2011). This may be a clue that unlike local ULIRGs, the intense, dust-enshrouded burst of star-formation that is occurring in G15v2.779 may not be driven by a major merger.
To compute the apparent (i.e., un-corrected for lensing) dust mass, Cox et al. (2011) perform a single-temperature, optically thin, modified black-body fit to the far-IR and sub-mm SED of G15v2.779 (following Beelen et al. 2006). These authors find a dust mass of , using the best-fit dust temperature of K and a mass absorption coefficient of cmg-1. If instead an optically thick modified black-body is used to fit the data, the inferred dust mass decreases by nearly a factor of 2 (Weiß et al. 2007). Our measurement of implies dust masses (using the values reported in Cox et al. 2011). The uncertainty in the dust mass is dominated by systematic uncertainties related to the unknown optical depth at far-IR wavelengths and the unconstrained mass opacity coefficient and is at least a factor of a few. The measured dust mass is similar (though at the top end) to those estimated for other high- SMGs (Santini et al. 2010) and also for the most massive galaxies in H-ATLAS (Dunne et al. 2011).
To quantify the interstellar medium properties in this object, Cox et al. (2011) use a spherical, single-component, large velocity gradient (LVG) model (Weiß et al. 2007) to fit simultaneously the CO(), CO(), and CO() emission lines. Assuming a conversion factor of K km spc to go from to , Cox et al. (2011) find gas masses of . Using our measurement of , we find . Note that there is some evidence that may be higher for less dense systems at high- relative to local ULIRGS (Frayer et al. 2011; Ivison et al. 2011). If this is indeed the case, then the gas mass would be even larger. Given the large dust mass (even with the optically thick fit), this is not unreasonable.
This gas mass is a factor of larger than the typical gas mass found in un-lensed SMGs (Greve et al. 2005), 2.5-9 times larger than two lensed sources discovered in the H-ATLAS SDP (Frayer et al. 2011), and a factor of larger than a lensed source from HerMES (Scott et al. 2011). G15v2.779 appears to be a very massive, highly star-forming galaxy at .
Table 3 summarizes the properties of G15v2.779 and compares them with unlensed SMGs at . G15v2.779 bears a close resemblence to GN20, having similar , , , , , and values. However, there is an important difference: GN20 is much more luminous in the rest-frame optical than G15v2.779. In terms of visual extinction (), G15v2.779 is most similar to GN10, which has . However, GN10 is less luminous and has only an upper limit on its source size. The fact that G15v2.779 is clearly extended on scales kpc and yet maintains a covering fraction near unity indicates an impressive quantity of dust, consistent with the dust mass measurements described above.
One feature all of these SMGs share in common is values that are 1-2 orders of magnitude lower than those of ULIRGs in the local Universe. This may be an indication that the physical mechanisms driving the prodigious luminosities in these systems may be different from what occurs at . Theories attempting to explain the behavior of these systems must also account for the short gas depletion timescales (possibly via strong inflow of gas from the inter-galactic medium; e.g. Schaye et al. 2010), as the estimated SFRs will consume all of the available gas within Myr in all of these galaxies.
| SFR | ||||||||||
|---|---|---|---|---|---|---|---|---|---|---|
| () | (yr-1) | () | () | (km s-1) | (kpc) | () | (kpc-2) | |||
| G15v2.779 | lowff880m size kpcggRadio to IR luminosity ratio consistent with star-formation dominated galaxies | — | ||||||||
| GN10aaDaddi et al. (2009a) | lowggRadio to IR luminosity ratio consistent with star-formation dominated galaxies | |||||||||
| GN20bbDaddi et al. (2009b); Carilli et al. (2011) | lowggRadio to IR luminosity ratio consistent with star-formation dominated galaxies | |||||||||
| GN20.2abbDaddi et al. (2009b); Carilli et al. (2011) | lowggRadio to IR luminosity ratio consistent with star-formation dominated galaxies | |||||||||
| J1000+0234ccCapak et al. (2008); Schinnerer et al. (2008) | lowggRadio to IR luminosity ratio consistent with star-formation dominated galaxies | |||||||||
| J033229.4ddCoppin et al. (2009, 2010) | lowhhWeak NV, 24m, and near-UV emission inconsistent with AGN | |||||||||
| AzTEC-3eeRiechers et al. (2010) | lowggRadio to IR luminosity ratio consistent with star-formation dominated galaxies | |||||||||
4.2. The Foreground Lenses: A Dry Merger at
We use the standard equations from Schneider et al. (1992) to compute the mass of the lens galaxies , finding (recall that we have assumed ). Independent mass estimates can be obtained using the correlation between -band luminosity and given in Negrello et al. (2010). At , the observed -band corresponds almost exactly to the rest-frame -band. The ground-based -band magnitude of the two lenses together is (Cox et al. 2011), corresponding to a rest-frame -band luminosity of . Assuming the rest-frame -band luminosity ratio between the two lens galaxies is the same as that in the observed -band, the correlation observed from the SLACS lenses (Bolton et al. 2008; Negrello et al. 2010) implies lens masses of and , consistent with our lens model estimates of and . An alternative estimate of the lens masses is to use the -band luminosities along with a mass-to-light ratio derived from synthesized stellar populations. The optical spectrum of G15v2.779 shows a strong Balmer/4000 Å break (), typical of galaxies dominated by old stellar populations (5-10 Gyr, depending on metallicity; Kauffmann et al. 2003). A synthesized stellar population with an age of 5 Gyr, a Chabrier IMF, and no dust extinction has a mass-to-light ratio of . Thus, the inferred stellar masses of the two lensing galaxies are and . There is evidence at the 1.5 level that the lens and mass estimates are greater than the stellar mass estimates. This may be reasonable considering the small stellar sizes (half-light radii of kpc) relative to the Einstein radius of each system ( kpc).
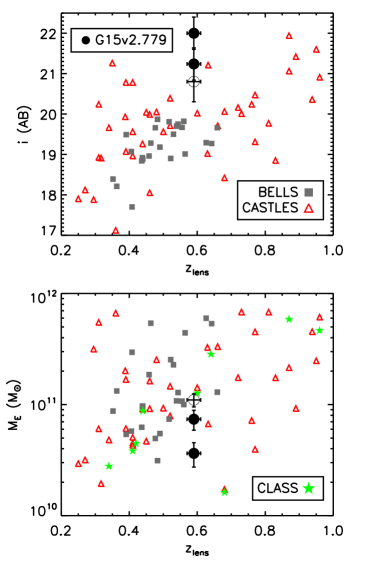
Figure 6 shows that G15v2.779 has two of the faintest (in -band) and lowest mass (at this redshift) lensing galaxies found in current surveys of gravitationally lensed systems (e.g., CASTLeS, CLASS, SLACS, and BELLS; Muñoz et al. 1998; Myers et al. 2003; Bolton et al. 2008; Brownstein et al. 2012). This is an indication that wide-field surveys with Herschel will be useful for identifying lensing systems where the lensing galaxy is faint in the optical, either due to being low-mass or being very distant. This is generally true for source-selected lensing surveys (e.g., CLASS, H-ATLAS, and a portion of CASTLeS), whereas lens-selected lensing surveys (e.g., SLACS and BELLS) tend to be biased towards brighter and more massive foreground galaxies.
Both G15v2.779 lens galaxies have early-type morphologies with small half-light radii ( kpc). Such systems appear to be commonplace at , but become increasingly rare at lower redshifts (e.g., Damjanov et al. 2009). However, given the small separation between the two lensing galaxies ( kpc), it is likely that they are about to merge together (dissipationless mergers often do not have obvious signs of interaction even at these separations; e.g., see Bell et al. 2006). Simple virial arguments suggest that this process could lead to a doubling of the radius while the mass only increases by 50% (Naab et al. 2009). Such a result would make the size of the merged system consistent with similarly massive galaxies at (e.g., Oser et al. 2012) as well as more typical of lensing galaxies found in CASTLES, CLASS, SLACS, and BELLS. Overall, these observations are consistent with the dissipationless (“dry”) merging stage of the two-phase galaxy evolution scenario outlined in Oser et al. (2010). In this picture, the progenitors of massive galaxies undergo intense in-situ star-formation from to that leads to compact, elliptical galaxies with little or no reservoirs of gas for future star-formation. From to the present-day, massive galaxies undergo dry merging and increase their sizes such that they evolve onto the mass-size relation observed in local early-type galaxies.
5. Conclusions
We use high-spatial resolution imaging obtained with the SMA at 880m and Keck AO at -band to perform a detailed gravitational lens modeling of G15v2.779, an SMG at identified by Herschel in the H-ATLAS survey. We present a Gemini GMOS-S optical spectrum of G15v2.779 that suggests that the two foreground galaxies are at . This analysis provides important measurements of the nature of both the background SMG and the foreground lenses. We summarize our findings below.
We employ a visibility-plane lens modeling analysis and find a magnification factor of for the background source. This measurement is significantly lower than what had been previously assumed for this source and indicates that not all of the brightest lens candidates identified by Herschel have high magnification factors. This value of implies an intrinsic infrared luminosity of .
The best-fit model for the background source favors radial profiles that are intermediate between exponential disks and De Vaucouleurs. The half-light radius of the background source is kpc. This size measurement implies a de-projected IR luminosity surface density of kpc-2. This number is typical of ULIRGs and HyLIRGs but 10-100 times lower than ULIRGs in the local Universe. This may be an indication that the formation mechanism for this source could be different from ULIRGs, which are thought to arise from major mergers of gas-rich disk galaxies. Higher-spatial resolution data with improved sensitivity are needed to favor one of these models over the other.
Our measurement of , in conjunction with previous observations of CO emission lines and the far-IR SED, indicates a gas mass of and a dust mass of . These values are factors of 2.5-9 times larger than other lensed galaxies studied to date but are comparable to other SMGs. They indicate that G15v2.779 hosts a massive reservoir of molecular gas that is fueling a prodigious, but likely short-lived ( Myr) period of star-formation.
The foreground lenses have Einstein radii of and . These imply lens masses of and . The lensing galaxies have sizes of kpc and lie at a redshift of . The gravitational potential from both galaxies may include a significant contribution from dark matter. They are separated by 2 kpc and will likely merge into a single early-type galaxy with a larger size that will make the resultant system consistent with other early-types at .
Together, the SMA, Keck, and Gemini data have established that G15v2.779 is a SMG at modestly lensed by a pair of early-type galaxies at . Our results highlight the bounty of information that can be obtained via a multi-wavelength approach to studying strongly lensed SMGs at high redshift. More sensitive and higher-spatial resolution imaging of the lensed emission is needed to improve the constraints on the parameters of the gravitational lensing model and test competing models for the powering mechanism in this source (e.g., major merger vs. secular processes). This will become feasible in the near future when baseline lengths of km become available with ALMA. HST spectroscopy is needed to confirm that the lensing galaxies both lie at , to measure their velocity dispersions, and to improve their stellar mass estimates.
References
- Armus et al. (1987) Armus, L., Heckman, T., & Miley, G. 1987, AJ, 94, 831
- Beelen et al. (2006) Beelen, A., Cox, P., Benford, D. J., Dowell, C. D., Kovács, A., Bertoldi, F., Omont, A., & Carilli, C. L. 2006, ApJ, 642, 694
- Bell et al. (2006) Bell, E. F. et al. 2006, ApJ, 640, 241
- Blain (1996) Blain, A. W. 1996, MNRAS, 283, 1340
- Blain et al. (1999) Blain, A. W., Smail, I., Ivison, R. J., & Kneib, J.-P. 1999, MNRAS, 302, 632
- Bolton et al. (2008) Bolton, A. S., Burles, S., Koopmans, L. V. E., Treu, T., Gavazzi, R., Moustakas, L. A., Wayth, R., & Schlegel, D. J. 2008, ApJ, 682, 964
- Browne et al. (2003) Browne, I. W. A. et al. 2003, MNRAS, 341, 13
- Brownstein et al. (2012) Brownstein, J. R. et al. 2012, ApJ, 744, 41
- Bruzual & Charlot (2003) Bruzual, G. & Charlot, S. 2003, MNRAS, 344, 1000
- Bushouse et al. (2002) Bushouse, H. A. et al. 2002, ApJS, 138, 1
- Bussmann et al. (2009a) Bussmann, R. S. et al. 2009a, ApJ, 693, 750
- Bussmann et al. (2009b) —. 2009b, ApJ, 705, 184
- Bussmann et al. (2011) —. 2011, ApJ, 733, 21
- Capak et al. (2008) Capak, P. et al. 2008, ApJ, 681, L53
- Carilli et al. (2011) Carilli, C. L., Hodge, J., Walter, F., Riechers, D., Daddi, E., Dannerbauer, H., & Morrison, G. E. 2011, ApJ, 739, L33
- Chapman et al. (2005) Chapman, S. C., Blain, A. W., Smail, I., & Ivison, R. J. 2005, ApJ, 622, 772
- Clements et al. (1996) Clements, D. L., Sutherland, W. J., McMahon, R. G., & Saunders, W. 1996, MNRAS, 279, 477
- Coppin et al. (2006) Coppin, K. E. K. et al. 2006, MNRAS, 372, 1621
- Coppin et al. (2008) —. 2008, MNRAS, 384, 1597
- Coppin et al. (2009) Coppin, K. E. K. et al. 2009, MNRAS, 395, 1905
- Coppin et al. (2010) —. 2010, MNRAS, 407, L103
- Cox et al. (2011) Cox, P. et al. 2011, ApJ, 740, 63
- Daddi et al. (2009a) Daddi, E., Dannerbauer, H., Krips, M., Walter, F., Dickinson, M., Elbaz, D., & Morrison, G. E. 2009a, ApJ, 695, L176
- Daddi et al. (2009b) Daddi, E. et al. 2009b, ApJ, 694, 1517
- Damjanov et al. (2009) Damjanov, I. et al. 2009, ApJ, 695, 101
- Dannerbauer et al. (2002) Dannerbauer, H., Lehnert, M. D., Lutz, D., Tacconi, L., Bertoldi, F., Carilli, C., Genzel, R., & Menten, K. 2002, ApJ, 573, 473
- de Zotti et al. (2005) de Zotti, G., Ricci, R., Mesa, D., Silva, L., Mazzotta, P., Toffolatti, L., & González-Nuevo, J. 2005, A&A, 431, 893
- Dunne et al. (2011) Dunne, L. et al. 2011, MNRAS, 417, 1510
- Eales et al. (2010) Eales, S. et al. 2010, PASP, 122, 499
- Foreman-Mackey et al. (2012) Foreman-Mackey, D., Hogg, D. W., Lang, D., & Goodman, J. 2012, ArXiv e-prints
- Frayer et al. (2011) Frayer, D. T. et al. 2011, ApJ, 726, L22+
- Fu et al. (2012) Fu, H. et al. 2012, ArXiv e-prints
- González-Nuevo et al. (2012) González-Nuevo, J. et al. 2012, ApJ, 749, 65
- Goodman & Weare (2010) Goodman, J. & Weare, J. 2010, Communications in Applied Mathematics and Computational Science, 5, 65
- Greve et al. (2005) Greve, T. R. et al. 2005, MNRAS, 359, 1165
- Griffin et al. (2010) Griffin, M. J. et al. 2010, A&A, 518, L3+
- Ibar et al. (2010) Ibar, E. et al. 2010, MNRAS, 409, 38
- Ivison et al. (2011) Ivison, R. J., Papadopoulos, P. P., Smail, I., Greve, T. R., Thomson, A. P., Xilouris, E. M., & Chapman, S. C. 2011, MNRAS, 412, 1913
- Kauffmann et al. (2003) Kauffmann, G. et al. 2003, MNRAS, 341, 54
- Keeton (2001) Keeton, C. R. 2001, ArXiv Astrophysics e-prints
- Kennicutt (1998) Kennicutt, Jr., R. C. 1998, ARA&A, 36, 189
- King & Browne (1996) King, L. J. & Browne, I. W. A. 1996, MNRAS, 282, 67
- Kovács et al. (2010) Kovács, A. et al. 2010, ApJ, 717, 29
- Lawrence et al. (2007) Lawrence, A. et al. 2007, MNRAS, 379, 1599
- Le Floc’h et al. (2005) Le Floc’h, E. et al. 2005, ApJ, 632, 169
- Lilly et al. (1996) Lilly, S. J., Le Fevre, O., Hammer, F., & Crampton, D. 1996, ApJ, 460, L1+
- Lonsdale et al. (2003) Lonsdale, C. J. et al. 2003, PASP, 115, 897
- Madau et al. (1996) Madau, P., Ferguson, H. C., Dickinson, M. E., Giavalisco, M., Steidel, C. C., & Fruchter, A. 1996, MNRAS, 283, 1388
- Magnelli et al. (2011) Magnelli, B., Elbaz, D., Chary, R. R., Dickinson, M., Le Borgne, D., Frayer, D. T., & Willmer, C. N. A. 2011, A&A, 528, A35+
- Michałowski et al. (2010) Michałowski, M. J., Watson, D., & Hjorth, J. 2010, ApJ, 712, 942
- Muñoz et al. (1998) Muñoz, J. A., Falco, E. E., Kochanek, C. S., Lehár, J., McLeod, B. A., Impey, C. D., Rix, H.-W., & Peng, C. Y. 1998, Ap&SS, 263, 51
- Murphy et al. (2011) Murphy, E. J., Chary, R.-R., Dickinson, M., Pope, A., Frayer, D. T., & Lin, L. 2011, ApJ, 732, 126
- Murphy et al. (1996) Murphy, Jr., T. W., Armus, L., Matthews, K., Soifer, B. T., Mazzarella, J. M., Shupe, D. L., Strauss, M. A., & Neugebauer, G. 1996, AJ, 111, 1025
- Myers et al. (2003) Myers, S. T. et al. 2003, MNRAS, 341, 1
- Naab et al. (2009) Naab, T., Johansson, P. H., & Ostriker, J. P. 2009, ApJ, 699, L178
- Negrello et al. (2007) Negrello, M., Perrotta, F., González-Nuevo, J., Silva, L., de Zotti, G., Granato, G. L., Baccigalupi, C., & Danese, L. 2007, MNRAS, 377, 1557
- Negrello et al. (2010) Negrello, M. et al. 2010, Science, 330, 800
- Oliver et al. (2010) Oliver, S. J. et al. 2010, A&A, 518, L21+
- Oser et al. (2012) Oser, L., Naab, T., Ostriker, J. P., & Johansson, P. H. 2012, ApJ, 744, 63
- Oser et al. (2010) Oser, L., Ostriker, J. P., Naab, T., Johansson, P. H., & Burkert, A. 2010, ApJ, 725, 2312
- Pascale et al. (2008) Pascale, E. et al. 2008, ApJ, 681, 400
- Pascale et al. (2011) —. 2011, MNRAS, 415, 911
- Perrotta et al. (2002) Perrotta, F., Baccigalupi, C., Bartelmann, M., De Zotti, G., & Granato, G. L. 2002, MNRAS, 329, 445
- Poglitsch et al. (2010) Poglitsch, A. et al. 2010, A&A, 518, L2+
- Riechers et al. (2010) Riechers, D. A. et al. 2010, ApJ, 720, L131
- Riechers et al. (2011) —. 2011, ApJ, 733, L11+
- Rigby et al. (2011) Rigby, E. E. et al. 2011, MNRAS, 955
- Rujopakarn et al. (2011) Rujopakarn, W., Rieke, G. H., Eisenstein, D. J., & Juneau, S. 2011, ApJ, 726, 93
- Santini et al. (2010) Santini, P. et al. 2010, A&A, 518, L154+
- Sault et al. (1995) Sault, R. J., Teuben, P. J., & Wright, M. C. H. 1995, in Astronomical Society of the Pacific Conference Series, Vol. 77, Astronomical Data Analysis Software and Systems IV, ed. R. A. Shaw, H. E. Payne, & J. J. E. Hayes, 433–+
- Schaye et al. (2010) Schaye, J. et al. 2010, MNRAS, 402, 1536
- Schinnerer et al. (2008) Schinnerer, E. et al. 2008, ApJ, 689, L5
- Schneider et al. (1992) Schneider, P., Ehlers, J., & Falco, E. E. 1992, Gravitational Lenses
- Scott et al. (2011) Scott, K. S. et al. 2011, ApJ, 733, 29
- Serjeant (2012) Serjeant, S. 2012, ArXiv e-prints
- Serjeant & Harrison (2005) Serjeant, S. & Harrison, D. 2005, MNRAS, 356, 192
- Smith et al. (2011) Smith, D. J. B. et al. 2011, MNRAS, 416, 857
- Soifer et al. (1986) Soifer, B. T., Sanders, D. B., Neugebauer, G., Danielson, G. E., Lonsdale, C. J., Madore, B. F., & Persson, S. E. 1986, ApJ, 303, L41
- Swinbank et al. (2010) Swinbank, A. M., Smail, I., Chapman, S. C., Borys, C., Alexander, D. M., Blain, A. W., Conselice, C. J., Hainline, L. J., & Ivison, R. J. 2010, MNRAS, 405, 234
- Tacconi et al. (2006) Tacconi, L. J. et al. 2006, ApJ, 640, 228
- Tacconi et al. (2008) —. 2008, ApJ, 680, 246
- Vieira et al. (2010) Vieira, J. D. et al. 2010, ApJ, 719, 763
- Weiß et al. (2007) Weiß, A., Downes, D., Neri, R., Walter, F., Henkel, C., Wilner, D. J., Wagg, J., & Wiklind, T. 2007, A&A, 467, 955
- Wizinowich et al. (2006) Wizinowich, P. L. et al. 2006, PASP, 118, 297
- York et al. (2000) York, D. G. et al. 2000, AJ, 120, 1579
- Younger (2007) Younger, J. D. o. 2007, ApJ, 671, 1531