The Impacts of Subsidy Policies on Vaccination Decisions in Contact Networks
Abstract
Often, vaccination programs are carried out based on self-interest rather than being mandatory. Owing to the perceptions about risks associated with vaccines and the ‘herd immunity’ effect, it may provide suboptimal vaccination coverage for the population as a whole. In this case, some subsidy policies may be offered by the government to promote vaccination coverage. But, not all subsidy policies are effective in controlling the transmission of infectious diseases. We address the question of which subsidy policy is best, and how to appropriately distribute the limited subsidies to maximize vaccine coverage. To answer these questions, we establish a model based on evolutionary game theory, where individuals try to maximize their personal payoffs when considering the voluntary vaccination mechanism. Our model shows that voluntary vaccination alone is insufficient to control an epidemic. Hence, two subsidy policies are systematically studied: (1) in the free subsidy policy the total amount of subsidies is distributed to some individuals and all the donees may vaccinate at no cost, and (2) in the part-offset subsidy policy each vaccinated person is offset by a certain proportion of the vaccination cost. Simulations suggest that, since the part-offset subsidy policy can encourage more individuals to be vaccinated, the performance of this policy is significantly better than that of the free subsidy policy. Meanwhile, for the free subsidy policy, if the individuals with more neighbors are freely vaccinated with high priority rather than in a random manner, we find that the efficiency of this subsidy policy is remarkably improved. In addition, for the part-offset subsidy policy, we observe that too low or too high proportion of subsidy is not good for group-optimal vaccination given that the total amount of subsidies is restricted. Instead, moderate proportion of allowances can achieve the maximum of the social benefits.
pacs:
89.65.-s, 02.50.Le, 89.75.Fb, 87.23.Kg1 Introduction
Preemptive vaccination is the fundamental method for preventing transmission of infectious diseases as well as reducing morbidity and mortality. Many proposed strategies, however, build upon a major premise that the vaccination or immunization is compulsory and have not considered the willingness or desire of individuals, such as target immunization [1], ring vaccination [2] and acquaintance immunization [3] Practically, the immunization of individuals is more of a voluntary behavior. If individuals are permitted to choose whether to vaccinate according to self-interest, individual behavioral responses play a key role in determining the success of the vaccination program and its consequences for disease control [4, 5, 6, 7, 8]. Meanwhile, the likelihood of choosing vaccination is affected by many factors, including: perceived risk of infection; cost of vaccination; and, the vaccination behavior of other individuals. Many previous studies, based on the imitation rule [9, 10, 11, 12], the payoffs maximization rule [13, 14], or the minority game rule to investigate the vaccination dynamics [15, 16, 17], have concluded that it would be difficult or even impossible to eradicate a vaccine-preventable disease under a voluntary vaccination mechanism without additional incentives. The reason is that, with increasing coverage of vaccination in the community, the individuals who are unvaccinated are less likely to become infected, and therefore, they have less incentive to take a vaccine, and then due to the existence of free-riders, the actual coverage of vaccination often cannot meet the social demand [4, 5].
Though many authors have addressed the key role of human behavioral responses on vaccination dynamics [18, 19, 20, 21], to the best of our knowledge, the influences of different subsidy policies on vaccination decisions have not been thoroughly investigated. In many cases, on account of the gap between the actual coverage of vaccination and the social demand, some incentives, such as subsidy policies should be offered by the government to induce more people to take vaccination. Faced with various choices, which subsidy policy is the best one? How can the efficiency of the subsidy policy be maximized with a restricted amount of available subsidy? In this work we move towards answering these questions.
Previous studies of the interplay between diseases dynamics and individuals’ vaccination behaviors have often assumed that diseases are transmitted in either homogeneously mixed populations or random networks. A recent important advancement, is the application of network theory to study epidemic dynamics [22, 23, 24]. Network-based models have been shown to be able to accurately reflect the heterogeneities in the number of contacts of individuals [25, 26, 27].
Motivated by these facts, in the present work we first develop a network-based vaccination model in which individuals update their vaccination strategies by balancing the advantages and disadvantages of vaccination. And we find that, owing to the ‘herd immunity’ effect in voluntary vaccination mechanism, it is difficult to eradicate the diseases. Hence, two types of subsidy policies are considered: In the first case (labeled free subsidy policy), a certain fraction of individuals are freely vaccinated according to the total amount of subsidies and the cost of vaccination; In the second case (labeled part-offset subsidy policy), a certain proportion of allowances are subsidized to all vaccinated persons. We show that the free subsidy policy is not helpful for improving the probabilities of vaccination among non-donees, but actually reduce it. In contrast, the part-offset subsidy policy can encourage more individuals to take vaccination, leading to the better performance of this policy when the same amount of subsidies is supplied. Furthermore, we verify that the efficiency of the free subsidy policy can be significantly improved when the donees are chosen in a descending degree order rather than in a random way. In addition, for the part-offset subsidy policy, we find that there exists optimal proportion of allowance inducing the group-optimal phenomenon with the fixed amount of subsidies.
2 Vaccination rule and subsidy policies
2.1 Vaccination update rule
We model the interplay between vaccination behavior and the transmission dynamics on contact networks, where the nodes represent individuals and the edges represent the contacts between them, along which an infection can be transmitted. For simplicity, the networks remain static in our study. The number of neighbors of a node is called its degree, and the distribution of these values is called the degree distribution [28].
In our model, individuals need to decide whether to vaccinate or not before implementing the vaccination programs. Usually, the formation of the vaccination opinion is affected by many factors, such as: the side-effects of the vaccines; fear [29, 30]; availability of information concerning the epidemic [31, 32]; and, the opinions of other persons, to name just a few [33, 34]. Here, we assume that individuals update their vaccination decisions by maximizing their perceived benefits (or in other words, by reducing their potential loss). The perceived benefits of infection and the perceived benefits of vaccination are given as [35]
| (1) | |||||
| (2) |
Here or 0 denotes, respectively, that the individual accepts the vaccination or not. The parameters and are the cost of vaccination and infection, and is the perceived probability of infection. Let be the relative cost of vaccination, then Eqs. (1) and (2) can be rewritten as
| (3) | |||||
| (4) |
A more sophisticated definition of the perceived probability of infection by combing a more diverse range of factors may offer a more precise model of reality, but would also increases the complexity of the model. Here we define for simplicity as a function of transmission rate and the number of non-vaccinated neighbors [28],
| (5) |
Eq. (5) indicates that the greater the number of non-vaccinated individuals within the neighborhood, the higher the probability of being infected.
Following common practice, we assume the individuals are of finite rationality. That is, the individuals prefer to choose strategies with higher payoffs (payoff maximization rule), while it is possible, but unlikely, that the individuals can make worse decisions on the vaccination strategy. An usual way to achieve the above purpose is to incorporate stochastic element into the model: the probability of vaccination for the individual is given as [36, 37]:
| (6) |
where represents the degree that the individuals respond to the difference of payoffs, the larger the more sensitive of the individuals. Our main results are obtained with . We have verified that our results are robust to the moderate values of (i.e. ).
2.2 Model description
(1) Construct a contact network. Empirical studies have shown that the degree distributions of many social, biological, and technological networks are of power-law forms rather than Poissonian form. Here we use the classical scale-free network—Barabási-Albert network [40] (labeled BA network) with average degree and as the underlying structure of contact network (We have also checked our results on other types of networks, such as the typical Poissonian network—Erdös-Rényi random network [41], and we found that our results are robust to the structure of contact networks.).
(2) Formation of vaccination opinion. Each individual is
equally assigned a vaccination decision (i.e., vaccinate or not
vaccinate) such that the initial vaccination coverage is about
50%. Then the individuals update their vaccination decisions with
the probability in Eq. (6). Such update rule is carried
out in a parallel way until a steady state is reached (1000
iterations for our model). Finally, each individual makes a
vaccination choice and the vaccinated individuals are immune to
infection. After that, we start the epidemic process.
(3) Epidemic process. The standard SIR (susceptible–infected–removed) epidemic model is run on the network generated in step (1) with the final vaccination decisions obtained in step (2). Initially, individuals are randomly chosen from non-vaccinated individuals as the seeds of infection to begin the epidemic process, and others are either susceptible or vaccinated individuals. At each time step, every susceptible individual is infected with probability , where is the number of infected neighbors of the individual . An infected individual recovers and becomes immune with probability per time step. We run the model until no infection exists in the system. Here, we calibrate the value of disease transmission probability to ensure the final epidemic size to be equal to 90% in the case of non-vaccination in the population. We can achieve this by fixing , for BA network.
The equilibrium data are obtained by averaging over 20 realizations for the epidemic processes, and 100 independent simulations for each process.
3 Effects of subsidy policies
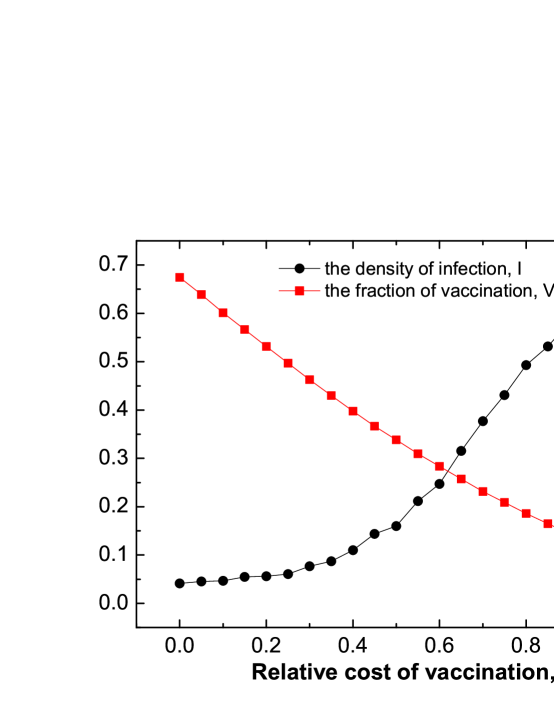
Firstly, taking no account of the government subsidy, the effect of the relative cost of vaccination on the density of infection () and the fraction of vaccination () are presented in figure 1. As expected, the fraction of vaccination decreases with the value of , leading to the rapid increase of the density of infection. Figure 1 also demonstrates that the epidemic can not be eradicated if individuals make vaccination decisions according to self-interest.
In what follows, two different subsidy policies are compared to emphasize the roles of subsidy policies on the epidemic control. For the free subsidy policy, the total amount of subsidies (labeled ) is distributed to some people and all the donees are vaccinated free of charge. For example, if the total amount of subsidy and , then 200 persons would be vaccinated at no personal cost. One counter-intuitive feature is displayed in figure 2: the fraction of vaccination () is not improved remarkably even though the values of increase from 0 (without subsidy policy) to 400 (see figure 2(b)). As a result, such free subsidy policy has limited effectiveness on reducing the density of infection () (see figure 2(a)).
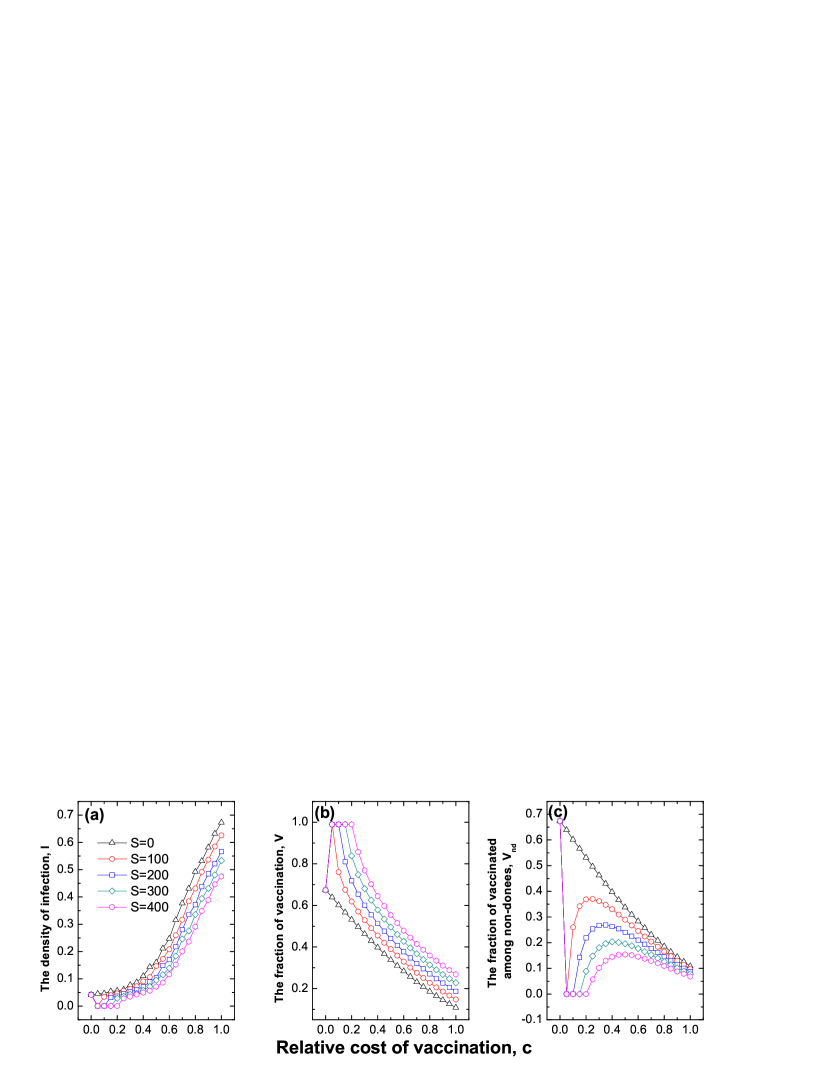
To better explain this disadvantageous situation, the rate of vaccination among non-donees () is presented in figure 2(c). One can observe that, does not increase with the total amount of subsidies , but rather decreases with it. According to Eq. (6), the perceived risk of infection by those non-donees will decrease when more individuals are freely vaccinated. As a result, those non-donees prefer to take risks after balancing the advantages and disadvantages of vaccination. (For fixed value of , we have when is very small. According to the rule of our model, all the individuals will be freely vaccinated (see figure 2(b)), and this will lead to in figure 2(c)).
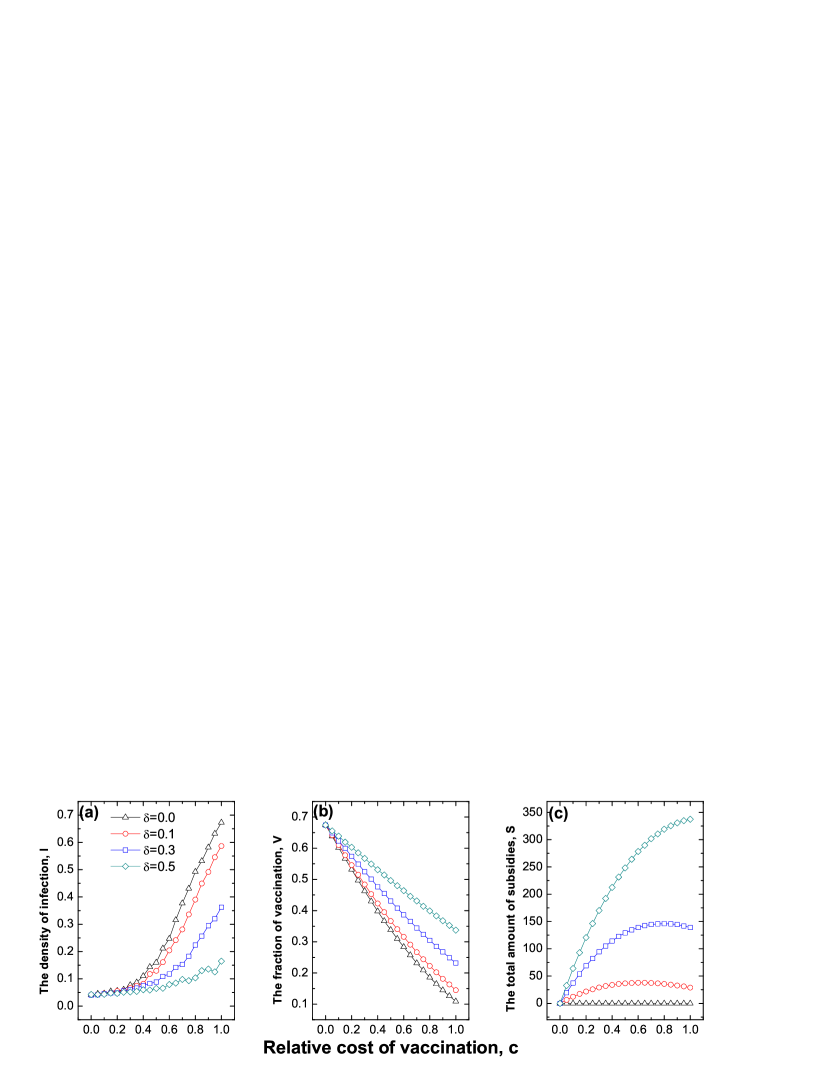
For the part-offset subsidy policy, the proportion of subsidy cost is offset by the government for each vaccinated individual. That is, each vaccinated individual only needs to pay for when the cost of vaccination is . In this case, the effect of the part-offset subsidy policy on controlling the spreading of epidemic is presented in figure 3, where the fraction of vaccination increases with the value of (see figure 3(b)). And this leads to a sharp decline in the density of infection (see figure 3(a)). For example, when , the density of infection is reduced from about 0.65 to 0.15 with increasing from 0 to 0.5. In particular, as shown in figure 3(c), the total amount of subsidy is rather low on the premise of the efficiency of subsidy. For instance, even 50% of cost is subsidized, the total amount of subsidy will be smaller than 350. Comparing in figure 2(a) with in figure 3(a), we can find that the effect of the latter case is absolutely superior to the first case. The advantages of the part-offset subsidy policy can be explained as follows: when those vaccinated individuals are offset by a certain proportion of subsidy, from the individual’s perspective, the cost of vaccination is reduced. Thus more individuals are likely to take vaccination by weighing the cost of vaccination and the cost of infection, and as a result the density of infection is effectively inhibited.
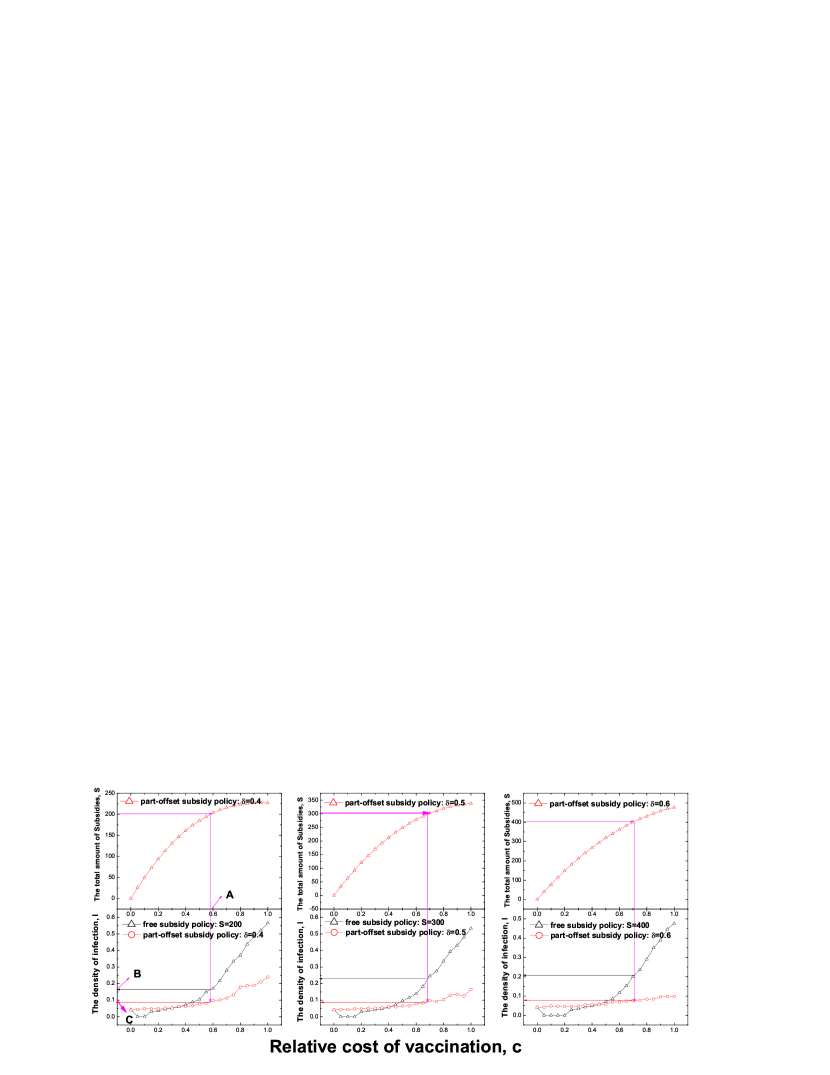
The effects of the two policies on controlling diseases under the same amount of subsidy are studied in figure 4. Since the total amount of subsidies for the part-offset subsidy policy is determined by the number of vaccinated individuals and the value of , to fairly compare the two subsidy policies we first preset a value of (e.g. in the left row of figure 4) and determine the corresponding (e.g. A in the left row of figure 4) in the part-offset subsidy policy. Then the density of infection for the free subsidy policy (e.g. B in the left row of figure 4 ) and the part-offset subsidy policy (e.g. C in the left row of figure 4 ) at the determined can be obtained respectively with the same amount of subsidy. By choosing several representative values of in figure 4, we can find that the performance of the part-offset subsidy policy is generally better than the free subsidy policy. Moreover, the advantage of the part-offset subsidy policy is more noticeable when is larger. We also compare the efficiency of the two subsidy policies for other values of , and find that such phenomenon is universal. That is, the effectiveness of the part-offset subsidy policy on controlling the density of infection dominates.
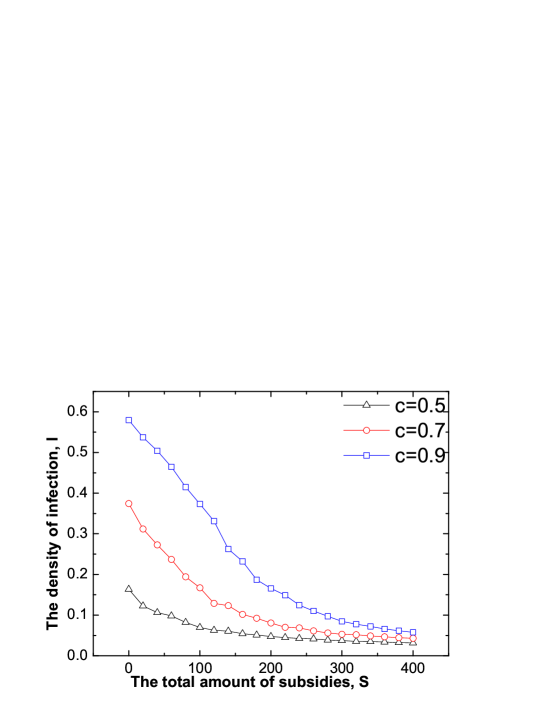
For the free subsidy policy, the beneficiaries are randomly selected (labeled random free policy). Previous studies have pointed out that the structure of contact network plays key roles in the dynamics of an epidemic. For example, due to the existence of hub nodes (nodes with very large degrees), epidemic can easily spread on scale-free networks. Nonetheless, the structural properties of a network can also give instructive hints toward effective control of an epidemic. Targeted immunization was considered by researchers and found that such strategy can effectively prevent the outbreaks of diseases on scale-free networks [1]. Here the targeted subsidy policy is also considered (labeled targeted free subsidy policy), that is, the individuals are freely vaccinated in a descending degree order until the total amount of subsidy is used up. The density of infection as a function of for different values of is presented in figure 5. As shown in figure 5, with the increase of , the density of infection reduces quickly, and the larger value of , the better performance of targeted free subsidy policy on reducing the density of infection.
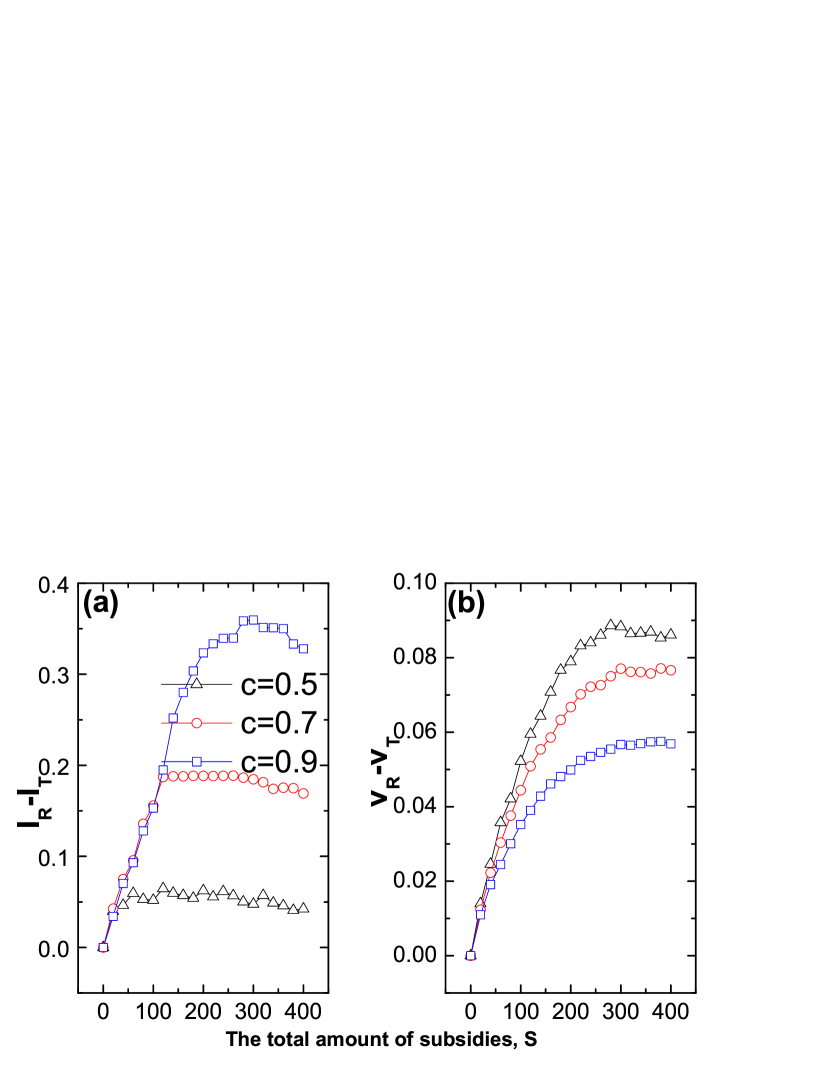
The efficiency of random and targeted free subsidy policies are compared in figure 6 for different values of . Figure 6(a) plots the difference of the density of infection between the random and the targeted free policy (), which indicates that the targeted free subsidy policy is much better than the corresponding random policy in suppressing the epidemic spreading when is large. Notably, the larger value of , the bigger the difference between the two approaches.
One might think that the number of vaccinated individuals in the case of targeted free subsidy policy should be larger than that in the random free subsidy policy. However, Figure 6(b) shows that the fraction of vaccination for the targeted free policy is less than the case of random free policy (i.e. ). Such phenomenon can be explained as follows: on one hand, when the random policy is implemented, the individuals with large degrees cannot be preferentially vaccinated. Thus, according to Eq. (6), these ‘large-degree individuals’ among non-donees are likely to voluntarily choose to take vaccination; on the other hand, for the case of targeted policy, the ‘large-degree individuals’ have been freely vaccinated, and only the individuals with smaller degrees are not vaccinated. These ‘small-degree individuals’ among non-donees are less likely to take vaccination owing to the lower perceived risk of infection. Thus, there exist more vaccinated individuals in the random subsidy policy. Nonetheless, since the ‘large-degree individuals’ are freely vaccinated in the targeted free subsidy policy when is rather large, the effectiveness of targeted free subsidy policy is superior to the random one, irrespective of the less number of vaccinated individuals.
From the perspective of group interest, the purpose of subsidy policies is to minimize the total cost from both vaccination and infection or the prevalence of disease. In many cases, the total amount of the available subsidies is limited. In this case, how to maximize the utility of the limited subsidies is an important and significant task. For part-offset subsidy policy, we will investigate what proportion of allowance can produce the best possible results if the total amount of subsidies is limited.
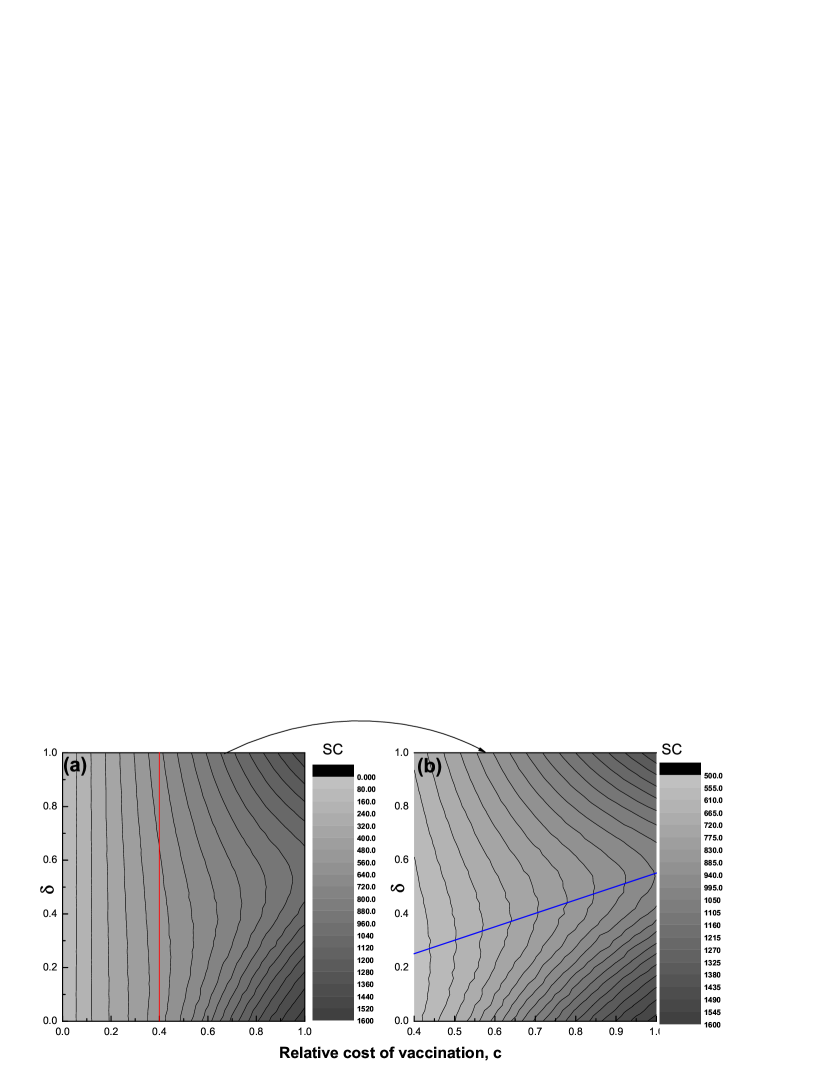
According to Eqs (3) and (4), the cost of vaccination relative to infection is , thus the social cost from the group level can be defined as [5, 42]:
| (7) |
where and are the number of recovered and vaccinated persons. The impacts of and on the social cost are presented in figure 7. From figure 7(a), one can observe that the value of has no significant effect on the social cost when is small. It is because the epidemic can be controlled by voluntary vaccination when is small. As a result, the effect of subsidy is negligible. When is large (the left of red line in figure 7(a)), we can find that there exist an optimal value of leading to the lowest level of for every value of . To explicitly reveal the relationship between the optimal value of and the value of , Figure 7(b) redraws the result of figure 7(a) starting from . We can find that the the optimal value of increase monotonically with (see the blue line in figure 7(b)). That is, the larger value of , the more subsidy proportion should be offset. We want to stress that, for rather large value of , the optimal value of is neither 0 nor 1. In other words, 0% or 100% subsidy policy does not minimize the total social cost.
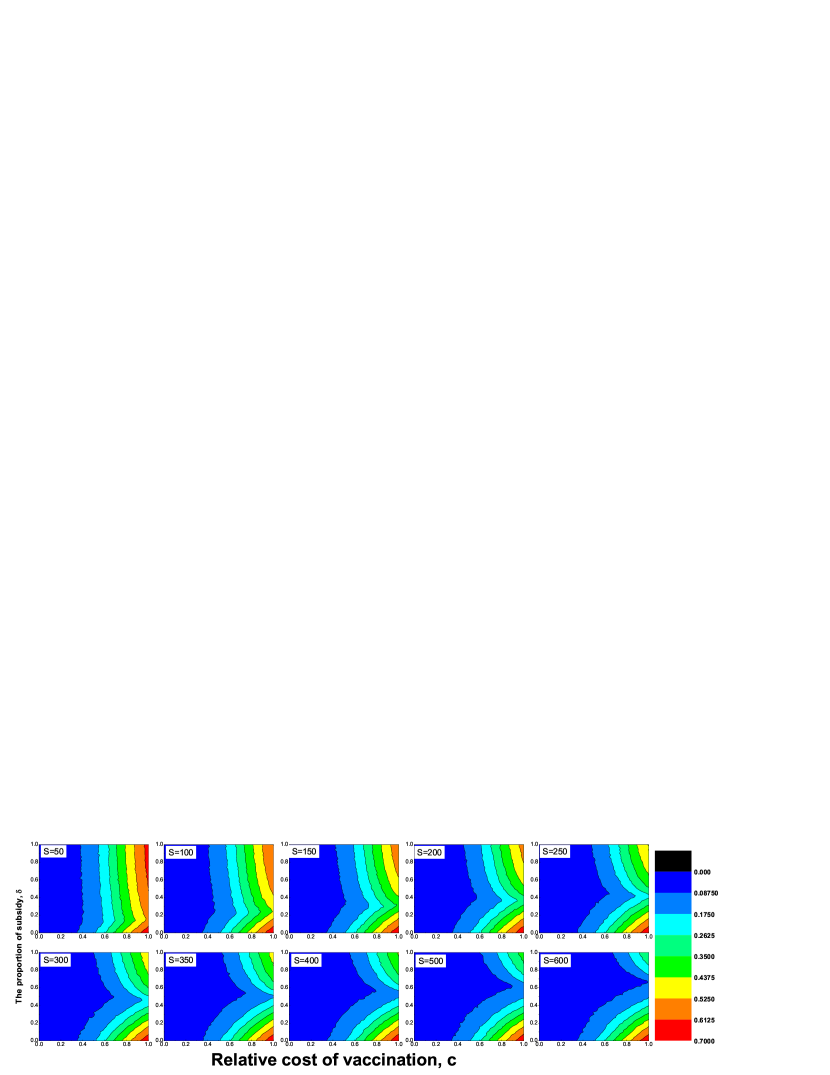
For some fatal diseases, the ultimate goal of the government is to minimize the density of infection. If the total amount of subsidies is fixed, what value of is able to control the prevalence of disease to the lowest level? Figure 8 shows that there exist an optimal values of leading to the lowest level of infection for every value of . Moreover, the optimal value of increases with . We can explain such a phenomenon from two aspects: on one hand, when zero or very small proportion of subsidy is offered, the total amount of subsidies would not be completely exhausted. In such a situation, the subsidy policy can not exert significant impact on the epidemic spreading; on the other hand, if is very large, there will be only a few of individuals to get subsidized, similar to the free subsidy policy, which failed to encourage more individuals to take vaccination. Using the limited subsidy to subsidize as many individuals as possible can guide more people to take vaccination. Thus, we can find that, the small value of , the lower optimal value of , which guarantees more individuals to be offset.
4 Conclusions and Discussions
Incorporating behavioral response into epidemiological disease spreading models can enhance a model’s utility in evaluating control methods. Models based on evolutionary game theory provide a promising approach to investigate the complex interaction between human behavior and the disease transmission process. In this work, a network-based model was proposed to address the impact of different subsidy policies on vaccination coverage and disease prevalence when a voluntary vaccination mechanism is considered. The results reveal that, without any external incentives, diseases will prevail in the contact networks. Two different subsidy policies—free subsidy policy and part-offset subsidy policy are studied in detail. We found that the free subsidy policy is not able to encourage more non-donees to take vaccination, owing to the ‘herd immunity’ coming from those freely subsidized individuals. Thus, the performance of such a policy on suppressing disease prevalence is not remarkable. One possible way of reducing the prevalence of disease for this subsidy policy is to subsidize individuals in a descending degree order, that is, the individuals with more neighbors have higher probability of being subsidized. Of course, this preferential subsidy policy require global information of the contact network, i.e., the number of neighbors for each individual. In reality, this is unlikely to be feasible — but such a strategy could be approximated by identifying “high-risk” groups. In contrast, we have shown that: the effect of the part-offset subsidy policy is prominent, it can effectively promote the coverage of vaccination with fewer subsidies; and, it evidently reduces the prevalence of disease. For the part-offset subsidy policy we also studied how to maximize the effect of subsidy policy when the total amount of subsidies is limited. Both from the total social cost and the density of infection in population, our results suggested that the best method is to distribute the limited resource to as many individuals as possible.
How individuals deal with each new round of infectious disease is often influenced by many external factors, such as rumors, mass media, online information, and publishing the government information in a timely manner [18, 43, 44, 45]. In this work, we take a first step towards understanding the impacts of different subsidy policies on vaccination coverage and epidemiological dynamics. Some simplifying assumptions have been made in the model. For example, our work assumes that the individuals act according to self-interest and make decisions that maximize their personal payoffs. In addition, we also assume that the individuals have perfect information about the transmission rate and the number of non-vaccinated individuals. All of these assumptions were made in order to be able to keep the analysis manageable, and to be able to focus in detail on the roles of different subsidies.
To refine our understanding of vaccination behavior dynamics and the roles of different subsidy polices, further work could be developed in several aspects. First, how important effects of subsidy policies on the control achievement are affected when some individuals update strategies based on the payoff maximization rule and others follow a different rule, such as imitation rule, majority rule or minority rule, and so on. Second, given that some degree of altruistic behavior is a common phenomenon in our society, we should ask how the roles of the subsidy policy are modified when the altruism is taken into account [46]. Third, the effects of the rumors and fears on the vaccination behavior dynamics are also worth consideration.
The disease prevalence, the vaccinating behavior of individuals, and the regulatory measures from the government are all interdependent with each other, and hence should not be studied independently. As our findings indicate, before implementing certain regulatory measures, the government should also consider the effects of the human behavioral responses. If an inappropriate subsidy policy is adopted by the government, then the policy can not achieve the expected results and may generate unnecessary waste.
Acknowledge
This research was funded in part by the National Natural Science Foundation of China (Grant Nos. 11005001, 11005051, 61004104, 61104143, 61004101 and 10975126), The Hong Kong Research Grants Council Competitive Earmarked Research Grants(B-Q28N), and the 211 Project of Anhui University(2009QN003A, KJTD002B).
References
References
- [1] Pastor-Satorras R and Vespignani A 2003 Handbook of graphs and networks 111–130
- [2] Müller J, Schönfisch B and Kirkilionis M 2000 Journal of mathematical biology 41 143–171
- [3] Cohen R, Havlin S and Ben-Avraham D 2003 Physical review letters 91 247901
- [4] Bauch C T, Galvani A P and Earn D J D 2003 Proceedings of the National Academy of Sciences 100 10564
- [5] Bauch C and Earn D 2004 Proceedings of the National Academy of Sciences of the United States of America 101 13391
- [6] Shim E, Grefenstette J, Albert S, Cakouros B and Burke D 2011 Journal of Theoretical Biology
- [7] Perisic A and Bauch C 2009 PLoS computational biology 5 e1000280
- [8] Reluga T and Galvani A 2011 Mathematical Biosciences
- [9] Bauch C 2005 Proceedings of the Royal Society B: Biological Sciences 272 1669–1675
- [10] Bhattacharyya S and Bauch C 2010 Journal of theoretical biology 267 276–282
- [11] Fu F, Rosenbloom D, Wang L and Nowak M 2011 Proceedings of the Royal Society B: Biological Sciences 278 42–49
- [12] Wu B, Fu F and Wang L 2011 PloS one 6 e20577
- [13] Cornforth D, Reluga T, Shim E, Bauch C, Galvani A and Meyers L 2011 PLoS Computational Biology 7 e1001062
- [14] Galvani A, Reluga T and Chapman G 2007 Proceedings of the National Academy of Sciences 104 5692
- [15] Vardavas R, Breban R and Blower S 2007 PLoS Computational Biology 3 e85
- [16] Breban R, Vardavas R and Blower S 2007 Physical review E 76 031127
- [17] Breban R 2011 PloS one 6 e28300
- [18] Funk S, Salathé M and Jansen V 2010 Journal of The Royal Society Interface 7 1247–1256
- [19] Meloni S, Perra N, Arenas A, Gómez S, Moreno Y and Vespignani A 2011 Scientific reports 1
- [20] Gross T, D Lima C and Blasius B 2006 Physical review letters 96 208701
- [21] Meloni S, Arenas A and Moreno Y 2009 Proceedings of the National Academy of Sciences 106 16897–16902
- [22] Newman M 2002 Physical Review E 66 016128
- [23] Liu Z, Wu X, Yang H, Gupte N and Li B 2010 New Journal of Physics 12 023016
- [24] Pastor-Satorras R and Vespignani A 2001 Physical review letters 86 3200–3203
- [25] Masuda N 2010 New Journal of Physics 12 093009
- [26] Holme P 2004 EPL (Europhysics Letters) 68 908
- [27] Newman M 2010 Networks: an introduction (Oxford University Press, Inc.)
- [28] Mbah M, Liu J, Bauch C, Tekel Y, Medlock J, Meyers L and Galvani A 2012 PLoS Computational Biology 8 e1002469
- [29] Epstein J, Parker J, Cummings D and Hammond R 2008 PLoS One 3 e3955
- [30] Wang Y, Xiao G, Wong L, Fu X, Ma S and Cheng T 2011 Journal of Physics A: Mathematical and Theoretical 44 355101
- [31] d’Onofrio A, Manfredi P and Salinelli E 2007 Theoretical population biology 71 301–317
- [32] Zhang H, Small M, Fu X, Sun G and Wang B 2012 Physica D: Nonlinear Phenomena
- [33] Chen F 2009 Mathematical biosciences 217 125–133
- [34] Chen F, Jiang M, Rabidoux S and Robinson S 2011 Journal of Theoretical Biology
- [35] Zhang H, Zhang J, Zhou C, Small M and Wang B 2010 New Journal of Physics 12 023015
- [36] Perc M 2012 Scientific Reports 2
- [37] Szolnoki A and Perc M 2011 Physical Review E 84 047102
- [38] Salathé M and Bonhoeffer S 2008 Journal of The Royal Society Interface 5 1505–1508
- [39] Eames K 2009 Journal of The Royal Society Interface 6 811–814
- [40] Barabási A and Albert R 1999 science 286 509–512
- [41] Erdős P and Rényi A 1960 On the evolution of random graphs (Akad. Kiadó)
- [42] Dybiec B, Kleczkowski A and Gilligan C 2004 Physical Review E 70 066145
- [43] Perra N, Balcan D, Gonçalves B and Vespignani A 2011 PloS one 6 e23084
- [44] Funk S, Gilad E, Watkins C and Jansen V 2009 Proceedings of the National Academy of Sciences 106 6872
- [45] Coelho F and Codeço C 2009 PLoS computational biology 5 e1000425
- [46] Shim E, Chapman G, Townsend J and Galvani A 2012 Journal of The Royal Society Interface