The large-angle photon veto system for the NA62 experiment at the CERN SPS
Abstract
The branching ratio (BR) for the decay is a sensitive probe for new physics. The NA62 experiment at the CERN SPS will measure this BR to within about 10%. To reject the background from dominant kaon decays with final state photons, the large-angle photon vetoes (LAVs) must detect photons of energy as low as 200 MeV with an inefficiency of less than 10-4. The LAV detectors make use of lead glass blocks recycled from the OPAL electromagnetic calorimeter barrel. We describe the mechanical design and challenges faced during construction, the characterization of the lead glass blocks and solutions adopted for monitoring their performance, and the development of front-end electronics to allow simultaneous time and energy measurements over an extended dynamic range using the time-over-threshold technique. Our results are based on test-beam data and are reproduced by a detailed Monte Carlo simulation that includes the readout chain.
1 The NA62 Experiment
The decays and are flavor-changing neutral-current processes for which the rates are highly suppressed in the Standard Model (SM). At the same time, largely because the hadronic matrix elements can be obtained from experimental data on decays, the SM branching ratios (BRs) for these decays can be predicted with minimal intrinsic uncertainty (see Ref. 1 for a recent review). The decays are therefore a sensitive probe of the SM flavor sector and provide constraints on the CKM unitarity triangle that are complementary to those from measurements of -meson decays. On the other hand, the tiny BRs for these decays are notoriously difficult to measure, not least because of the three-body kinematics with two undetectable neutrinos in the final state. At present, the experimental value of the BR for the decay is on the basis of seven detected candidate events [2]. The goal of NA62, an experiment at the CERN SPS, is to detect 100 decays with a S/B ratio of 10:1 in two years of data taking beginning in 2014. The experiment is fully described in Ref. 3. The experimental layout is illustrated in Fig. 1.
NA62 will make use of a 75-GeV unseparated positive secondary beam with a total rate of nearly 800 MHz, of which 50 MHz is ’s. All 800 MHz of beam particles are tracked by three silicon-pixel tracking detectors just upstream of the vacuum decay volume, providing measurement of the trajectory and momentum. The vacuum decay volume ( mbar) begins 100 m downstream of the production target. 5 MHz of kaon decays are observed in the 65-m long vacuum decay region. Large-angle photon vetoes (LAVs) are placed at 11 stations along the decay region and provide full coverage for decay photons with . The last 35 m of the decay region hosts a dipole spectrometer with four straw-tracker stations operated in vacuum. The NA48 liquid-krypton calorimeter [4] is used to veto high-energy photons at small angle. Additional detectors further downstream extend the coverage of the photon veto systems (e.g. for particles traveling in the beam pipe).
The experiment must be able to reject background from dominant decays such as at the level of . Cuts on the and momenta provide a rejection factor of and ensure that the photons from the have 40 GeV of energy. Forward photons that are intercepted by the LKr calorimeter and small-angle vetoes have much higher energies than the photons intercepted by the LAVs. Nevertheless, photons in the LAVs from decays such as may have energies from a few tens of MeV to several GeV. In order to detect the with an inefficiency of , the maximum tolerable inefficiency in the LAV detectors for photons with energies as low as 200 MeV is . In addition, the large-angle vetoes must have good energy and time resolution (10% and 1 ns for 1 GeV photons) and must be compatible with operation in vacuum.
2 The Large-Angle Veto System
The NA62 LAV detectors make creative reuse of lead glass blocks recycled from the OPAL electromagnetic calorimeter barrel[5], which became available in 2007 when various technologies were under consideration for the construction of the LAV detectors. Other solutions considered included a lead/scintillating tile design originally proposed for use in the (later canceled) CKM experiment at Fermilab, and a lead/scintillating-fiber design based on the electromagnetic calorimeter for the KLOE experiment. Prototype instruments based on each of the three technologies were obtained or constructed, and tested with the electron beam at the Frascati Beam-Test Facility. These tests demonstrated that all three technologies are suitable for use in NA62 [6]. In particular, the inefficiency for the detection of single, tagged electrons with the OPAL lead glass modules was measured to be at 203 MeV and at 483 MeV. Basing the construction of the LAV system on the OPAL lead glass modules provides significant economic advantages.
The modules from the central part of the OPAL electromagnetic calorimeter barrel consist of blocks of Schott SF57 lead glass. This material is about 75% lead oxide by weight and has a density and a radiation length cm; its index of refraction is at and at . The Cerenkov light produced by electromagnetic shower particles in the lead glass is read out at the back side of the block by a Hamamatsu R2238 76-mm PMT coupled via a 4-cm long cylindrical light guide of SF57 of the same diameter as the PMT. The rear face of the glass block is glued to a 1-cm thick stainless steel flange. A mu-metal shield surrounding the PMT and light guide is also glued to the flange. Figure 2 shows a picture of a complete module.
A LAV station is made by arranging these blocks around the inside of a segment of vacuum tank, with the blocks aligned radially to form an inward-facing ring. Multiple rings are used in each station. The blocks in successive rings are staggered in azimuth; the rings are spaced longitudinally by about 1 cm. The LAV system consists of a total of 12 stations. Stations A1–A5 are 217 cm in diameter and contain 160 blocks arranged in 5 layers, stations A6–A8 are 266 cm in diameter and contain 240 blocks arranged in 5 layers, and stations A9–A11 are 306 cm in diameter and contain 240 blocks arranged in 4 layers. A12 is operated in air; its design is somewhat different from that of the other stations. As a result of the staggering scheme, particles incident on any station are intercepted by blocks in at least three rings, for a total minimum effective depth of 21 . Most incident particles are intercepted by four or more blocks (27 ).
Station A1 was constructed as a prototype during the first half of 2009. It was installed in the NA62 beamline at CERN and tested in October 2009. The design study and completed station are shown in Fig. 3. Various improvements to the design were made on the basis of the results from the test, and station A2 was constructed and tested in the T9 beamline at the CERN PS in August 2010. A1 was then rebuilt to incorporate the design improvements, and construction of the remaining stations was commenced.
3 LAV Construction
The OPAL detector modules (lead glass block plus PMT) were manufactured by Hamamatsu during the mid-1980s. Their recycling requires substantial care throughout the assembly procedure.
After the storage area in which the modules were kept was inundated during a flash flood in spring 2008, the modules were subject to an extensive sorting and clean-up effort carried out at CERN by an industrial recovery firm. They were subsequently shipped to Frascati, where the LAVs are assembled.
The glass at the interface with the stainless steel flange is fragile and is found to be fractured in a few percent of the modules upon first examination. This is attributed to thermally induced stress. While damaged modules are discarded, the first step in the processing of intact modules is to reinforce the interface. Using epoxy resin, 20 cm-mm thick stainless steel plates are attached across the glass-steel interface on all four sides of the block. Calculations indicate and static tests confirm that the reinforced bond is several times stronger than the original bond. After reinforcement, the blocks are unwrapped and cleaned with isopropanol or acetone. They are then wrapped with a new laser-cut and heat-welded Tyvek cover.
During the A1 test beam, ringing of the analog signal was observed to lead to errors in charge reconstruction using the time-over-threshold technique discussed below. This problem was traced to a small parasitic inductance in the PMT dynodes and solved by replacing the original OPAL HV dividers with new dividers of our own design. The new divider features additional resistors on the last three dynodes and anode to damp out the oscillation, storage capacitors for the last three dynode stages to improve response linearity for large signals, and a decoupling resistor between the HV and signal grounds to decrease noise.
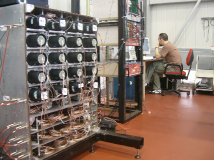
After the divider is replaced, the blocks are tested and characterized 12 at a time using a test station featuring an LED pulser and cosmic-ray telescope (Fig. 4). The PMT gains are measured first, by varying the HV settings and mapping out the response for each block. Using the gain curves so obtained, the PMTs are set to a reference value of the gain (), and the response to cosmic rays selected by the telescope is measured; the photoelectron yield for the block (p.e./MeV) is then obtained assuming that vertically incident cosmic rays leave 77 MeV in each block. Yields of 0.34 p.e./MeV are typical. Finally, using the gain curves and the measurements of photoelectron yield, the PMT voltages are set to the values expected to produce a common output charge level of 4.5 pC for cosmic-ray events. The response is measured and the HV setting is validated. Thus, at the end of a 12-hour cycle, which is fully automated using LabView, we have PMT gain and photoelectron yield measurements as well as the operational HV settings for 12 modules. Additional data (current-draw measurements, dark-count rates) are also collected using the test station.
The OPAL design features an optical port at the base of each module. Blue LEDs are installed in these optical ports as part of the calibration and monitoring system, and will allow monitoring of the operational status and relative timing for each block. A low-capacitance LED was chosen to minimize the rise and fall times of the light pulse; this is important for use with the time-over-threshold-based readout system discussed in the following section. In principle, the LED system should allow in-situ gain calibration as well.
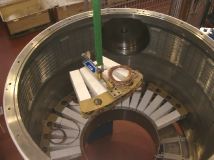
After testing and characterization, the blocks are arranged in groups of four in an aluminum mounting bracket. For the installation, the vacuum vessel is turned on end. The aluminum mounting bracket with four modules is lowered into the upended vessel by overhead crane and bolted to the wall, as illustrated in Fig. 4, right.
4 Front-End Electronics
While the amplitude of the PMT signal from a minimum ionizing particle is about 20 mV, signals from 20-GeV showers may be as large as 10 V. Our readout scheme is based on the time-over-threshold (ToT) technique and furnishes time and energy measurements over a large range of incident photon energies. The scheme is implemented using a dedicated front-end ToT discriminator board of our own design [7] and a digital readout board (TEL62) used by various NA62 detector subsystems [8].
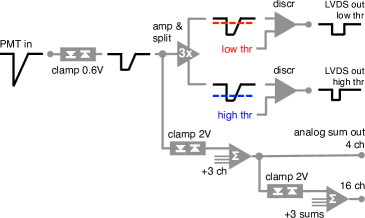
The ToT discriminator converts the analog signals from the detector to low-voltage differential signal (LVDS) pulses, with width equal to the duration of the analog signal from the detector above a specified threshold. After a clamping stage for protection, the signal from each PMT is passively split. One copy of the clamped analog signal is summed with the signals from adjacent channels and made available via a front-panel connector for diagnostic purposes. The other copy is amplified and used as input to a two different comparators, corresponding to a low threshold and a high threshold. Each comparator generates a separate LVDS output. We expect to use thresholds of about 5 and 50 mV against a noise level of about 2 mV; the threshold values are programmable. A conceptual schematic of the ToT discriminator board is presented in Fig. 5. The production model has 32 input channels and 64 output channels.
The TEL62 is based on the design of the TELL1 readout board developed for the LHCb experiment. On the TEL62, TDC mezzanines measure the leading and trailing times of the LVDS pulses. Using a time-to-charge calibration parameterization, the FPGA on board the TEL62 calculates the time corrected for slewing, as well the charge for each hit as reconstructed from the pulse width above threshold. This information is sent to the subsequent DAQ stages. Level-0 trigger primitives are also calculated on board the TEL62 and sent to the level-0 trigger processor.
5 Test-Beam Performance
LAV A2 was tested using the positive secondary beam in the T9 area at the CERN PS in August 2010. Data were collected at various beam momenta over the interval 0.3–10 GeV. The composition of the T9 beam changes as a function of the momentum setting. At 0.3 GeV, the beam is roughly 70% and 30% (including decay ), while above 6 GeV the component drops off sharply. Two threshold CO2 Cerenkov counters in the beamline allowed samples enriched and to be selected. The beam focus coincided approximately with A2’s first layer of lead glass blocks. Two crossed scintillator paddles were placed at the beam entrance, and one larger paddle was placed at the beam exit. A prototype of the ToT discriminator board was used for the test, mainly in conjunction with commercial QDCs and TDCs.
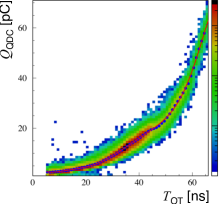
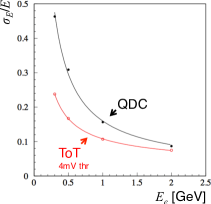
Figure 6 shows a scatter plot of the signal charge measured using the QDCs vs. the signal time over a threshold of 4 mV, for electrons. The data are summed for all blocks on which the beam was incident and over runs of different energies. For small signals, a small increase in the integrated charge corresponds to a large increase in the time over threshold; the ToT measurement provides more sensitivity for small signals than does the QDC measurement. This is a desirable property for the LAV detectors, since high detection efficiency is required for low-energy photons. Parameterizations of the type illustrated in Fig. 6 are used to convert ToT to an effective charge measurement. The energy resolution obtained using the ToT technique is compared with that obtained using the QDCs in Fig. 6. As expected from the form of the curve in Fig. 6, at low energies, the resolution obtained with the ToT technique is better than that obtained with the QDCs. The fits in Fig. 6 give
While, as expected, the statistical contribution to the energy resolution is about the same with either readout scheme, the contribution from noise (term proportional to ) appears to be significantly smaller with the ToT technique. The presence of the constant term with the ToT technique may be due to small differences in the charge vs. ToT curves from block to block.
The width of the signal time distribution in slices of charge gives a measurement of the time resolution. A fit to the measurements of vs. charge from ToT (4 mV threshold) for a single block gives , where the constant term is assumed to be due to trigger jitter. The intrinsic time resolution of the detector can be estimated from the width of the distribution of signal time differences for two successive blocks. Assuming that the two blocks have the same intrinsic time response and that there is no common-mode contribution to the resolution, and , so that we expect , with no constant term. Our measurements are consistent with ps and no constant term.
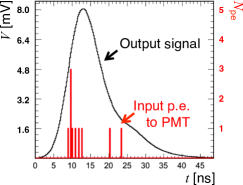
The Geant4-based NA62 Monte Carlo (MC) simulation includes a detailed description of the LAV geometry and materials. The arrival times of the Cerenkov photons at the photocathode are simulated as shown by the histogram in red in Fig. 7. A complete simulation of the PMT uses this information to generate an output signal, taking into account the PMT gain and transit-time fluctuations, the capacitance of the PMT, and dispersion in the readout cable. The resulting signal, which is illustrated by the black curve in Fig. 7, is input to a full simulation of the ToT discriminator.
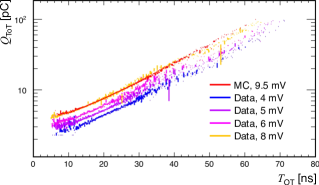
Figure 7 shows charge vs. ToT curves for test-beam muons for four different threshold settings (4, 5, 6, and 8 mV). The red curve is from the simulation, with a threshold at 9.5 mV and all other adjustable parameters set to typical or measured values. The simulation with a threshold of 9.5 mV accurately reproduces the shape of the measured charge vs. ToT curve with threshold 8 mV. This slight discrepancy is easily attributed to the accuracy of the manual threshold adjustment on the prototype ToT discriminator board. These results thus confirm our detailed understanding of the detector and the readout chain.
6 Status and Outlook
As of July 2012, LAVs A1 through A8 have been completed and installed in the beamline. An additional station, A11, is nearly complete at Frascati. Serial production of the front-end electronics boards is underway. As the front-end electronics become available during summer 2012, LAVs A1 though A8 will be read out without beam. They will be fully tested in an NA62 technical run scheduled for November 2012. NA62 data taking with all detectors installed is planned for early 2014.
References
References
- [1] Cirigliano V et al. 2011 In press, arXiv:1107.6001
- [2] E949 Collaboration, Artamonov A et al. 2008 Phys. Rev. Lett. 101 191802
- [3] Hahn (ed) F et al. 2010 NA62 technical design document NA62 Document 10-07
- [4] NA48 Collaboration, Fanti V et al. 2007 Nucl. Instrum. Meth. A 574 433
- [5] OPAL Collaboration, Ahmet K et al. 1991 Nucl. Instrum. Meth. A 305 275
- [6] Ambrosino F et al. 2007 2007 IEEE Nuclear Science Symposium Conf. Record (Honolulu) pp N05–6 arXiv:0711.3398
- [7] Antonelli A et al. 2011 JINST 7 C01097
- [8] Ambrosino F et al. 2011 2011 IEEE Nuclear Science Symposium Conf. Record (Valencia, Spain) pp NP2.S–105