Temperature evolution of infrared- and Raman-active phonons in graphite
Abstract
We perform a comparative experimental and theoretical study of the temperature dependence up to 700 K of the frequency and linewidths of the graphite and optical phonons ( 1590 and 1580 cm-1) by infra-red (IR) and Raman spectroscopy. Despite their similar character, the temperature dependence of the two modes is quite different, e.g., the frequency shift of the IR-active mode is almost twice as big as that of the Raman-active mode. Ab initio calculations of the anharmonic properties are in remarkable agreement with measurements and explain the observed behavior.
pacs:
78.30.Na,63.22.Rc,63.20.kg,71.15.MbThermal properties of carbon systems such as graphene balandin08 ; seol10 and carbon nanotubes yu05 ; pop06 have attracted significant attention, both systems being excellent thermal conductors. In these materials, thermal transport is dominated by lattice vibrations (phonons) and transport can be described properly only once phonon scattering mechanisms are taken into account. Phonon scattering also plays a major role in non-equilibrium phenomena in which nonthermal phonon populations of carbon materials are induced by optical excitation chatzakis11 ; scheuch11 or during electronic transport pop05 ; lazzeri06 . In general, our understanding of thermal properties is heavily based on theoretical modeling bonini12 ; nika12 ; bonini07 and case studies allowing to validate the models are of primary importance.
The frequency and the linewidth of a phonon, as well as their temperature dependence, are measurable quantities which provide key information about the interatomic interactions menendez84 . Indeed, even in a perfect crystal, the phonon linewidth is not zero and the phonon frequencies depend on temperature because of anharmonic terms in the interatomic potential (phonon-phonon interaction) and, in the same instance, because of non-adiabatic effects (phonon-electron interactions) when the gap is sufficiently small. Raman spectroscopy certainly has a central role in the study of vibrational properties of carbon materials. However, this technique probes only a very small portion of the vibrational degrees of freedom and the use of complementary tools is essential to gain further insight. Infrared (IR) spectroscopy is a natural choice and it can also be used to study planar systems li12 ; manzardo12 .
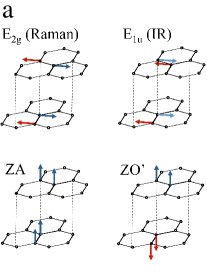
The graphene in-plane anti-phase movement of the two unit-cell atoms is a Raman-active zero momentum (q=0) mode with symmetry (Raman peak). The frequency depends on the temperature and the peak Raman measurement is currently used as a probe of the local temperature in graphene samples balandin08 ; seol10 . In graphite, the mode splits in two modes with symmetry and , depending on the relative motion of the two graphene planes of the graphite unit cell tuinstra70 . The one (in-phase vibration of the two planes) is Raman active and is associated with the well known peak at 1582 cm-1. The one (anti-phase vibration of the two planes) is IR active and has a slightly higher frequency (1590 cm-1). The anomalously large IR intensity of this mode has been the topic of a recent work manzardo12 .
Given the similarities between the and vibrations, their properties are expected to be similar. On the contrary, their linewidths are quite different: At room conditions, the full-width at half maximum (FWHM) of the Raman mode is 13 cm-1, while the FWHM of the IR one is 4 cm-1. Based on calculations bonini07 these width differences have been related to the different electron-phonon interaction. Moreover, according to Ref. bonini07 , the Raman mode linewidth decreases by increasing the temperature (this behavior is quite unusual), while the IR linewidth is predicted to increase. Above room temperature, measurements of the temperature dependence of the linewidth and frequency shift of the IR mode are needed for a comparison.
In this Rapid Communication, we present the measurement of the line-width and the line-shift of the infra-red active mode at 1590 cm-1 in highly oriented pyrolitic graphite in the temperature range 293-523 K. For a comparison, we also show Raman spectroscopy measurements of the peak in a similar temperature range. The results are interpreted by means of ab-initio calculations of the anharmonic properties.
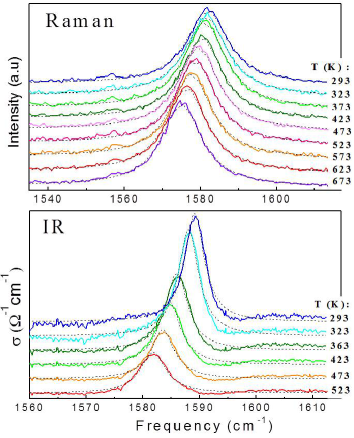
Raman spectra were measured using a Horiba Jobin Yvon T64000 spectrometer equipped with an Ar laser (514.5 nm). The laser was focused on the sample via a Mitutoyo 20 long distance objective. The incoming power was selected in order to prevent sample damage and ensure a rather high signal to noise ratio. The instrumental resolution obtained by measuring the emission spectrum of neon in the phonon frequency region has been found to be 1.6 cm-1 (FWHM of a Gaussian profile). Spectra were recorded by spanning the region (1200-1700 cm-1). The sample was mounted inside an in-house made oven composed of a cartridge heater tightly inserted in a cylindrical copper piece with a little squared open cavity for the incoming light. The heater was connected to a power supply equipped with a thermometer allowing to control the temperature of the cartridge heater. The precision was 0.1ºC.
IR spectra were measured at the AILES infrared beamline braubach of synchrotron SOLEIL (Saint Aubain, France) using a Bruker IFS125 spectrometer working under vacuum. The temperature was set by using a in house made oven similar to the one used for the Raman experiments. The sample was aligned in reflection geometry allowing to acquire reflectivity measurements of the -plane transverse excitations at increasing temperatures. The reference was measured at room temperature using a gold mirror mounted in such a way as to replace the sample inside the oven. The entire working set-up used was as follows: synchrotron light as the source, KBr as the beam splitter and mercury cadmium telluride (MCT) as the detector. With this configuration we acquired spectra in the frequency region between 700 and 3500 cm-1 with a resolution of 0.1 cm-1. Reflectivity data were treated by Kramers-Kronig transformation to extract the real part of the optical conductivity . The Raman spectra and the conductivity IR spectra, corrected by the respective background, were fitted with a single Lorentzian profile (Fig. 1) to obtain the width and position of the peaks. For a discussion on the asymmetric shape of the IR peak see manzardo12 .
In a defect-free perfect crystal, phonons have a finite lifetime because they can decay by anharmonic phonon-phonon () scattering or by electron-phonon () scattering, this last process being possible in graphite as the electronic gap is zero. The intrinsic linewidth of a phonon can thus be written as a sum of two terms (see e.g. bonini07 and references therein), where is the temperature. The linewidth in a real sample can be larger because of the presence of other scattering mechanisms. Concerning the temperature dependence of the phonon pulsation , at the lowest order one can distinguish the following contributions menendez84 :
| (1) |
where is the harmonic pulsation at the equilibrium lattice parameters, accounts for the variation of the harmonic pulsation by varying the lattice parameters (as a consequence of the thermal expansion), and and can be interpreted as due to anharmonic scattering involving, respectively, three or four phonons (see e.g. menendez84 ; lazzeri03 and references therein). The three shifts are proportional to and are, thus, expected to be of the same order of magnitude. Other terms are .
In the present study, we compare the measured linewidths with those calculated in bonini07 . Reference bonini07 reports the calculated anharmonic lineshift for the Raman mode only. Here, we determine the anharmonic lineshift of the IR active mode using the same approach as bonini07 . Calculations are performed within density functional theory (plane-waves and pseudopotential approach) with the QUANTUM ESPRESSO package giannozzi . Phonon dispersions are obtained within the linear response approach of DFPT . Anharmonic phonon-phonon scattering coefficients are determined thanks to the 2n+1 theorem as implemented in lazzeri02 . All the computational details have been described in bonini07 , and, in particular, we use the local density approximation and equilibrium lattice spacing parameters (Å, ).
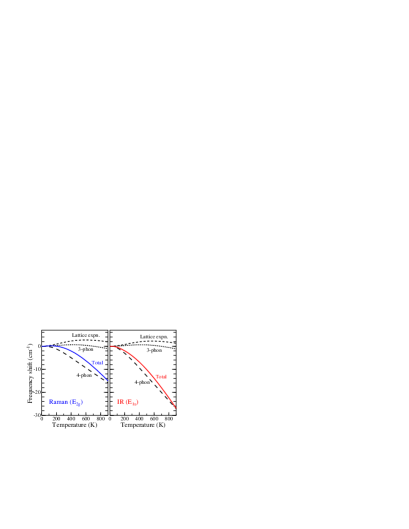
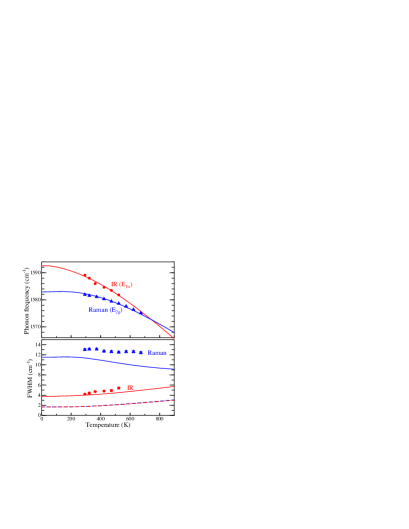
Figure 2 compares the measured and calculated parameters for the Raman () and IR active () modes. Measured linewidths are in good agreement with the calculations of bonini07 : The IR linewidth increases when increasing the temperature while the Raman decreases. These trends are directly visible on the raw data of Fig. 1. This behavior was interpreted in bonini07 considering the following: (i) The phonon-phonon contribution to the linewidth, , is very similar for the two modes and increases with the temperature (Fig. 1); and (ii) the contribution is significantly more important for the mode and provides the overall temperature decrease of the linewidth.
Figure 2 also shows the line-shift. The theoretical curves are vertically shifted to best fit the experimental data, obtaining, for =0K, 1592.6 and 1582.9 cm-1 for and , respectively. These can be considered as the extrapolated =0K experimental frequencies and their difference is 9.7 cm-1. At the equilibrium lattice spacing, the () frequency is 1614.2 (1604.9) cm-1. To compare with the =0K experimental value, one has to add the calculated anharmonic shifts at =0K, which are (-17.7) cm-1, (-14.1) cm-1 and (+1.3) cm-1 for the () mode. The resulting frequency difference is 6.6 cm-1, which underestimates by 3 cm-1 the experimental 9.7 cm-1 value. By considering frequencies at the generalized gradient approximation (GGA) level, mounet05 the agreement slightly worsens.
By increasing the temperature from 293 to 523 K, the measured IR frequency shifts by cm-1, which is more than twice the corresponding Raman shift, cm-1, in agreement with calculations (Fig. 2). To understand this behavior, we decompose the lineshift of the two modes into the three dependent components defined in Eq. 1 (see Fig. 3). The different behavior of the two and modes is almost entirely determined by the corresponding 4-phonon scattering terms (Fig. 3).
Why are the four-phonon shifts of the two modes so different? To answer this question, we need to introduce some concepts. Let us consider the interatomic potential energy , where is the displacement from the equilibrium position of the -th atom in the crystal cell identified by the lattice vector along the Cartesian coordinate. For a phonon with wavevector q, branch index , and energy , we define the adimensional phonon displacement as , being the orthogonal phonon eigenmodes normalized on the unit cell, the atomic mass, and the number of q-points describing the system (or unit cells).
For a phonon q=0, and branch index , we define the four-phonon spectral function as:
| (2) |
where is a sum on the Brillouin zone, is the unit cell energy, is the Bose-statistics occupation of the phonon , and is the Dirac distribution. Equation (2) depends on the temperature only through the terms . The associated four-phonon shift menendez84 ; lazzeri03 can be written as
The fourth order derivatives in Equation (2) can be interpreted as scattering coefficients among two phonons 0 and the two phonons -q,q. The spectral function separates the contributions from phonons with different energies.
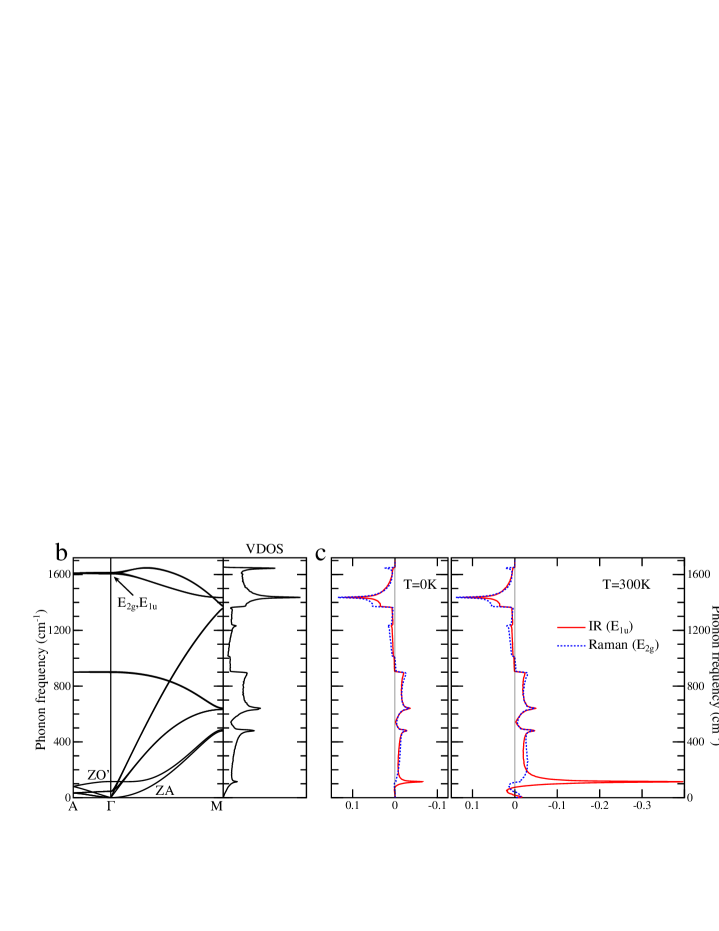
The spectral functions of the two and modes are very similar [Fig. 4(c)], the major differences being near 115 cm-1, where the spectral function shows a peak absent in the one. This peak strongly depends on the temperature (in the temperature range considered) and accounts for the difference in the two and shifts. This peak is associated with the maximum of the graphite phonon density of states (VDOS in Fig. 4) at 115 cm-1, and this maximum is due to the optical out of plane phonon branch. We remind that, in graphene, the vibration of the atoms perpendicular to the plane, is associated with the acoustic branch. In graphite, this branch, splits into a branch in which the two graphene planes vibrate in-phase, , and a branch in which the two planes vibrate anti-phase, , [Fig. 4(a)-(b)]. The graphite branch is acoustic, while the is optical with a 114 cm-1 frequency at q=0. The four-phonon anharmonic coupling [the fourth order derivative in Eq. (2)] between the mode and the branch is much stronger than that between the and the . The presence (absence) of this coupling explains the presence (absence) of the 115 cm-1 peak in the spectral decomposition of Fig. 4c for the () mode.
We remark that graphene bilayer also presents an IR active optical mode and a mode with a frequency of 80 cm-1 park08 , smaller than in graphite. A smaller frequency is associated with a stronger temperature dependence of the phonon occupation (with respect to the graphite ). This fact, suggests that the IR active mode of the bilayer should present a temperature dependence of the shift stronger than in graphite.
To conclude, we measured the linewidth and frequency shift of the optical phonons (IR active) and (Raman active) of graphite as a function of temperature. Despite the similarities between the two and vibrations, their temperature dependence is quite different. The linewidth is almost three times smaller than the one (at room temperature) and, while the linewidth increases by increasing the temperature, the one slightly decreases. Both behaviors are in good agreement with the ab initio calculations of bonini07 . The shifts of the two modes are also very different: By increasing the temperature from 293 to 523 K, the mode shifts by more than twice the corresponding value, in agreement with the present calculations. This difference is explained by the presence (absence) of the four-phonon anharmonic coupling between the () phonon and the phonon branch at 115 cm-1. These findings confirm the accuracy and predictive power of density functional theory calculations in determining anharmonic phonon-phonon scattering in carbon systems, a key step in developing realistic models for thermal transport bonini12 .
Part of the calculations were done at IDRIS, project 096128.
References
- (1) A.A. Balandin et al., Nano Lett. 8, 902 (2008).
- (2) J.H. Seol et al., Science 328, 213 (2010).
- (3) C. Yu et al., Nano Lett. 5, 1842 (2005).
- (4) E. Pop et al., Nano Lett. 6, 96 (2006).
- (5) I. Chatzakis et al., Phys. Rev. B 83, 205411 (2011).
- (6) M. Scheuch et al., App. Phys. Lett. 99, 211908 (2011).
- (7) E. Pop et al., Phys. Rev. Lett. 95, 155505 (2005).
- (8) M. Lazzeri and F. Mauri, Phys. Rev. B 73, 165419 (2006).
- (9) N. Bonini, J. Garg, and N. Marzari, Nano Lett. 12, 2673 (2012).
- (10) D.L. Nika and A.A. Balandin, J. Phys.: Condens. Matter, 24, 233203 (2012).
- (11) N. Bonini, M. Lazzeri, N. Marzari, and F. Mauri, Phys. Rev. Lett. 99, 176802 (2007).
- (12) J. Menendez, and M. Cardona, Phys. Rev. B 29, 2051 (1984).
- (13) Z.Q. Li et al., Phys. Rev. Lett. 108, 156801 (2012).
- (14) M. Manzardo, E. Cappelluti, E. van Heumen, and A.B. Kuzmenko, Phys. Rev. B 86, 054302 (2012).
- (15) F. Tuinstra and J. L. Koenig, J. Chem. Phys. 53, 1126 (1970); R.J. Nemanich, G. Lucovsky, and S.A. Solin, Sol. Stat. Comm. 23, 117 (1977).
- (16) J.B. Brubach et al., AIP Conference Proceedings 81, 1214 (2010); P. Roy, M. Rouzieres, Z. M. Qi and O. Chubar, Infrared Physics and Technology 49, 139 (2006).
- (17) M. Lazzeri, M. Calandra, and F. Mauri, Phys. Rev. B 68, 220509(R) (2003).
- (18) P. Giannozzi et al., J. Phys.: Condens. Matter 21, 395502 (2009).
- (19) S. Baroni, S. de Gironcoli, A. Dal Corso, and P. Giannozzi, Rev. Mod. Phys. 73, 515 (2001).
- (20) M. Lazzeri and S. de Gironcoli, Phys. Rev. B 65, 245402 (2002).
- (21) N. Mounet and N. Marzari, Phys. Rev. B 71, 205214 (2005).
- (22) C.H. Park, F. Giustino, M.L. Cohen, and S.G. Louie, Nano Lett. 8, 4229 (2008).