The Epoch of Disk Settling: to Now
Abstract
We present evidence from a sample of 544 galaxies from the DEEP2 Survey for evolution of the internal kinematics of blue galaxies with stellar masses ranging over . DEEP2 provides galaxy spectra and imaging from which we measure emission-line kinematics and galaxy inclinations, respectively. Our large sample allows us to overcome scatter intrinsic to galaxy properties in order to examine trends in kinematics. We find that at a fixed stellar mass galaxies systematically decrease in disordered motions and increase in rotation velocity and potential well depth with time. Massive galaxies are the most well-ordered at all times examined, with higher rotation velocities and less disordered motions than less massive galaxies. We quantify disordered motions with an integrated gas velocity dispersion corrected for beam smearing (). It is unlike the typical pressure-supported velocity dispersion measured for early type galaxies and galaxy bulges. Because both seeing and the width of our spectral slits comprise a significant fraction of the galaxy sizes, integrates over velocity gradients on large scales which can correspond to non-ordered gas kinematics. We compile measurements of galaxy kinematics from the literature over and do not find any trends with redshift, likely for the most part because these datasets are biased toward the most highly star-forming systems. In summary, over the last billion years since , blue galaxies evolve from disordered to ordered systems as they settle to become the rotation-dominated disk galaxies observed in the Universe today, with the most massive galaxies being the most evolved at any time.
Subject headings:
galaxies – formation, galaxies – evolution, galaxies – kinematics and dynamics, galaxies – fundamental properties1. Introduction
In the standard picture of disk galaxy formation, baryons enter into dark matter halos and dissipate to form disks at their centers (Rees & Ostriker, 1977; White & Rees, 1978; Fall & Efstathiou, 1980; Blumenthal et al., 1984). The accretion of baryons onto galaxies is expected to be an on-going process, and it is not yet known how galaxy disks respond to it, or how they evolve as mass accretion rates change. Only recently have hydrodynamic simulations of galaxy formation been run with enough resolution to study this in detail for up to a few tens of galaxies (e.g. Governato et al., 2007, 2009; Bournaud et al., 2009; Ceverino et al., 2010; Brook et al., 2011; Kimm et al., 2011; Martig et al., 2012, and references therein). Such simulations have yet to address the evolution of internal galaxy kinematics over a significant period of time, which is the cleanest observational probe of disk galaxy assembly. Internal kinematics tell us directly about the dynamical state of galaxies, reveal the potential well depths of individual galaxy-dark matter halo systems, and can be measured for a large sample of galaxies over a significant range in redshift.
We have acquired a wealth of information about blue galaxies over the last billion years since which can be roughly divided into two categories: those which imply a significant amount of evolution and those which do not. Among the observations which do not imply much evolution are those of galaxy luminosity functions. Luminosity function studies find that the number density of blue galaxies is unchanging, and that blue galaxies fade by only -band magnitude since (e.g., Willmer et al., 2006; Faber et al., 2007; Bell et al., 2004). Similarly, studies of stellar mass functions of blue galaxies find no evolution to within uncertainties (Bundy et al. 2006; Borch et al. 2006; Pozzetti et al. 2010; although see Drory et al. 2009). In addition, galaxy sizes are only marginally smaller at compared to local galaxies (by a factor of 1.4; Dutton et al., 2011). However, despite all this evidence for a slowly evolving population, there are some strong indications of substantial evolution. Compared with blue galaxies of similar stellar masses today, those at have significantly higher star-formation rates by a factor of (e.g., Noeske et al., 2007), higher molecular gas fractions (for at least a few of the brighter galaxies which have been observed so far) by a factor of (Daddi et al., 2010; Tacconi et al., 2010), and more disturbed morphologies (e.g., Abraham et al., 1996; Abraham & van den Bergh, 2001). In summary, blue galaxies do not evolve much since in luminosity, stellar mass, or size, but they do evolve strongly in star-formation rate, (likely) molecular gas fraction, and morphology. In this paper, we attempt to understand this discrepancy and the mechanisms behind it by studying the internal kinematics of blue galaxies since .
Due to the large intrinsic scatter in the kinematic properties of blue galaxies (Weiner et al., 2006a, b; Kassin et al., 2007), a sizable sample () which is representative in terms of galaxy properties is required to study internal galaxy kinematics over a significant look-back time. The first large study to address the kinematic evolution of blue galaxies since was Weiner et al. (2006a, b) which used data for 1089 galaxies from the TKRS Survey. Among other things, they found that about one-third to one-half of emission-line galaxies over have a significant or dominant component of disordered motions, as measured via an integrated gas velocity dispersion (; as discussed in §4.1). Weiner et al. (2006a) proposed a new velocity indicator to trace galaxy potential well depths. It incorporates both rotation velocity () and : .
Kassin et al. (2007) (hereafter K07) followed up on Weiner et al. (2006a, b). Their dataset consisted of 544 galaxies from the DEEP2 Survey over with medium-resolution spectroscopy from which kinematics were measured and imaging. The images were used to measure galaxy morphologies and axial ratios (which were used by K07 to correct rotation velocities for inclinations of galaxies to the line-of-sight). The main results of K07 are:
-
•
K07 showed that scatter in the stellar mass Tully-Fisher relation (TFR), i.e. the relation between galaxy stellar mass and , is mostly to low and is a strong function of morphology. Galaxies which scatter to low generally have disturbed or compact morphologies. Similarly, from samples of 33 and 68 galaxies in the IMAGES Survey at , Flores et al. (2006) and Yang et al. (2008), respectively, found a large scatter in the TFR due to galaxies with “perturbed or complex kinematics.” Most previous studies of Tully-Fisher at both low and high redshift tried to minimize scatter by selecting galaxies which are morphologically well-ordered disks (e.g., Verheijen 1997, Kassin, de Jong, & Weiner 2006, Pizagno et al. 2007 and references therein for low redshift, and e.g., Conselice et al. 2005, Miller et al. 2011 and references therein for ).
-
•
K07 demonstrated that galaxies which scatter to low in the TFR have a significant contribution to their kinematics from disordered motions (as quantified by ).
-
•
K07 showed that when and are combined into a velocity indicator created to trace galaxy potential well depths ( as defined above), a tight relation with stellar mass results. This relation is independent of galaxy morphology, non-evolving since , and coincident with the Faber-Jackson relation for early-type galaxies. It demonstrates that galaxies are likely approximately virialized since in that they have all the energy they will have today already at . This tightening of Tully-Fisher once is adopted was later found by other observational studies (Cresci et al., 2009; Puech et al., 2010; Lemoine-Busserolle & Lamareille, 2010; Lemoine-Busserolle et al., 2010; Vergani et al., 2012; Catinella et al., 2012) and numerical simulations of interacting galaxies (Covington et al., 2010).
-
•
K07 found that the majority of scatter in the TFR at low redshift is at lower stellar masses ( M⊙). They found that the scatter at higher masses was low at low redshift, and increased with increasing redshift to . K07 hypothesized that this meant higher mass galaxies have been settling onto the TFR since , and that lower mass galaxies are settling onto the TFR today. Similarly, studies with the IMAGES Survey argue for significant kinematic evolution since (e.g., Yang et al., 2008; Neichel et al., 2008; Puech et al., 2008).
The K07 study leaves a number of open issues:
-
•
First, although it is clear that galaxies are evolving in and since , this evolution is not quantified.
-
•
Secondly, it is also clear from K07 that kinematic evolution is a function of galaxy stellar mass, but this is not quantified or addressed in detail.
-
•
Finally, although K07 found that the relation between and stellar mass relation does not evolve to within uncertainties since , it has yet to be determined whether galaxies evolve in .
In this paper we address these open issues with a more sophisticated analysis of the dataset in K07. In §2 we detail how the K07 sample was selected; this was not included in K07 because it was a letter paper and did not have the space to do so. In §3 we discuss the stellar mass and size measurements which are adopted from other studies, and describe the measurement of emission line extents made in this paper. In §4, since it was not addressed in detail in K07, we describe how and are measured from emission lines in galaxy spectra and discuss what they measure. We then show how and evolve with redshift in §5, and discuss the influence of galaxy stellar mass and size on this evolution in §6. In §7 we quantitatively define a settled disk galaxy and study how the fraction of settled disk galaxies evolves with redshift. Our findings are compared with previous measurements of galaxy kinematics in the literature over in §8. Conclusions are given in §9. A CDM cosmology is adopted throughout (), and all logarithms are base 10.
2. Sample Selection
In this paper we use the dataset of K07. Since K07 was a letter paper, it did not include a detailed description of how its galaxy sample was selected, so we include it here. One of the main differences between K07 and most other studies of galaxy kinematics lies in its sample selection. Typically, constraints on galaxy morphology are applied at the outset to remove disturbed and major-merger galaxies. K07 instead included all galaxies with emission lines which are bright enough to measure kinematics from, regardless of morphology. Since disturbed morphology and disordered motions (as measured by ) are correlated, removing galaxies with disturbed morphologies would introduce a strong bias toward only the most rotation-dominated systems (K07). Little or no evolution in internal galaxy kinematics would be found for a sample selected in this manner. Moreover, such a sample would not be representative of galaxies at higher redshifts since they tend to have disturbed morphologies (e.g., Griffiths et al., 1994; Windhorst et al., 1995; Abraham et al., 1996; Abraham & van den Bergh, 2001). Even when a strict morphological selection is loosened somewhat to include galaxies which are moderately disturbed but disk-like, still little scatter and no evolution in Tully-Fisher since are found (Miller et al., 2011, 2012). Furthermore, many studies of galaxy kinematics at medium to high redshift are limited to galaxies with extremely bright emission lines, which are not representative of the general population of galaxies. The sensitivity of DEEP2 allows the K07 sample to probe a large range in galaxy stellar mass and color (Figure 1).
In addition to broad morphological selection criteria and a large range in stellar mass, in order to study the evolution of disk galaxy kinematics over a significant look-back time, medium resolution spectra of a sizable sample of galaxies () which span a wide range in redshift are required. A sizable sample is needed because emission-line galaxies have significant intrinsic scatter in their kinematic properties (Weiner et al. 2006a, b; K07).
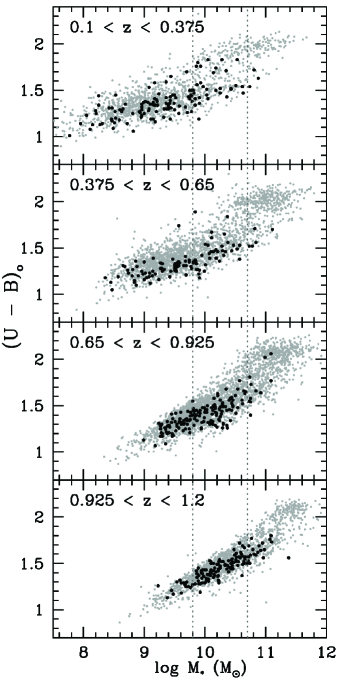
The K07 sample derives from a very large collection of 9715 galaxies with solid spectroscopic redshifts from Keck/DEIMOS (Faber et al., 2003) in field 1 of the DEEP2 Survey (May 2007 catalog), as described below. Field 1 is home to the AEGIS multi-wavelength survey (Davis et al., 2007). The limiting magnitude of DEEP2 is and galaxies in field 1 are not subject to a color selection (Willmer et al. 2006; Newman et al. submitted). In Figure 1 we show rest-frame color-magnitude diagrams for galaxies in field 1 of DEEP2 and highlight the K07 sample. The K07 sample provides good coverage over galaxy mass. Although it is moderately biased toward blue galaxies at a fixed mass, the effect is not severe.
In the following we detail how galaxies were selected from field 1 of the DEEP2 Survey to be in the K07 sample. First, although DEEP2 reaches a redshift of , K07 chose to be conservative and limit their sample to , leaving 8787 galaxies. This helps to avoid the high-redshift end of the survey where the selection is in the rest-ultraviolet and becomes dependent on color (Willmer et al., 2006). It also ensures that galaxy axis ratios, which are used to correct rotation velocities for inclinations of galaxies to the line-of-sight, are measured from imaging which has not yet shifted into the ultraviolet since these wavelengths may not trace the bulk of the stellar mass of galaxies. Next, galaxies were chosen to have Hubble Space Telescope/ACS imaging at and , which further reduces the sample to 3523 galaxies. This is because there are portions of field 1 which are not imaged by . Aside from removing galaxies which did not have imaging, this requirement did not further affect our sample selection because the images are deeper than the spectral survey. For our most important selection, galaxies with bright enough emission lines to measure kinematics ( erg s-1 cm2) were chosen, leaving 1692 galaxies.
Galaxies were further selected by K07 to have inclinations measured from images between , and spectrographic slits with position angles aligned to within of their major axes. These cuts leave a sample of 755 galaxies. Inclinations are measured from -band images using the SExtractor software package (Bertin & Arnouts, 1996), as described in Lotz et al. (2008), and have an uncertainty of . The inclination requirement avoids nearly face-on galaxies for which inclination measurements are very uncertain, and minimizes the effects of dust in the determination of stellar mass for highly inclined systems. However, if the morphology of a galaxy was deemed by eye to be disturbed enough such that its inclination could not be reliably determined, it was included in the sample but not corrected for inclination. There are only 24 of these galaxies and they are flagged in most of the following analysis. Removing them from the sample does not significantly affect the results of this paper. For the slit position angles, due to the large slit width (″) compared to the apparent sizes of galaxies in our sample (″) and the effects of seeing, accurate kinematics can be measured if slit position angles are offset by up to 40° from galaxy major axes (Figure 13 of Weiner et al., 2006a). Finally, if an emission line was affected by a sky line or an instrumental artifact, the corresponding galaxy was removed from the sample, leaving a total of 544 galaxies in the K07 sample. No constraints on morphology were applied.
To study the evolution of galaxy kinematics for a sample of blue galaxies which is mass-limited at all redshifts, in §5.1 we limit the K07 sample to galaxies with stellar masses over , as demarcated in Figures 1– 3. Since the stellar mass function of blue galaxies does not evolve significantly since (Borch et al., 2006; Bundy et al., 2006; Pozzetti et al., 2010), we do not change this stellar mass range with redshift. This cut removes 274 galaxies from the K07 sample, leaving 270. Throughout the paper we will refer to this as the “mass-limited sample.”
3. Stellar Mass and Size Measurements
In this paper we will study the relationship between galaxy kinematics and stellar mass, building upon the scaling relations studied in K07. We adopt stellar mass measurements from Lin et al. (2007) via private communication, as was done in K07. The uncertainties on these stellar mass measurements are dex.
In addition to the effects of stellar mass on galaxy kinematics, we will also look at galaxy sizes. Two size measurements are studied: emission line extent and continuum size. In this paper we measure emission line extents from ground-based DEEP2 spectra from the same lines used to measure kinematics. However, unlike the kinematic measurements, no seeing correction is applied. The spatial extent of the line emission is measured as follows for a given galaxy. For details on the method, see Weiner et al. (2006a). First we measure the spectral continuum by collapsing the two-dimensional spectrum in wavelength over a 15Å range around the line and two 100Å spatial ranges on either side of the line. We then fit a Gaussian profile along the slit using a non-linear least-squares routine and adopt the resulting full-width-half-maximum (FWHM) as our measurement of emission line extent. For the galaxy continuum sizes, we adopt measurements made from images using the GIM2D software package (Simard et al., 2002) by Dutton et al. 2011 and E. Cheung et al. in preparation. To take into account band-shifting with redshift, sizes are measured from and -band images for galaxies at redshifts less than and greater than , respectively. Since the continuum sizes are measured from images, they are unaffected by seeing.
4. Kinematic Measurements
Measurements of internal galaxy kinematics from emission lines are adopted from K07. In this section we discuss some relevant details and the phenomena they describe. Further details on how these measurements were made are given in Weiner et al. (2006a, b) for a similar survey with a lower spectral resolution: compared with for the K07 sample.
For each galaxy the emission line used to measure kinematics is the one with the highest signal-to-noise in its spectrum. For the vast majority of galaxies, the H , [O II] , and [O III] lines are used. Rotation velocities on the flat parts of the rotation curves (), where is the inclination of a galaxy to the line-of-sight) and integrated gas velocity dispersions () were measured simultaneously from the emission lines, and the effects of seeing (typically ″) were taken into account. Our spectral resolution allows for and to be measured down to and km s-1, respectively. An uncertainty of 10 km s-1 is adopted for both and to account for random errors and the dependence of model parameters on the assumed seeing and scale radius of the rotation curve. Although many of the rotation curves do not “turn over” due to seeing, our model is still able to fit for the rotation velocity on the flat part of the rotation curve (Weiner et al., 2006a, §2.3.2). In addition, it has been demonstrated using deeper data with the same telescope/instrument which observe a turn-over in the rotation curve for 90% of galaxies that spectra of our depth do not show a bias in (Figure 6 of Miller et al., 2011). Benefits of the deeper data (as used in Miller et al., 2011) are smaller errors in (and therefore less scatter) and the ability to probe galaxies with fainter emission lines. Except for the 24 galaxies for which reliable inclinations could not be determined (§2), values of are corrected for galaxy inclinations measured from the images. The results of this paper do not change significantly if these 24 galaxies are removed from the sample.
4.1. What and Measure
The integrated gas velocity dispersion we measure () is unlike the typical pressure-supported velocity dispersion measured for early type galaxies or galaxy bulges. This is the case for two reasons. First, is measured from emission lines which trace the gas in galaxies, as opposed to absorption lines which trace stars. Gas, unlike the collisionless stars in an early type galaxy, can dissipate energy and therefore cannot remain in a high dispersion equilibrium state with crossing orbits. Secondly, because the spectral slits used in the DEEP2 Survey are wide compared to the apparent sizes of the galaxies observed ( slit vs. galaxies), effectively integrates velocity gradients on scales at and below the seeing limit (Weiner et al., 2006a; Covington et al., 2010; Epinat et al., 2010). For values of less than km s-1, which is the upper limit for well-ordered disk galaxies in the local Universe (Figure 15 of Epinat et al., 2010), measures the relative motions of individual star-forming regions in galaxy disks. However, for values of greater than km s-1, integrates over velocity gradients which can correspond to non-ordered gas kinematics such as small-scale velocity gradients, gas motions due to star-formation, or superimposed clumps along the line of sight. In this paper, we collectively refer to these velocity gradients as “disordered motions.”
To test for interference from in measurements of , in §5 we compare measured for galaxies in our mass-limited sample with galaxies from DEEP2 in the same stellar mass range which are face-on in images (i.e., ). We find no significant difference in the trends of with redshift between these two samples, making it unlikely that the rotation velocity of a galaxy interferes with a measurement of its .
To further investigate what and measure, in Covington et al. (2010) we performed mock observations of a suite of simulations of major mergers of disk galaxies. These simulations provided model galaxies in various stages of disorder, ranging the gamut from well-ordered disks to merger remnants. The mock observations were performed just as the actual observations. Galaxies were redshifted to and and seeing, slit width, and detector pixel size were taken into account. Our algorithm for fitting kinematics was found by Covington et al. (2010) to be successful at reproducing , but was found to underestimate by up to 30%, independent of merger stage or redshift. However, as we note above, Miller et al. (2011) did not find a systematic difference in between the deeper data and data similar to ours. Therefore, if is underestimated by up to 30%, it is probably underestimated by this much in both our sample and in the deeper Miller et al. (2011) dataset.
5. Evolution of Galaxy Kinematics
In this section we examine how the kinematics of blue galaxies evolve with redshift. First we examine the full K07 sample, and then we study a mass-limited sub-sample. We return to the full sample again in §7.
5.1. The Full K07 Sample
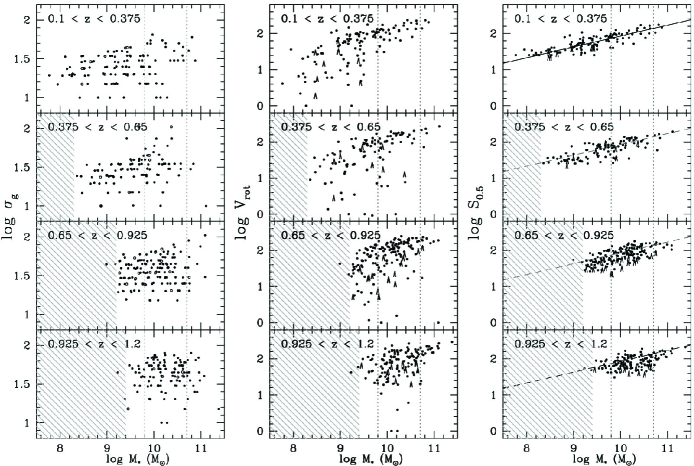
In Figure 2 we show and versus stellar mass in bins of redshift for the K07 sample. The and relations were already shown in K07; here we show the relation for completeness. The versus stellar mass relation (i.e., the stellar mass Tully-Fisher Relation) shows large scatter to low at all redshifts (K07), as does versus stellar mass. However, when and are combined into (a tracer of potential well depth; Weiner et al. 2006a; K07), the resulting relation with stellar mass tightens significantly and does not evolve with redshift since to within uncertainties (K07). Figure 2 also shows that at lower redshift higher mass galaxies have on average larger values of and smaller values of than at higher redshift (K07). It is also clear from this figure that at lower redshift lower mass galaxies have low values of and high values of (K07); they are too faint to be observed at higher redshifts in our sample.
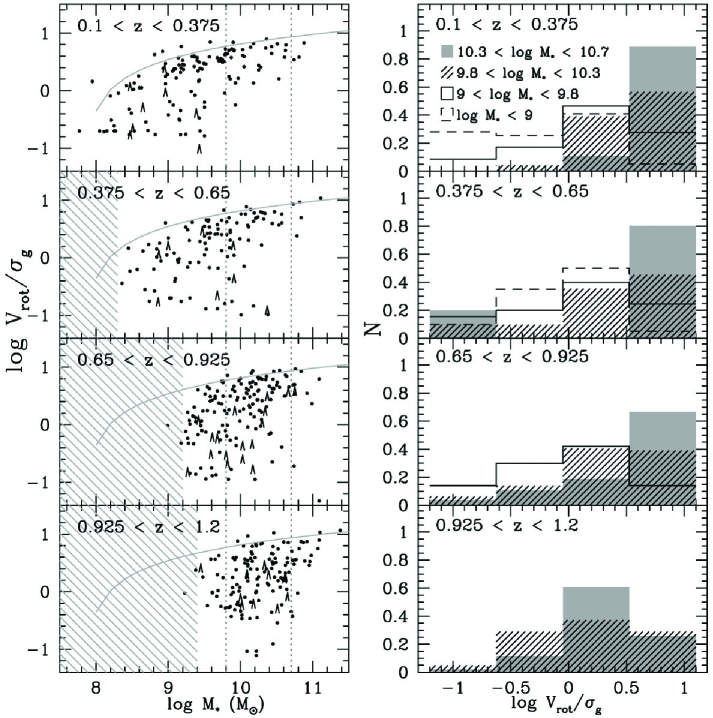
These trends are illustrated more clearly in Figure 3 (left column) where the quantity , the ratio of ordered to disordered motions in a galaxy, is plotted versus stellar mass in bins of redshift.111In the evaluation of , a minimum value of of 15 km s-1, which is the lowest value which we can measure, is adopted to avoid dividing by small numbers with relatively large uncertainties. The galaxies define an upper envelope in versus stellar mass-space which does not evolve since . However, galaxies evolve within the envelope: with increasing time (i.e., decreasing redshift) they move away from the bottom of the plot toward the upper envelope, and this happens first for massive galaxies. This evolution is quantified by the histograms in Figure 3 (right column) which demonstrate that galaxies move towards higher with decreasing redshift (i.e., with time), and the highest-mass galaxies have on average the highest values of at all times.
5.2. A Mass-Limited Galaxy Sample
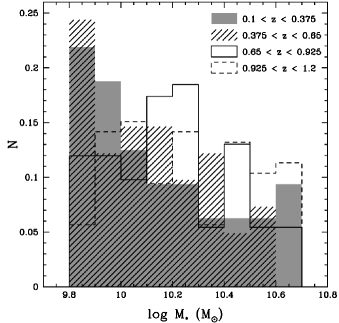
To investigate these trend of with redshift for all but the very lowest and very highest mass galaxies in our sample, we use a mass-limited sample of galaxies with stellar masses over (vertical dotted lines in Figures 1-3), as described in §2. For the remainder of this section and for §6, we will focus on this mass-limited sample of 270 galaxies. In Figure 4, for the mass-limited sample we plot the distribution of galaxy stellar masses among the redshift bins in Figure 3. It shows that the average stellar mass is not the same for all redshift bins: at lower redshifts it is shifted towards lower masses. This is likely because higher mass galaxies are leaving the sample as they transform to red early type galaxies (e.g., Faber et al., 2007). This trend works in the opposite direction to our results, as we will discuss later in this section. Therefore, the evolution we find is interpreted as a lower limit to the intrinsic evolution.
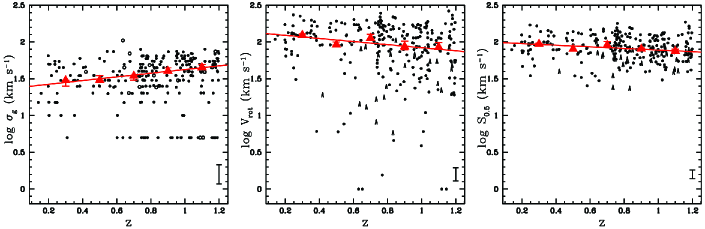
Figure 5 shows the evolution of , and with redshift for the mass-limited sample. All three quantities have large intrinsic scatter. We will demonstrate that a portion of the scatter is due to stellar mass or size in §6. Medians of the individual measurements in bins of redshift are shown as red triangles in Figure 5. Errors on these medians are calculated by bootstrap re-sampling the data in each redshift bin. Bootstrap resampling is used as a standard method for estimating the statistical error without assumptions about the shape of the distribution. We re-sampled with replacement from the data 1000 times, and calculated the dispersion of the sample medians. This dispersion is adopted as the error on the median points. It accounts for the spread in the individual data points due to both intrinsic variation and observational error. The errors on the medians are small because the sample is large and there are many points in each redshift bin.
We fit linear relations to , and versus redshift by performing linear least-squares fits to the binned medians, taking into account the errors on the medians. The results are not sensitive to the redshift bins used. We fit to the medians rather than directly to the data because the distributions of the data points are non-Gaussian and the intrinsic spread of the points is significant compared to the individual error bars, which would cause standard least squares fits to be misleading. To avoid covariances on the fitted parameters, the medians are zero-pointed near the middle of the sample when performing the fits. Of the three quantities, the median shows the strongest evolution (). It increases linearly with redshift to (i.e., decreases with time) as
| (1) |
and the fit has a od 1.1. The median increases from km s-1 at to km s-1 at . The quantity which shows the second-strongest evolution is the median (). It decreases with redshift as
| (2) |
and the fits has a of 16.1. The median decreases from km s-1 at to km s-1 at . Finally, the median shows the weakest evolution of the three kinematic quantities (). It decreases with redshift as
| (3) |
and the fit has a of 2.8. The median decreases from km s-1 at to km s-1 at .
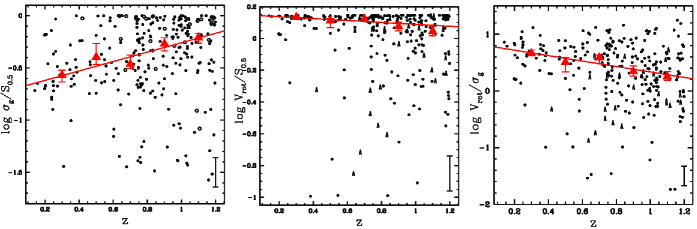
Some of the evolution found may be due to a changing distribution of galaxy masses in the sample with time. This can be caused by galaxies growing in mass and/or high mass galaxies quenching their star-formation and leaving the sample. To address this we remove the dependence on potential well depth by examining ratios with , namely and . These ratios are shown as a function of redshift in Figure 6. They express the fraction of kinematic support which comes from ordered and disordered motions. The median of the ratio decreases with redshift () as
| (4) |
and the fit has a of 4.5. The median of the ratio increases with redshift () as
| (5) |
and the fit has a of 2.3. As before, these are linear least-squares fits to the median points. These ratios demonstrate that the increasing role of and the declining role of with increasing redshift are not due to a changing distribution of galaxy masses in the sample.
The evolution found is interpreted as a lower limit to the intrinsic evolution. As discussed earlier in this section and shown in Figure 4, the average stellar mass of our mass-limited sample is lower at lower redshifts. From Figure 3 it is apparent that on average low mass galaxies have higher and lower than more massive galaxies at any redshift (we will investigate this further in §6). Therefore, our findings that for galaxies in the mass-limited sample the average and are lower and higher, respectively, at lower redshift than at higher redshift are interpreted as lower limits to the intrinsic evolution.
In addition to ratios with , we look at , a ratio of ordered to disordered motions13. This is not an ideal quantity since neither nor is constant with redshift. Nevertheless, due to the significant trends of and with redshift, the median also shows strong evolution (; Figure 6):
| (6) |
with .
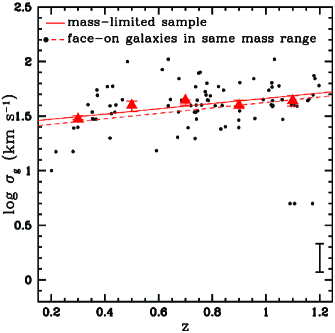
To determine whether the of a galaxy influences the measurement of , in Figure 7 we examine the evolution of with redshift for galaxies which are face-on in images (i.e., °) and in the same stellar mass range as the mass-limited sample. This is a subset of galaxies for which should be completely secure. We find the same evolution in the median to within uncertainties for face-on galaxies: , demonstrating that does not influence the measurement of .
6. Downsizing
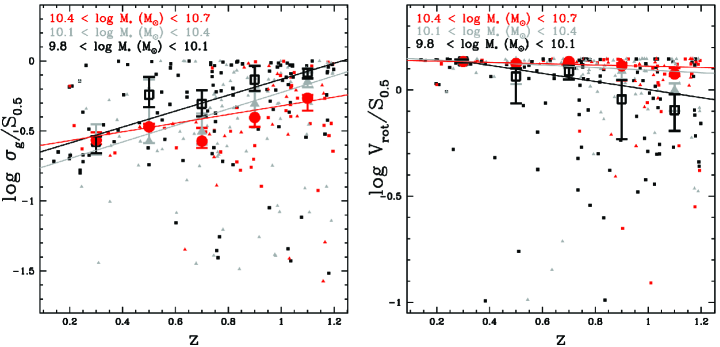
In this section we demonstrate that much of the scatter in the relations of and with redshift is attributable to galaxy properties such as stellar mass and size, and find that trends with stellar mass and size are of similar strengths. We also demonstrate that there is a threshold in stellar mass and size acting at all redshifts which separates galaxies with high and low from those with low and high .
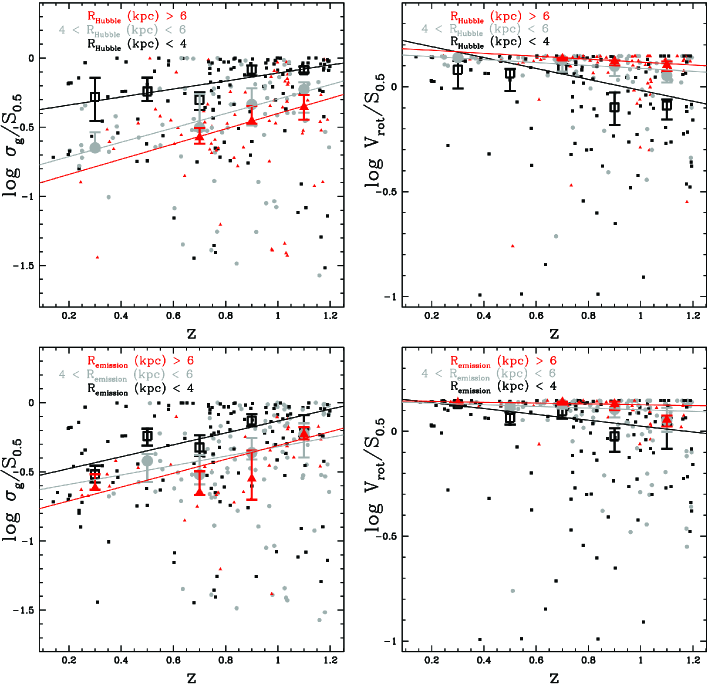
First we consider stellar mass. In Figure 8, as in Figure 6, we show and as a function of redshift for the mass-limited sample. However, in Figure 8 galaxies are divided into three stellar mass bins: , , and . Similar trends to those found for the entire mass-limited sample are also found separately for the three mass bins. Interestingly, it is also evident that at all redshifts examined higher mass galaxies are the most kinematically settled (i.e., higher and lower ), intermediate mass galaxies the next most settled, and low mass galaxies the least settled. This is consistent with downsizing trends in which more massive galaxies attain final structure and star-formation rates sooner (e.g., Cowie et al., 1996), and we refer to this phenomenon as “kinematic downsizing.” Furthermore, there appears to be a threshold at log which separates galaxies with high and low from those with log and high . This is most evident in the median points in Figure 8: those for the lower and intermediate mass bins are very similar, while those for the higher mass bin differ significantly from the other mass bins.
Next we examine trends with size. We consider two size measurements: continuum sizes and emission line extents, as described in §3. sizes are unaffected by seeing, and emission line extents are affected by seeing and are not corrected for it. Figure 9 is similar to Figure 8 except galaxies are color-coded according to size instead of stellar mass. For both size measurements, three size bins are shown: kpc, 4–6 kpc, and kpc. Figure 9 shows that on average at all redshifts examined the largest galaxies are the most kinematically well-ordered, the smallest the most disordered, and intermediate-sized galaxies have properties in between the two. This is the case for both size measurements. It demonstrates that emission lines, which we use to measure galaxy kinematics, are likely good tracers of the spatial distribution of the galaxy continua observed in images. It also demonstrates that we are able to measure reliable rotation velocities for even the small galaxies in our sample. Similar to the stellar mass bins, there is also a size threshold. It is at 4.0 kpc, which corresponds to the threshold in stellar mass (log ) in the size versus stellar mass relation for the mass-limited sample.
Figures 8 and 9 also demonstrate that the evolution in Figures 5 and 6 is not due to a special population of high-redshift galaxies with high values of and low values of . It occurs even if only massive/large galaxies are considered.
7. Settling Fraction
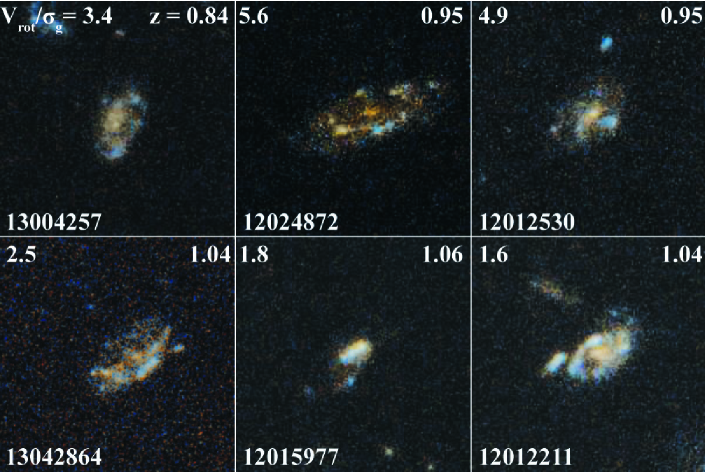
To better quantify how blue galaxies evolve in and , we use these parameters to define a kinematically settled disk galaxy and then study the fraction of settled disk galaxies as a function of stellar mass and redshift. We return again to the full K07 galaxy sample. For the definition of a settled disk, we first look to the distribution of in Figure 3 and then to morphologies. Since we regard higher-mass blue galaxies to be on average kinematically settled disks at low redshift, we look to their values of in Figure 3. A typical value for galaxies with log is (i.e., log ). We now consider morphologies. K07 and S. Kassin et al. (in preparation) show that for the full K07 sample, morphologies are correlated with such that galaxies with normal disk-like morphologies via eyeball inspection have higher values than galaxies which appear more disturbed. We find that indeed provides a reasonable division between normal disk-like and disturbed morphologies, as demonstrated by images of 6 galaxies from the K07 sample in Figure 10. In addition, provides a good separation between the “rotating disks” and “perturbed rotators” in the IMAGES Survey at (Puech et al., 2007, Figure 6). The median for galaxies in the local GHASP Survey (Epinat et al., 2010) is 6.3 with an rms scatter of 3.3, indicating that disk galaxies in the local universe are even more kinematically quiet than those which pass our “settled” criterion.
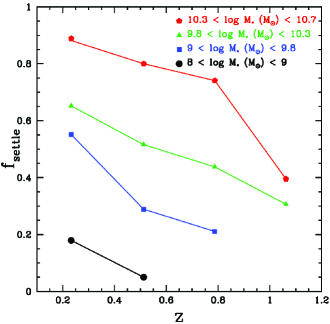
This quantitative definition of a settled disk galaxy (i.e., ) can be used to measure the fraction of blue galaxies which are settled, . The evolution of with redshift for the full K07 sample divided into in four stellar mass bins is shown in Figure 11. All bins show increasing with decreasing redshift (i.e., increasing with time). For example, increases over from 40% to 89% for and from 31% to 65% for . For the less massive bins, we probe smaller ranges in redshift. These are lower limits to the intrinsic evolution, as discussed in §5.2. Furthermore, at all redshifts the higher the stellar mass of the galaxy population, the higher its value of . The same qualitative behavior is found for settled galaxies defined as , except for the lowest mass bin.
8. Kinematic Measurements in the Literature
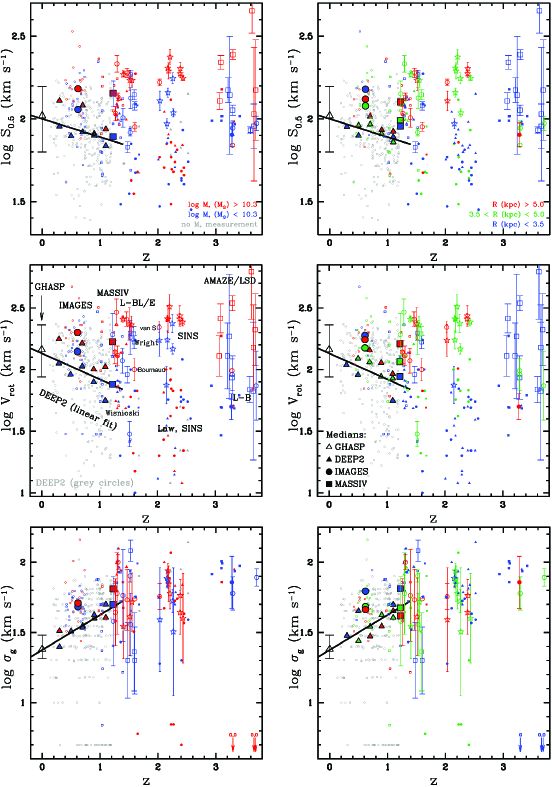
In this section we compare our mass-limited sample with measurements in the literature for local galaxies and for galaxies at similar redshifts. We also compile kinematic measurements from the literature and for galaxies at higher redshifts. Measurements of , and from the literature are shown in Figure 12, and are detailed below in order of increasing redshift. In the panels on the left and right in Figure 12, galaxies are color-coded according to stellar mass (for a Chabrier 2003 initial mass function) and emission-line extent, respectively, unless noted below. The mass-limited sample is also shown in Figure 12 as small grey open circles (labeled “DEEP2”) with sample medians shown as large filled triangles and linear fits to the medians as solid black lines. All literature measurements are from integral field spectroscopy (IFS).
To compare our dataet with local galaxies, a large homogenous sample is needed, and the GHASP survey (Epinat et al., 2010) provides this. Figure 12 shows median values of , and for galaxies in GHASP as large open black triangles at . Error bars on these points depict the rms scatter of the sample. Although GHASP spans a larger range in stellar mass than our mass-limited sample: for a ‘diet’ Salpeter IMF (Epinat et al., 2008) (which is roughly 0.15 dex higher than the Chabrier 2003 IMF used in this paper), the sample medians are consistent with extrapolations of our relations to . Individual stellar mass measurements for galaxies in GHASP are unavailable to create a more comparable sample.
Kinematic measurements for 47 out of 68 galaxies in the IMAGES IFS Survey which have stellar mass measurements in the same range as our mass-limited sample are shown as small open circles in Figure 12 (Puech private communication, Puech et al. 2008, Neichel et al. 2008, Yang et al. 2008). Sample medians are shown as large filled circles at the median redshift of the survey, . The sizes used are continuum half-light radii. Although IMAGES has a similar selection to our survey, the median and of IMAGES are larger than ours at by 0.23 and 0.18 dex, respectively. The measurement methods are sufficiently different for IMAGES compared to our methods that it is difficult to compare the two datasets. However, it is possible that the IMAGES median is higher because, unlike our procedure of fitting for and simultaneously, they are fit for separately in IMAGES. This may result in measurements which are biased high because pixels with the highest signal-to-noise will be ignored when they are fit for separately (e.g., Davies et al., 2011).
The remaining points in Figure 12 plot data for galaxies beyond . Kinematic data are difficult to obtain at these redshifts since emission lines are redshifted to near-infrared wavelengths where the sky is bright in continuum and line emission, making spectroscopy difficult. Pioneering studies of galaxy kinematics at with single-slit near-infrared spectrographs gave the first glimpse of the kinematic state of galaxies at these earlier times, albeit only the most highly star-forming systems (e.g., Erb et al., 2004, 2006). More recently, there has been a boom in IFS observations of galaxy kinematics at these redshifts. However, to obtain enough signal-to-noise to measure kinematics in a reasonable amount of observing time, all samples at these redshifts are unfortunately still biased toward galaxies with the brightest emission lines, which are the most highly star-forming systems.
The first set of points beyond in Figure 12 shows kinematic measurements for 29 out of 46 galaxies from the MASSIV Survey (small open squares; Contini et al., 2012; Vergani et al., 2012). These galaxies have stellar masses in the same range as our mass-limited sample and a median redshift of 1.2. Medians in , , and for the MASSIV sample are shown as large filled squares. The lower mass galaxies in MASSIV () have median values of these quantities which are consistent with the lower mass galaxies in our mass-limited sample. However, the higher mass galaxies () have median values which are greater than the higher mass galaxies in our mass-limited sample. This is especially the case for which has a median value which is 0.20 dex larger than that for the higher mass galaxies in our mass-limited sample at . This difference is most likely due to sample selection, since galaxies in MASSIV are chosen to be the very brightest galaxies in the VVDS Survey (Contini et al., 2012).
Moving to higher redshift in Figure 12, we note that many IFS observations of galaxies at have kinematics which cannot be fit by a rotating disk model. This is due to a few factors: a non-ordered velocity field, small spatial extent, and/or low signal-to-noise. For these galaxies we adopt half of the velocity shear across the face of the system () as , where is the difference between the minimum and maximum rotation velocities and is not corrected for inclination. These galaxies are shown as small filled symbols without error bars in Figure 12 to differentiate them from galaxies which were modeled as rotating disks and are shown as large open symbols with error bars.
For 13 extremely high star-forming galaxies at , we adopt measurements from Wisnioski et al. (2011) which are not modeled as rotating disks (small filled triangles in Figure 12). Next, for 8 galaxies at , we adopt measurements from S. Wright (private communication) for observations presented in Wright et al. (2007, 2009). Galaxies which consist of two or more spatially separated components are treated as individual systems. Four of these galaxies were modeled as rotating disks (large open squares) and four were not (small filled squares). For galaxies which were so modeled, values of are not corrected for galaxy inclinations. For the Wright et al. (2007, 2009) sample, all but the highest value of can be explained by a residual seeing halo, and are therefore not likely physical. For an additional 8 galaxies at , we adopt data from Epinat et al. (2009) and Lemoine-Busserolle & Lamareille (2010) which analyze the same observations. We abbreviate these references as “L-BL/E.” For both studies, 8 galaxies are modeled as rotating disks. Values of and are consistent between the two studies to within uncertainties except for one galaxy, VVDS 020147106. For this galaxy we adopt from Epinat et al. (2009) since their model does not extrapolate significantly beyond the observed velocity field. For the remaining 7 galaxies, fitted quantities from Lemoine-Busserolle & Lamareille (2010) are adopted. These 8 galaxies are shown in Figure 12 as large open circles. We do not show data for two additional galaxies from Lemoine-Busserolle & Lamareille (2010) which were not able to be modeled, one of which is also in Epinat et al. (2009). One of these galaxies, VVDS 020461235, does not have a measurement of . The other galaxy, VVDS 020116027, has a velocity field which differs significantly between the two studies, likely indicating low signal-to-noise. Finally, we show best-fit parameters for one galaxy at from Bournaud et al. (2008) as large open circles in Figure 12.
For galaxies at , data are adopted from the SINS Survey via private communication from N. Förster-Schreiber for the most recent models and data as of August 2011 for galaxies in Genzel et al. (2008), Förster-Schreiber et al. (2009), and Cresci et al. (2009). A total of 14 SINS galaxies were modeled as rotating disks (large open stars in Figure 12), and 33 were not (small filled circles). For galaxies from SINS which were not modeled, we estimate as the line-width less the velocity shear (i.e., from Förster-Schreiber et al. 2009 less ). For an additional 16 galaxies at we adopt data from Law et al. (2009). None of these galaxies were modeled as rotating disks, and they are shown as small filled triangles in Figure 12. Three galaxies from Law et al. (2009) consist of two spatially separated components; we consider each of these components as a separate galaxy. In addition, best-fit parameters for one galaxy at from van Starkenburg et al. (2008) are shown as large open circles labeled “van S.”
For 4 galaxies at , data are adopted from Lemoine-Busserolle et al. (2010). Three of these galaxies are modeled as rotating disks (large open circles in Figure 12 labeled “L-B”) and one is not (filled circle shown enlarged in Figure 12 because it overlaps an error bar for a different galaxy in the and plots). In addition, measurements for 19 galaxies at data are adopted from the AMAZE/LSD Survey via private communication from A. Gnerucci for data from Gnerucci et al. (2011) and Troncoso et al. (in preparation). A total of 12 of these galaxies were modeled as rotating disks (large open squares) and 7 were not (small filled squares).
We will now attempt to summarize the disparate datasets from the literature over . Overall, there is large scatter in , , and , and no clear trends with redshift. While some of the scatter is likely due to the range in stellar masses probed, that there are no trends is probably also due to other factors. Namely, only the brightest galaxies are observed at these redshifts, and instrumental effects and poor observational conditions likely play roles. It is also clear that all high redshift galaxies observed have significant contributions to their kinematics from .
On average, distant galaxies beyond the last redshift of our sample divide into two populations (e.g., Law et al., 2009; Förster-Schreiber et al., 2009): (1) The first consists of large massive galaxies with equal to or slightly greater than the largest values which we measure for DEEP2 galaxies, and which have significant values of . (2) The second population consists of small lower mass galaxies with low or negligible but with significant . These small galaxies are prominent in the Law et al. (2009) sample and the SINS survey, but are also found at lower redshifts in the DEEP2, IMAGES and MASSIV surveys. Some of the observations at may be too shallow to detect the full rotation gradients, so until these galaxies can be observed with significantly longer exposure times to detect possible faint disks, whether or not all of them lack significant is unclear. Interestingly, at , nearly all galaxies are small but have large values of and .
9. Conclusions
We study the internal kinematics of 544 blue galaxies over the last billion years, and find significant evolution. Blue galaxies become progressively more well-ordered with time as disordered motions decrease and rotation velocities increase. In addition, galaxy potential well depths continuously increase with time. At all redshifts the most massive galaxies are on average the most kinematically settled, and the least massive galaxies the least kinematically settled. The lowest mass galaxies in our survey, which are observed only at low redshift, are not well-ordered even today. They may be in the process of settling, or may never become settled disks. There appears to be a threshold at log and 4.0 kpc which separates galaxies with more ordered kinematics from those with more disordered kinematics. All in all, these trends with mass are consistent with downsizing trends for other galaxy properties, and we refer to them as “kinematic downsizing.”
We define a kinematically settled disk galaxy as having a ratio of ordered to disordered motions () greater than 3. We find that the fraction of settled disk galaxies, , increases with time since for all galaxies over . The fraction is larger for more massive galaxy populations, independent of redshift. These qualitative findings do not change if a settled disk galaxy is defined with .
We speculate that the steady kinematic settling seen in our data is due to a combination of factors: (1.) The frequency of mergers may be decreasing with time. Merging, major but more frequently minor, as is expected in a CDM Universe, will stir galaxies up (e.g., Covington et al., 2010). (2.) The amount of mass accreted onto galaxies may be decreasing with time. Mass accretion, although smoother than mergers, might still disturb pre-existing disks (see e.g., Bournaud et al., 2011; Cacciato, Dekel, & Genel, 2012, for a simple analytic treatment). (3.) Galaxies likely have larger molecular gas reservoirs at higher redshift (Daddi et al., 2010; Tacconi et al., 2010). Higher gas fractions should result in more star-formation, and feedback from star-formation may also stir up the gas in galaxies (e.g., Silk & Norman, 2009, and references therein). (4.) Finally, higher gas fractions can also lead to violent disk instabilities (e.g., Bournaud et al., 2011; Cacciato, Dekel, & Genel, 2012, and references therein) which increase random motions, and may also be a step in the direction of more star-formation.
At bottom, the primary causative factors of disk settling are likely two-fold: more merging/accretion and higher gas fractions at early times. Faster star-formation rates are likely byproducts of these two factors, and increasing potential well depths a byproduct of merging/accretion. Since both factors decline with time, a general kinematic settling with time is expected. Furthermore, both factors are apparently declining earlier in massive galaxies, at least since , providing a natural explanation of the kinematic downsizing we find.
It is yet unknown whether disk galaxies in cosmological numerical simulations undergo a kinematic settling akin to what we find in this paper. Only recently have hydrodynamic simulations of galaxy formation been run with enough numerical resolution to study the effects of mass accretion in detail. Simulations find that mass accretes directly onto galaxies from cosmic filaments (e.g., Katz et al., 2003; Birnboim & Dekel, 2003; Kereŝ et al., 2005; Ocvirk et al., 2008; Brooks et al., 2009). The effects of accretion have been studied with small samples of simulated galaxies at (e.g., Bournaud et al., 2009; Ceverino et al., 2010). These studies find that mass accretion perturbs disks and leads to violent disk instabilities, but the effects of accretion have yet to be studied for a representative sample of simulated galaxies at lower redshifts. The simulations which have been run to lower redshifts generally focus on reproducing the photometric and structural properties of galaxies (e.g., Governato et al., 2007, 2009; Brook et al., 2011; Martig et al., 2012, and references therein), and not , , and . On the analytic side, Cacciato, Dekel, & Genel (2012) created a simple model for the kinematic evolution of massive disk galaxies at . They predict that these galaxies, if still around today, are massive disks with similar rotation velocities but less disordered motions, similar to the kinematic settling we find. Numerical simulations are not yet ripe for studies of the kinematic evolution of blue galaxies since , and we look forward to comparisons with future predictions.
Our data are augmented with a compilation of measurements of the kinematics of emission-line galaxies from the literature over . Observations of local massive disk galaxies reveal few examples where disordered motions (as quantified by ) play as an important role as in similar-mass emission-line galaxies at higher redshifts (e.g., Epinat et al., 2010). Measurements of galaxy kinematics at show few clear trends with redshift, likely primarily due to sample selection since only the most highly star-forming systems at these redshifts can currently be studied, but also due to instrumental artifacts and observational conditions. However, it is clear that higher redshift galaxies have a significant amount of disordered motions, whether or not they show evidence of rotation.
In summary, galaxies seem to have a life cycle: Early in their lives they are accreting baryons rapidly, undergoing mergers, and possess a large amount of gas. Later in their lives the accretion decreases along with their gas content. Kinematic settling appears to be a natural, additional facet of this basic evolutionary arc.
References
- Abraham et al. (1996) Abraham, R. G., van den Bergh, S., Glazebrook, K. et al. 1996, ApJS, 107, 1
- Abraham & van den Bergh (2001) Abraham, R. G. & van den Bergh, S. 2001, Science, 293, 1273
- Bell & de Jong (2001) Bell, E. F. & de Jong, R. S. 2001, ApJ, 550, 212
- Bell et al. (2004) Bell, E. F., Wolf, C., Meisenheimer, K. et al. 2004, ApJ, 608, 752
- Bertin & Arnouts (1996) Bertin, E. & Arnouts, S. 1996, A&AS, 117, 393
- Birnboim & Dekel (2003) Birnboim, Y. & Dekel, A. 2003, MNRAS, 345, 349
- Blumenthal et al. (1984) Blumenthal. G. R., Faber, S. M., Primack, J. R., & Rees, M. J. 1984, Nature, 311, 517
- Borch et al. (2006) Borch, A., Meisenheimer, K., Bell, E. F. et al. 2006, A&A, 453, 869
- Bournaud et al. (2008) Bournaud, F., Daddi, E., Elmegreen, B. G. et al. 2008, A&A, 486, 741
- Bournaud et al. (2009) Bournaud, F., Elmegreen, B. G., & Martig, M. 2009, ApJL, 707, 1
- Bournaud et al. (2011) Bournaud, F., Dekel, A., Teyssier, R. et al. 2011, ApJL, 741, 33
- Brook et al. (2011) Brook, C. B., Governato, F., Roškar, R. et al. 2011, MNRAS, 415, 1051
- Brooks et al. (2009) Brooks, A. M., Governato, F., Quinn, T., Brook, C. B., & Wadsley, J. 2009, ApJ, 694, 396
- Bundy et al. (2006) Bundy, K., Ellis, R. S., Conselice, C. J. et al. 2006, ApJ, 651, 120
- Cacciato, Dekel, & Genel (2012) Cacciato, M., Dekel, A., & Genel, S. 2012, MNRAS, 421, 818
- Catinella et al. (2012) Catinella, B. et al. 2012, MNRAS, 420, 1959
- Ceverino et al. (2010) Ceverino, D., Dekel, A., & Bournaud, F. 2010, MNRAS, 404, 2151
- Chabrier (2003) Chabrier, G. 2003, PASP, 115, 763
- Conselice et al. (2005) Conselice, C. J., Bundy, K., Ellis, R. S., Brichmann, J., Vogt, N. P., & Phillips, A. C. 2005, ApJ, 628, 160
- Contini et al. (2012) Contini, T., Garilli, B., Le Fèvre, O. et al. 2012, A&A, 539, 91
- Covington et al. (2010) Covington, M., Kassin, S. A., Dutton, A. A. et al. 2010, ApJ, 710, 279
- Cowie et al. (1996) Cowie, L. L., Songaila, A., Hu, E. M. & Cohen, J. G. 1996, AJ, 112, 839
- Cresci et al. (2009) Cresci, G., Hicks, E. K. S., Genzel, R. et al. 2009, ApJ, 697, 115
- Daddi et al. (2010) Daddi, E., Bournaud, F., Walter, F. et al. 2010, ApJ, 713, 686
- Davies et al. (2011) Davies, R., Förster Schreiber, N. M., Cresci, G. et al. 2011, ApJ, 741, 69
- Davis et al. (2007) Davis, M., Guhathakurta, P., Konidaris, N. P. et al. 2007, ApJL, 660, 1
- Drory et al. (2009) Drory, N., Bundy, K., Leauthaud, A. et al. 2009, ApJ, 707, 1595
- Dutton et al. (2011) Dutton, A. A., van den Bosch, Frank C., Faber, S. M. et al. 2011, MNRAS, 410, 1660
- Epinat et al. (2008) Epinat, B., Amram, P., Marcelin, M. et al. 2008, MNRAS, 388, 500
- Epinat et al. (2009) Epinat, B., Contini, T., Le Fèvre, O. et al. 2009, A&A, 504, 789
- Epinat et al. (2010) Epinat, B., Amram, P., Balkowski, C., & Marcelin, M. 2010, MNRAS, 401, 2113
- Erb et al. (2004) Erb, D. K., Steidel, C. C., Shapley, A. E., Pettini, M., & Adelberger, K. L. 2004, ApJ, 612, 122
- Erb et al. (2006) Erb, D. K., Steidel, C. C., Shapley, A. E. et al. 2006, ApJ, 646, 107
- Faber et al. (2003) Faber, S. M., Phillips, A. C., Kibrick, R. I. et al. 2003, SPIE, 4841, 1657
- Faber et al. (2007) Faber, S. M., Willmer, C. N. A., Wolf, C. et al. 2007, ApJ, 665, 265
- Fall & Efstathiou (1980) Fall, S. M. & Efstathiou, G. 1980, MNRAS, 193, 189
- Flores et al. (2006) Flores, H., Hammer, F., Puech, M., Amram, P., & Balkowski, C. 2006, A&A, 455, 107
- Förster-Schreiber et al. (2009) Förster-Schreiber, N. M., Genzel, R., Bouché, N. et al. 2009, ApJ, 706, 1364
- Genzel et al. (2008) Genzel, R., Burkert, A., Bouché, N. et al. 2008, ApJ, 687, 59
- Gnerucci et al. (2011) Gnerucci, A., Marconi, A., Cresci, G. et al. 2011, A&A, 528, 88
- Governato et al. (2007) Governato, F., Willman, B., Mayer, L. et al. 2007, MNRAS, 374, 1479
- Governato et al. (2009) Governato, F., Brook, C. B., Brooks, A. M. et al. 2009, MNRAS, 398, 312
- Griffiths et al. (1994) Griffiths, R. E., Casertano, S., Ratnatunga, K. U. et al. 1994, ApJL, 435, 19
- Kassin, de Jong, & Weiner (2006) Kassin, S. A., de Jong, R. S., & Weiner, B. J. 2006, ApJ, 643, 804
- Kassin et al. (2007) Kassin, S. A., Weiner, B. J., Faber, S. M. et al. 2007, ApJL, 660, 35
- Katz et al. (2003) Katz, N., Keres, D., Dave, R., & Weinberg, D. H. 2003, in The IGM/ Galaxy Connection, ed. M. Putman & J. Rosenberg (Dordrecht: Kluwer), 185
- Kereŝ et al. (2005) Kereŝ, D., Katz, N., Weinberg, D. H., & Davé, R. 2005, MNRAS, 363, 2
- Kimm et al. (2011) Kimm, T., Devriendt, J., Slyz, A. et al. 2011, arXiv:1106.0538
- Law et al. (2009) Law, D. R., Steidel, C. C., Erb, D. K. et al. 2009, ApJ, 697, 2057
- Lemoine-Busserolle et al. (2010) Lemoine-Busserolle, M., Bunker, A., Lamareille, F., & Kissler-Patig, M. 2010, MNRAS, 401, 1657
- Lemoine-Busserolle & Lamareille (2010) Lemoine-Busserolle, M. & Lamareille, F. 2010, MNRAS, 402, 2291
- Lin et al. (2007) Lin, L., David C., Weiner, B. J. et al. 2007, ApJL, 600, 51
- Lotz et al. (2008) Lotz, J. M., Davis, M., Faber, S. M. et al. 2008, ApJ, 672, 177
- Martig et al. (2012) Martig, M., Bournaud, F., Croton, D. J., Dekel, A., & Teyssier, R. 2012, arXiv:1201.1079
- Miller et al. (2011) Miller, S. H., Bundy, K., Sullivan, M., Ellis, R. S., & Treu, T. 2011, ApJ, 741, 115
- Miller et al. (2012) Miller, S. H., Ellis, R. S., Sullivan, M. et al. 2012, ApJ, 753, 74
- Neichel et al. (2008) Neichel, B., Hammer, F., Puech, M. et al. 2008, A&A, 484 159
- Newman et al. (2012) Newman, J. A., Cooper, M. C., Davis, M. et al. 2012, ApJS submitted, arXiv:1203.3192
- Noeske et al. (2007) Noeske, K. G., Weiner, B. J., Faber, S. M. et al. 2007, ApJL, 660, 43
- Ocvirk et al. (2008) Ocvirk, P., Pichon, C., & Teyssier, R. 2008, MNRAS, 390, 1326
- Pizagno et al. (2007) Pizagno, J., Prada, F., Weinberg, D. H. et al. 2007, AJ, 134, 945
- Pozzetti et al. (2010) Pozzetti, L., Bolzonella, M., Zucca, E. et al. 2010, A&A, 523, 13
- Puech et al. (2007) Puech, M., Hammer, F., Lehnert, M. D., & Flores, H. 2007, A&A, 466, 83
- Puech et al. (2008) Puech, M., Flores, H., Hammer, F. et al. 2008, A&A, 484, 173
- Puech et al. (2010) Puech, M., Hammer, F., Flores, H. et al. 2010, A&A, 510, 68
- Rees & Ostriker (1977) Rees, M. J. & Ostriker, J. P. 1977, MNRAS, 179, 541
- Silk & Norman (2009) Silk, J. & Norman, C. 2009, ApJ, 700, 262
- Simard et al. (2002) Simard, L., Willmer, C. N. A., Vogt, N. P. et al. 2002, ApJS, 142, 1
- Tacconi et al. (2010) Tacconi, L. J., Genzel, R., Neri, R. et al. 2010, Nature, 463, 781
- van Starkenburg et al. (2008) van Starkenburg, L., van der Werf, P. P., Franx, M. et al. 2008, A&A, 488, 99
- Vergani et al. (2012) Vergani, D., Epinat, B., Contini, T. et al. 2012, A&A accepted, arXiv:1202.3107
- Verheijen (1997) Verheijen, M. A. W. 1997, Ph.D. thesis, Rijksuniversiteit Groningen
- Weiner et al. (2006a) Weiner, B. J., Willmer, C. N. A., Faber, S. M. et al. 2006, ApJ, 653, 1027
- Weiner et al. (2006b) Weiner, B. J., Willmer, C. N. A., Faber, S. M. et al. 2006, ApJ, 653, 1049
- White & Rees (1978) White, S. D. M. & Rees, M. J. 1978, MNRAS, 183, 341
- Willmer et al. (2006) Willmer, C. N. A., Faber, S. M., Koo, D. C. et al. 2006, ApJ, 647, 853
- Windhorst et al. (1995) Windhorst, R. A., Fomalont, E. B., Kellermann, K. I. et al. 1995, Nature, 375, 471
- Wisnioski et al. (2011) Wisnioski, E. et al. 2011, MNRAS, 422, 3339
- Wright et al. (2007) Wright, S., Larkin, J. E., Barczys, M. et al. 2007, ApJ, 658, 78
- Wright et al. (2009) Wright, S., Larkin, J. E., Law, David R. et al. 2009, ApJ, 699, 421
- Yang et al. (2008) Yang, Y., Flores, H., Hammer, F. et al. 2008, A&A, 477, 789