The effect of Warm Dark Matter on galaxy properties: constraints from the stellar mass function and the Tully-Fisher relation
Abstract
In this paper we combine high resolution N-body simulations with a semi analytical model of galaxy formation to study the effects of a possible Warm Dark Matter (WDM) component on the observable properties of galaxies. We compare three WDM models with a dark matter mass of , and keV, with the standard Cold Dark Matter case. For a fixed set of parameters describing the baryonic physics the WDM models predict less galaxies at low (stellar) masses, as expected due to the suppression of power on small scales, while no substantial difference is found at the high mass end. However these differences in the stellar mass function, vanish when different set of parameters are used to describe the (largely unknown) galaxy formation processes. We show that is possible to break this degeneracy between DM properties and the parameterization of baryonic physics by combining observations on the stellar mass function with the Tully-Fisher relation (the relation between stellar mass and the rotation velocity at large galactic radii as probed by resolved HI rotation curves). WDM models with a too warm candidate ( keV) cannot simultaneously reproduce the stellar mass function and the Tully-Fisher relation. We conclude that accurate measurements of the galaxy stellar mass function and the link between galaxies and dark matter haloes down to the very low-mass end can give very tight constraints on the nature of DM candidates.
Subject headings:
methods: analytical – galaxies: mass function – galaxies: formation – cosmology: theory – dark matter – large-scales structure of Universe1. Introduction
The Cold Dark Matter (CDM) paradigm successfully describes the formation of large-scale structure in the Universe (e.g., Springel et al. 2006). On small scales, the CDM model faces inconsistencies with observations. For example, CDM model over-predicts the number of satellites in the Milky Way (e.g. Klypin et al. 1999), predicts cuspy density profile for the dark matter halo (e.g. Moore et al. 1999), and a too large kinematics for massive satellites (Boylan-Kolchin et al. 2011).
These small-scale problems in CDM all arise from the comparison of pure N-body simulations with observational data. Recently it has been shown that some of those problems could be alleviate by the inclusion of baryonic physics, due to its back-reaction on the properties of dark matter haloes. For example, UV background, reionization and supernova feedback can act together to suppress the formation of dwarf satellites in the Milky Way (e.g. Bullock et al 2001, Macciò et al. 2010), the inner halo density profile becomes more flat when star formation and feedback are included (e.g. Mashchenko et al. 2008, Pontzen & Governato 2012, Macciò et al. 2012). However, these baryonic effects are difficult to model and still strongly rely on simple parameterization for complex physical processes (the so called sub-grid physics)
Another possible solution is to suppress the excess of power at small scales in the Dark Matter distribution by changing the properties of the dark matter candidate. Among many of these different approaches, the Warm Dark Matter (WDM) model is the most intriguing as it naturally preserves the large-scale structure of the CDM model (Alam et al.2002; Zentner & Bullock 2002). Many authors have shown that the WDM model can relax some tensions between observations and theoretical predictions using pure N-body simulations (Colin et al. 2000, Bode et al. 2001, Gotz & Sommer-Larsen 2002, Knebe et al. 2008, Colin et al. 2008, Tikhonov et al 2009, Lovell et al.2012, Macciò et al. 2012b).
One possible WDM candidate is a sterile neutrino which exhibit a significant primordial velocity distribution and thus damp primordial inhomogeneities on small scales (e.g. Hansen et al. 2002, Abazajian & Koushiappas 2006, Boyarsky et al. 2009). Limits on the mass of dark matter particles can be obtained from several astrophysical observations: one of the most powerful tool for constraining the matter power spectrum are Lyman- forest observations (neutral hydrogen absorption in the spectra of distant quasars, Narayanan et al. 2000, Viel et al. 2005, Seljack et al. 2006). Lyman- observations allows the possibility to studying the power spectrum down to small scales and over a large range of redshifts. Current observations set a lower limit of keV (Viel et al. 2008).
These limits have been confirmed by other observations based on different methods like QSO lensing (Miranda & Macciò 2007), luminosity function of high redshift QSOs (Song & Lee 2009), dwarf galaxies in the Local Volume (Zavala et al. 2009), the size of (min)-voids around the Local Group (Tikhovov et al. 2009) and Milky Way satellites (Macciò & Fontanot 2010).
Up to now, most studies based on numerical simulations have focused their attention on the internal structure and kinematics of nearby galaxies in the Warm Dark Matter model, while very few have explored the effect that a warm candidate will have on the properties of the general galaxy population, such as the luminosity function, the stellar to halo mass function and so on.
A notable exception is the recent paper by Menci et al. (2012), although not directly based on N-body simulations in WDM. In their study the authors combined a Semi Analytical Model for galaxy formation with the Extended Press and Shechter formalism (e.g. Cole et al. 2000, Lacey & Cole 1993) to obtain the properties of galaxy in a WDM model. They found that the WDM model can produce a more flat slope for the faint end of the luminosity function in better agreement with the observations. They also argue that other galaxy properties better match observations when a warm candidate is used instead than a cold one. While these effects are certainly true, the adoption of a Warm Dark Matter like spectrum has also strong influence on the ratio between dark matter and stellar mass in galaxies. This ratio that can be constrained by several dynamical mass estimators such as the Tully-Fisher relation (Tully & Fisher 1977), satellites kinematics, and weak gravitational lensing.
In this paper we combine high resolution N-body simulations for the standard CDM scenario and three WDM candidates keV, with the Semi Analytical Models first presented in Kang et al. (2005), and then successively expanded and improved in Kang & van den Bosch (2008) and Kang et al. (2012). Our aim is to study the impact of different WDM models on galaxy properties and use different observations to try to disentangle the effects of a warm candidate from the different parameterization of the baryonic physics adopted in the SAM. The final goal is to constrain the properties of the dark matter candidate.
The paper is organized as follows: We introduce the simulations and model in §2, show the model predictions in comparison to observations in §3, and conclude in §4.
2. N-body simulations and galaxy formation model
In the WDM model, the velocity dispersion of dark matter particles defines a characteristic free-streaming scale, below which the perturbation will be suppressed. The free-streaming scale can be described as (Bode et al. 2001),
| (1) |
The lighter the particle mass is, the larger the scale below which perturbations will be suppressed. It also possible to define a free-streaming mass scale as, (where is the critical density of the Universe), and the initial density perturbations are practically erased on masses below . The impact of the free-streaming on the power spectrum can be described using a modified transfer function as suggested in Bode et al. (2001):
| (2) |
Where and are the linear power spectrum in the WDM and CDM models. Viel et al.(2005) using a Boltzmann simulation code found that , and can be directly related to the mass of the warm dark matter particles and the matter density parameter in the following way:
| (3) |
We used the above equations, to derive the initial power spectrum for our WDM models, and take it as input for generating the initial conditions of our N-body simulation.
The cosmological parameters are set in agreement with those derived from the WMAP7 data release (Komatsu et al. 2011), namely: =0.73, =0.27, =0.044, and . The simulations have been run using the gadget-2 code (Springel 2005) in a box of Mpc/h using particles. This sets our mass resolution to and the softening to . We run three different WDM models for a thermal candidate with particle mass of , and keV respectively. Finally, readers are refereed to Kang et al. (2005) for details on the halo finder and how we construct merger trees from the simulations.
The Semi Analytical Model (SAM) of galaxy formation we employ in this study is based on the model of Kang et al. (2005, 2006). This SAM self-consistently models the physical processes governing stellar mass evolution, such as gas cooling, star formation, supernova and active galactic nucleus (AGN) feedback. The latest incarnation of this model had been recently presented in Kang et al. (2012) and we refer the reader to this paper for more details. As in Kang et al. (2012), we slightly modified the cooling rate of low-mass haloes as,
| (4) |
where is the cooling factor. As described in Kang et al. (2012), this formula can be interpreted as an effective rate for gas cooling, that takes into account the gas outflow due to reheating by supernova feedback.
Kang et al. (2012) has shown that a low value for is needed to better reproduce the slope of the low-mass end of the galaxy stellar mass function in the CDM model. We will show later in §3 that for the WDM models, due to lower power on small scales, this cooling factor has to be increased to match the local stellar mass function.
3. Results
In the WDM model, the formation of haloes with mass below the free-streaming scales is suppressed. For the model with keV, the free-streaming mass is about . Actually also the formation of halo more massive than this cut-off can also be affected up to a mass of the order of (e.g. Schneider et al. 2012).
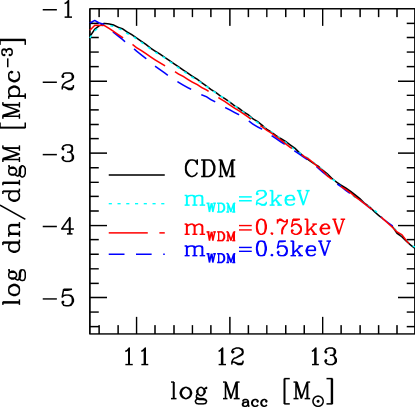
In Fig. 1 we show the dark matter halo mass functions for our different models. Note that this mass function is slightly different from the usual mass function that normally only includes Friends Of Friends (FOF) haloes (i.e. central haloes). In our mass function we also include satellite halos: their mass is defined as the mass at the accretion time , in other words the mass the satellite had before becoming a satellite of a more massive halo. It has been shown that this accretion mass is more closely related to the final stellar mass of the satellite (e.g., Vale & Ostriker 2004, Moster et al. 2010). For central halos, the mass is simply defined as the virial mass at the current time. Such a mass function which also includes satellite galaxies can be easily linked to the predicted galaxy mass functions, which is one of the observations we want to study in Warm Dark Matter.
For our more extreme WDM model with keV, the halo number density is lower by roughly 60% at . This confirms that the free-streaming in WDM has non-negligible effects on the formation of haloes with mass much larger than . On the other hand the model with keV, has a cutoff mass of which is well below the mass resolution of our simulations, as a consequence we do no see any differences with respect to the CDM model on the whole mass range probed by our runs. The warmest model also presents an upturn in the halo mass function around . This upturn is due to the artificial clumping effect in WDM simulations from the limited resolution (Wang & White 2007; Schneider et al. 2012), which indicates that low mass haloes are possibly over-predicted in our simulations. We will later briefly discuss the implication of this effect on the prediction of galaxy properties. Finally all model agree reasonably well for masses higher than , so we do not expect large differences for the properties of galaxies living in massive haloes.
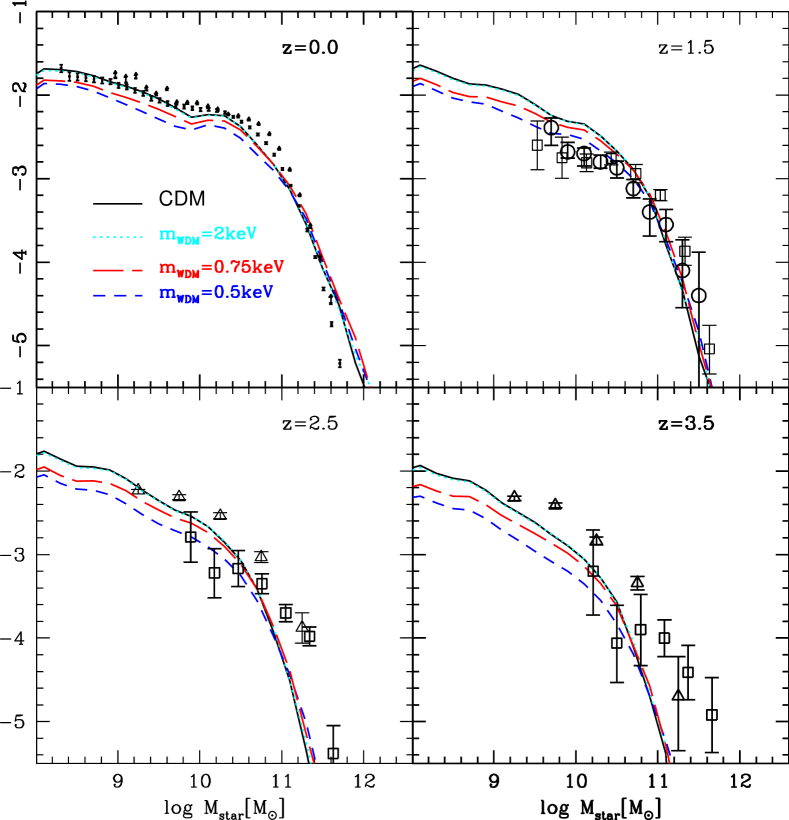
By applying the Semi Analytical Model to the N-body simulations it is possible to compute properties of the galaxies harbored in the dark matter haloes in the various WDM and CDM models. Fig. 2 shows the stellar mass functions from to . In this first attempt we apply the same SAM (with the same parameters) to all the models.
At the WDM model with lower produces too few galaxies around with respect to current observational data; this is a direct consequence of the lower normalization to the halos mass function below in WDM with respect to CDM. The model for 0.75 keV gives a stellar mass function between the previous model and the CDM prediction, while the model with keV produces almost identical results to the CDM model (as expected from the results on the halo mass function) and we will not show its results in the rest of the paper. The fact that WDM models seem to produce too few galaxies at low stellar masses with respect to observations does not come as a surprise. The parameters in the SAM we use have been tuned to reproduce the stellar mass function at in the (standard) CDM scenario, so any models that predict less low mass dark matter haloes will, by construction, underpredict the number of galaxies at low stellar mass.
Results are somewhat inverted at higher redshift. The CDM model overpredicts the number of galaxies with a stellar mass below . This is a well know problem of the current modeling of galaxy formation (e.g., Fontanot et al. 2010, see Weinmann et al. 2012 for a thorough description of this issue). In this case having a warm dark matter component naturally helps in reducing the number of low mass haloes, and consequently the number of low (stellar) mass galaxies, bringing SAM results in better agreement with observations. But of course this “success” comes at the sacrifice of local () agreement.
Recently Menci et al. (2012) used this suppression of stellar mass function at high redshift in warm dark matter model as a hint that WDM may help in reducing the tension between data and theoretical prediction at high redshift. In their case the adopted SAM was also overpredicting the luminosity function at for the CDM model, where on the contrary our SAM+CDM model provides a good fit to the local data. So having a WDM component in the case of Menci et al. (2012) was helping on both high and low redshift.
What remains to be clarified is whether the success of WDM claimed by these authors is truly due to the WDM component or simply reflects a non-optimal parameterization of the physics of galaxy formation implemented in their SAM (that could partially be the explanation of the failure of the CDM scenario in their model at both high and low luminosities, at and ).
In the same paper Menci and collaborators also found an effect of WDM on the high luminosity tail of the luminosity function. Our results do not show such an effect – all our models give the exact same prediction at high stellar masses. This result is somehow expected given the similarity of the halo mass function at high masses (see Fig. 1). Menci et al. claimed that this difference was due to the different accretion rates of satellites in massive haloes. SAMs have been show to have problems in modelling the properties of satellites in high mass haloes (e.g., Weinmann et al. 2010, Liu et al. 2010 and references therein). This again raises the question whether the effect seen by Menci and collaborators (but not in this work) is a true effect due to warm dark matter, or simply reflects the specific way in which baryonic physics is implemented in their semi analytical model. We will address this issue of degeneracy between SAM parameters and DM properties in the next section.
3.1. Degeneracy between SAM parameters and WDM
The failure of WDM models in matching the redshift zero stellar mass function does not imply that WDM models are somehow “wrong”; the reason for this resides in the large uncertainty of baryonic physics parameterization in the SAMs. Obviously the same argument applies to the “success” of WDM models in reproducing the observational data at low-mass end at high redshift.
Fig. 2 suggests that the stellar mass in low-mass halo is too low in WDM models. One possible solution would be to increase the star formation efficiency or decrease the effect the supernova feedback in the model, but this affect the high mass tail of the stellar mass function, where all models perform equally well.
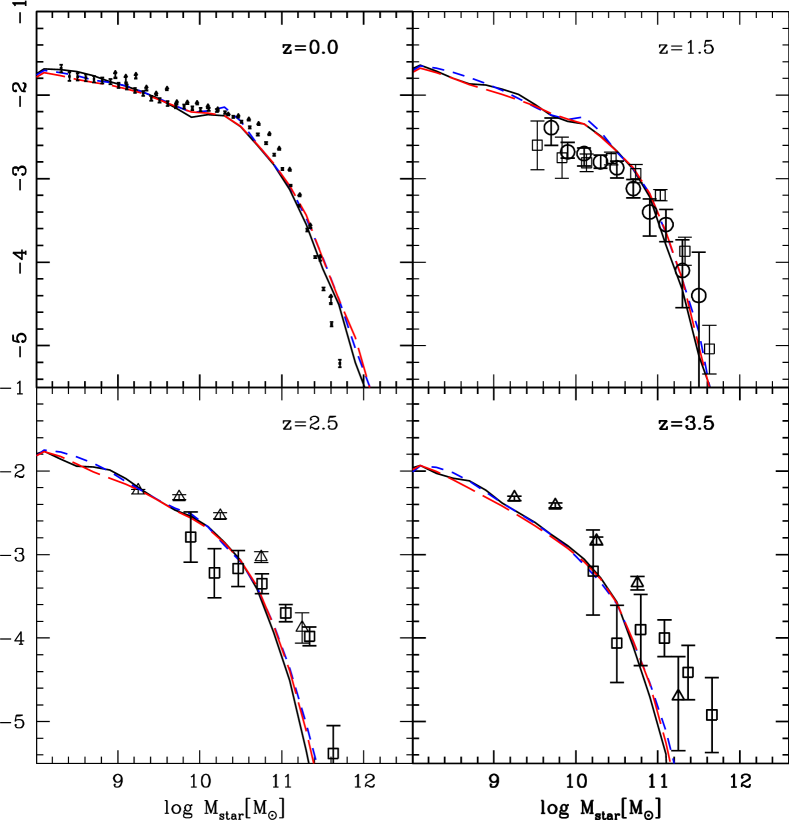
Instead we decided to turn to the effective cooling factor given in eq. 4, since this factor is introduced only for low-mass haloes. To get a better match to the local stellar mass function, we set and in the WDM models with and keV, respectively.
Fig. 3 shows the model predictions for these new values of . With this new effective cooling factor both WDM models (0.5 and 0.75 keV) provide equally good fit to the data at as the CDM model. On the other hand they now show the same over-prediction of galaxies at as CDM. This is due to the very similar evolution of WDM and CDM models (see Fig. 1 in Weinmann et al. 2012).
Overall we find that by simply tweaking one single parameter we have been able to get the exact same predictions in WDM and CDM models. This shows the danger in using a single observable (e.g. the stellar mass function) to claim the success of one dark matter model over another. In the next section we will try to combine different observables to break the degeneracy between the DM properties and the parameterization of baryonic effects in SAMs.
3.2. Constraining WDM with the stellar-to-halo mass ratio
In Fig. 3 we have shown that better match to the local stellar mass function can be achieved in the WDM models by increasing the parameter in low-mass haloes. Of course this has the consequence of increasing the stellar mass content in low mass haloes.
This increased ratio between stellar and halo mass can be constrained using several independent observations. The halo mass can be directly measured for stacks of galaxies using galaxy-galaxy weak lensing (e.g., Mandelbaum et al. 2006; Leauthaud et al. 2012a,b) or satellite kinematics (e.g., Conroy et al. 2007; More et al. 2011), and inferred assuming halo abundance matching (Moster et al. 2010). A closely related quantity to the halo mass is the maximum circular velocity of the dark matter halo. The best observational probe of this is the rotation velocity in the “flat” part of the rotation curve, , as traced by 21cm observations of neutral hydrogen. We refer to the relation between stellar mass and outer rotation velocity as the Tully-Fisher relation, even though the original relation from Tully & Fisher (1977) was between B-band luminosity and 21cm linewidth.
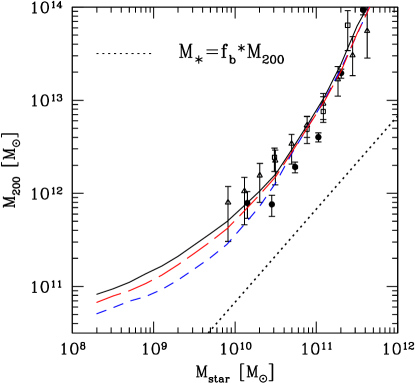
In Fig. 4 we show the halo mass to stellar mass relation at for our WDM models (with different ) and the CDM model. Data points with error-bars are measured stellar to halo mass ratio from weak lensing and satellite kinematics (see Leauthaud et al. 2012a for a discussion of the different data sets.). The dotted line shows the maximum stellar mass in given halo mass assuming the universal baryon fraction, from the WMAP7 cosmology.
While the three models give the same stellar mass function (as shown in Fig. 3), they do predict different halo-to-stellar mass ratios especially for halo masses below . For a give halo mass the WDM models predict a large stellar mass with this difference increasing for decreasing values. Unfortunately, the current weak lensing and satellite kinematics observations do not probe halo masses below .
3.3. Constraining WDM with the Tully-Fisher relation
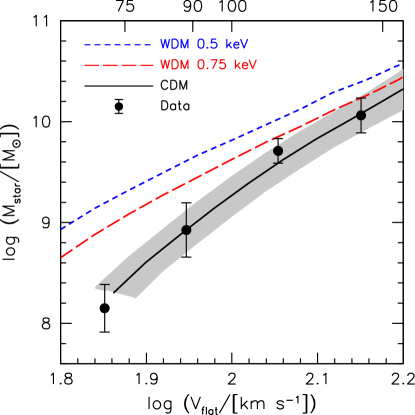
For haloes with masses in the range , the best current probe of the halo masses comes from the Tully-Fisher relation. This constraint is shown in Fig. 5. As before the observations are shown with points and error bars, while the models are shown with lines. For the observations the points show mean of in bins of outer rotation velocity, with the error bar corresponding to the error on the mean. There are typically galaxies per velocity bin. The observations are from the compilations of Stark et al. (2009) and McGaugh (2012). We calculate stellar masses using relations from Bell et al. (2003) (with a dex correction to convert to a Chabrier 2003 IMF). We also convert the Hubble parameter from 75 to 70.
For the models we compute the circular velocity at a radius enclosing 80% of the cold gas, . At this radius model rotation curves tend to be flat (Dutton 2009). The SAM does not provide radial information for the stars, gas, or dark matter, so we use empirical constraints (from Dutton et al. 2011) for the stars and theoretical constraints (Maccio et al. 2008; Schneider et al. 2012) for the dark matter. We assume the stars and cold gas are in exponential disks, with the scale length of the cold gas being 1.55 times larger than that of the stellar disk (Dutton et al. 2011). We determine the average disk size using the size vs stellar mass relation for late-type galaxies from Dutton et al. (2011). Thus for a given stellar mass in the model, we know the average radius we should be measuring the rotation velocity, and the contribution of the stars and cold gas to this velocity. For the dark matter and hot gas we assume the profiles are NFW. For the CDM case we adopt the concentration mass relation from Macciò et al. (2008) for a WMAP5 cosmology (which is very similar to that of the cosmology adopted here). For the WDM models we scale the concentration parameters according to the fitting formula of Schneider et al. (2012). We also consider two possiblities for the halo response to the baryonic mass, either by contraction (Gnedin et al. 2004) or expansion (Dutton et al. 2011). Their effects are shown as the shaded region in Fig. 5.
Fig. 5 shows that the CDM model reproduces the data well, whereas at a fixed velocity the WDM models have higher stellar masses, especially at low velocities. At a velocity of the differences are substantial: a factor of between CDM and 0.75 keV WDM, and a factor of between 0.5 and 0.75 keV WDM. These large differences are due to two effects. Firstly, as shown in Fig. 4 at fixed halo mass WDM models have higher stellar masses. Secondly, WDM models have lower concentration haloes, which results in lower rotation velocities, and hence higher stellar mass at fixed velocity. We found that the second effect is the dominant one, as in the first case simply increasing the stellar will also increase the circular velocity.
In summary the CDM model provides a good match to the data (note that the model was not tuned to match the TF relation), whereas both both WDM models overpredict the stellar masses at fixed velocity. The limit of keV that we find here is consistent with current limits from large scale structure (e.g. Viel et al. 2008).
4. Conclusions
Recent observational results have challenged the otherwise successful Cold Dark Matter model on small scales. For example the inner density profile of dark matter halo is too concentrated to match the kinematics of satellites around the Milky Way (e.g. Boylan-Kolchin et al. 2011). Warm Dark Matter models have been suggested as a possible solution since the suppression of power on small scales can in principle alleviate if not solve these issues (e.g. Lovell et al. 2012).
However, Most of the CDM predictions are based on gravitational only (N-body) simulations, which by construction neglect the effects of baryons and their complicated network and interactions through gas cooling, star formation and feedback that could possibly alter the results of pure DM simulations (e.g. Governato et al. 2012, Brooks et al. 2012) It is then important to investigate the prediction of CDM and WDM on the statistical properties of galaxy population, moving beyond a simple DM simulation.
In this paper, we performed high-resolution N-body cosmological simulations for three WDM models with , 0.7 and 2.0 keV respectively, plus a controlled CDM model. We couple these simulations with a Semi Analytical Model of galaxy formation to study the impact of a cut-off in the power spectrum on observable quantities such as the stellar mass function.
For a fixed set of parameters describing the baryonic physics, models with low masses for the warm particle ( and 0.75 keV), predict less galaxies with stellar mass than the current data at . We find that the WDM model with keV provides almost identical results as CDM and it is able to successfully reproduce the data. The situation is reversed at higher redshift , with WDM models in better agreement with the observed stellar mass function than the CDM model (or the WDM model with keV).
However we show these differences in the stellar mass function, are strongly degenerate with the set of parameters used in the Semi Analytical Models to describe the (largely unknown) galaxy formation processes. By adjusting a single parameter (the cooling rate of low mass haloes) we have been able to get indistinguishable results from all the DM models, both at high and low redshift. This shows that a single observable (e.g. the stellar mass function) can not constrain the effects of warm component on the galaxy formation process.
In order to break this degeneracy we use independent constraints on the (integrated) star formation efficiency at low masses. We found that if the WDM models are tuned to reproduce the present () stellar mass function, the stellar mass for a given halo mass is systematically larger in haloes of masses below (). Such scales are not reliably probed by direct methods such as satellite kinematics or weak galaxy-galaxy lensing. In order to probe such low halo masses we use the relation between stellar mass and rotation velocity at large galactic radii, more commonly known as the Tully-Fisher relation. Current data already rule out models with keV which is in agreement with other limits from large scale structure (e.g. Viel et al. 2008).
Finally our study shows that by combining measurements of galaxy stellar mass function and stellar mass - halo mass relation down to low galaxy masses (km/s) it is possible to obtain very tight constraints on the mass of a possible warm component. This opens a new window in the search for the nature of the elusive dark matter component of our Universe.
References
- Abazajian & Koushiappas (2006) Abazajian, K. & Koushiappas, S. M., 2006, PhRvD, 74, 023527
- Alam et al. (2002) Alam, S. M. K., Bullock, J. S., & Weinberg, D. H. 2002, ApJ, 572, 34
- Behroozi et al. (2010) Behroozi, P. S., Conroy, C., & Wechsler, R. H. 2010, ApJ, 717, 379
- Bell et al. (2003) Bell, E., McIntosh, D., Katz, N., Weinberg M., 2003, ApJS, 149, 289
- Bode et al. (2001) Bode, P., Ostriker, J. P. & Turok, N., 2001, ApJ, 556, 93
- Boyarsky et al. (2009a) Boyarsky, A., Ruchayskiy, O. & Shaposhnikov, M., 2009, Annual Review of Nuclear and Particle Science, 59, 191
- Boylan-Kolchin et al. (2011) Boylan-Kolchin, M., Bullock, J. S., & Kaplinghat, M. 2011, MNRAS, 415, L40
- Brooks & Zolotov (2012) Brooks, A. M., & Zolotov, A. 2012, arXiv:1207.2468
- Bullock et al. (2000) Bullock, J. S., Kravtsov, A. V., & Weinberg, D. H. 2000, ApJ, 539, 517
- Chabrier (2003) Chabrier, G. 2003, PASP, 115, 763
- Cole et al. (2000) Cole, S., Lacey, C. G., Baugh, C. M., & Frenk, C. S. 2000, MNRAS, 319, 168
- Colín et al. (2000) Colín, P., Avila-Reese, V. & Valenzuela, O., 2000, ApJ, 542, 622
- Colín et al. (2008) Colín, P., Valenzuela, O. & Avila-Reese, V., 2008, ApJ, 673, 203
- Conroy et al. (2007) Conroy, C., Prada, F., Newman, J. A., et al. 2007, ApJ, 654, 153
- Cooray & Sheth (2002) Cooray, A., & Sheth, R., 2002, PhR, 372, 1
- Dutton (2009) Dutton, A. A. 2009, MNRAS, 396, 121
- Dutton et al. (2011) Dutton, A. A., Conroy, C., van den Bosch, F. C., et al. 2011a, MNRAS, 416, 322
- Gnedin et al. (2004) Gnedin, O., Kravtson, A., Andrey, V., Klypin, A., Nagai, D., 2004, ApJ, 616, 16
- Götz & Sommer-Larsen (2002) Götz, M.,Sommer-Larsen, J. 2002 ApSS, 281, 415
- Governato et al. (2012) Governato, F., Zolotov, A., Pontzen, A., et al. 2012, MNRAS, 422, 1231
- Guo et al. (2011) Guo, Q., White, S., Boylan-Kolchin, M., et al. 2011, MNRAS, 413, 101
- Hansen et al. (2002) Hansen, S. H., Lesgourgues, J., Pastor, S. & Silk, J., 2002, MNRAS, 333, 546
- Kang et al. (2005) Kang, X., Jing, Y. P., Mo, H. J., Börner, G. 2005, ApJ, 631, 21
- Kang et al. (2006) Kang, X., Jing, Y. P., & Silk, J. 2006, ApJ, 648, 820
- Kang & van den Bosch (2008) Kang, X., & van den Bosch, F. C. 2008, ApJL, 676, L101
- Kang et al. (2012) Kang, X., Li M., Lin W.P., Elha P.J., 2012, MNRAS, 422, 804
- Klypin et al. (1999) Klypin, A., Kravtsov, A. V., Valenzuela, O., & Prada, F. 1999, ApJ, 522, 82
- Komatsu et al. (2011) Komatsu, E., Smith, K. M., Dunkley, J., et al. 2011, ApJS, 192, 18
- Lacey Cole (1993) Lacey, C., & Cole, S. 1993, MNRAS, 262, 627
- Leauthaud et al. (2012) Leauthaud, A., Tinker, J., Bundy, K., et al. 2012a, ApJ, 744, 159
- Leauthaud et al. (2012) Leauthaud, A., George, M. R., Behroozi, P. S., et al. 2012b, ApJ, 746, 95
- Li et al. (2006) Li, C., Kauffmann, G., Jing, Y. P., et al. 2006, MNRAS, 368, 21
- Li et al. (2007) Li, C., Jing, Y. P., Kauffmann, G., et al. 2007, MNRAS, 376, 984
- Li & White (2009) Li, C., & White, S. D. M. 2009, MNRAS, 398, 2177
- Liu et al. (2010) Liu, L., Yang, X., Mo, H. J., van den Bosch, F. C., & Springel, V. 2010, ApJ, 712, 734
- Lovell et al. (2012) Lovell, M. R., Eke, V., Frenk, C. S., et al. 2012, MNRAS, 420, 2318
- Macciò et al. (2008) Macciò, A. V., Dutton, A. A., & van den Bosch, F. C. 2008, MNRAS, 391, 1940
- Macciò et al. (2010) Macciò, A. V., Kang, X., Fontanot, F., Sommerville, R. S., Koposov, S. E. & Monaco, P., 2010, MNRAS, 402, 1995
- Macciò & Fontanot (2010) Macciò, A. V. & Fontanot, F., 2010, MNRAS, 404, L16
- Macciò et al. (2012) Macciò, A. V., Stinson, G., Brook, C. B., Wadsley, J., Couchman, H. M. P., Shen, S., Gibson, B. K. & Quinn, T., 2012a, ApJ, 744, L9
- Macciò et al. (2012) Macciò, A. V., Paduroiu, S., Anderhalden, D., Schneider, A., & Moore, B. 2012b, MNRAS, 424, 1105
- Mandelbaum et al. (2006) Mandelbaum, R., Seljak, U., Kauffmann, G., Hirata, C. M., & Brinkmann, J. 2006, MNRAS, 368, 715
- Mashchenko et al. (2008) Mashchenko, S., Wadsley, J., & Couchman, H. M. P. 2008, Science, 319, 174
- Menci et al. (2012) Menci, N., Fiore, F., & Lamastra, A. 2012, MNRAS, 421, 2384
- McGaugh (2012) McGaugh, S. S. 2012, AJ, 143, 40
- Miranda & Macciò (2007) Miranda, M. & Macciò, A. V., 2007, MNRAS, 382, 1225
- Moore et al. (1999) Moore, B., Ghigna, S., Governato, F., Lake, G., Quinn, T., Stadel, J., & Tozzi, P. 1999, ApJL, 524, L19
- More et al. (2009) More, S., van den Bosch, F. C., Cacciato, M., et al. 2009, MNRAS, 392, 801
- More et al. (2011) More, S., van den Bosch, F. C., & Cacciato, M., et al. 2011, MNRAS, 410, 210
- Moster et al. (2010) Moster, B. P., Somerville, R. S., Maulbetsch, C., et al. 2010, ApJ, 710, 903
- Pontzen & Governato (2012) Pontzen, A., & Governato, F. 2012, MNRAS, 421, 3464
- Schneider et al. (2012) Schneider, A., Smith, R. E., Macciò, A. V., & Moore, B. 2012, MNRAS, 424, 684
- Seljak et al. (2006) Seljak, U., Makarov, A., McDonald, P., & Trac, H. 2006, Phys. Rev. Let., 97, 191303
- Song & Lee (2009) Song, H., & Lee, J. 2009, ApJL, 703, L14
- Springel (2005) Springel, V. 2005, MNRAS, 364, 1105
- Springel et al. (2006) Springel, V., Frenk, C. S., & White, S. D. M. 2006, Nature, 440, 1137
- Stark et al. (2009) Stark, D. V., McGaugh, S. S., & Swaters, R. A. 2009, AJ, 138, 392
- Tikhonov et al. (2009) Tikhonov, A. V., Gottlöber, S., Yepes, G. & Hoffman, Y., 2009, MNRAS, 399, 1611
- Tully & Fisher (1977) Tully, R. B., & Fisher, J. R. 1977, A&A, 54, 661
- Vale & Ostriker (2004) Vale, A., & Ostriker, J. P. 2004, MNRAS, 353, 189
- Wang & White (2007) Wang, J.,White, S. D. M. 2007, MNRAS, 380, 93
- Weinmann et al. (2006) Weinmann, S. M., van den Bosch, F. C., Yang, X., et al. 2006, MNRAS, 372, 1161
- Weinmann et al. (2010) Weinmann, S. M., Kauffmann, G., von der Linden, A., & De Lucia, G. 2010, MNRAS, 406, 2249
- Weinmann et al. (2012) Weinmann, S. M., Pasquali, A., Oppenheimer, B. D., et al. 2012, arXiv:1204.4184
- Viel et al. (2005) Viel, M., Lesgourgues, J., Haehnelt, M. G., Matarrese, S., & Riotto, A., 2005, PhRvD, 71, 063534
- Viel et al. (2008) Viel, M., Becker, G. D., Bolton, J. S., Haehnelt, M. G., Rauch, M. & Sargent, W. L. W., 2008, Physical Review Letters, 100, 041304
- Zavala et al. (2009) Zavala, J., Jing, Y. P., Faltenbacher, A., Yepes, G., Hoffman, Y., Gottlöber, S. & Catinella, B., 2009, ApJ, 700, 1779
- Zentner & Bullock (2003) Zentner, A. R. & Bullock, J. S.2003, ApJ, 598, 49