The ACS Fornax Cluster Survey. VI. The Nuclei of Early-Type Galaxies in the Fornax Cluster11affiliation: Based on observations with the NASA/ESA Hubble Space Telescope obtained at the Space Telescope Science Institute, which is operated by the association of Universities for Research in Astronomy, Inc., under NASA contract NAS 5-26555.
Abstract
The Advanced Camera for Surveys (ACS) Fornax Cluster Survey is a Hubble Space Telescope program to image 43 early-type galaxies in the Fornax cluster, using the F475W and F850LP bandpasses of the ACS. We employ both 1D and 2D techniques to characterize the properties of the stellar nuclei in these galaxies, defined as the central “luminosity excesses” relative to a Sérsic model fitted to the underlying host. We find % of our sample (31 galaxies) to be nucleated, with only three of the nuclei offset by more than 05 from their galaxy photocenter, and with the majority of nuclei having colors bluer than their hosts. The nuclei are observed to be larger, and brighter, than typical Fornax globular clusters, and to follow different structural scaling relations. A comparison of our results to those from the ACS Virgo Cluster Survey reveals striking similarities in the properties of the nuclei belonging to these different environments. We briefly review a variety of proposed formation models and conclude that, for the low-mass galaxies in our sample, the most important mechanism for nucleus growth is probably infall of star clusters through dynamical friction, while for higher mass galaxies, gas accretion triggered by mergers, accretions and tidal torques is likely to dominate, with the relative importance of these two processes varying smoothly as a function of galaxy mass. Some intermediate-mass galaxies in our sample show a complexity in their inner structure that may be the signature of “hybrid nuclei” that arose through parallel formation channels.
Subject headings:
galaxies: clusters: individual (Fornax, Virgo); galaxies: elliptical and lenticular, cD; galaxies: nuclei; galaxies: structure1. Introduction
Once viewed as relatively simple objects that formed in a single, “monolithic” collapse, early-type galaxies are now widely believed to have been assembled hierarchically through repeated mergers and accretions (e.g., White & Rees, 1978; Searle & Zinn, 1978; White & Frenk, 1991; Kauffmann & Haehnelt, 2000; Cole et al., 2000; Springel et al., 2005; Bower et al., 2006). A property of most luminous (e.g., ) early-type galaxies is that they appear to have formed the majority of their stars at high redshift (, corresponding to ages of - Gyr) and on short timescales ( Gyr) (e.g., Bower et al., 1992; Franx, 1993; Thomas et al., 1999; Trager et al., 2000; Wake et al., 2006). These features may be related to feedback from active galactic nuclei (AGN), which can generate jets and outflows that blow away gas and suppress star formation (e.g., Silk & Rees, 1998; King, 2003; Murray et al., 2005; Fabian et al., 2006; Robertson et al., 2006). The general trends in the star formation histories of low- and intermediate-luminosity early-type galaxies are not as well understood, but they are known to show considerable diversity and to depend sensitively on environment (see, e.g., Tolstoy et al., 2009).
The discovery of the – relation (Ferrarese & Merritt, 2000; Gebhardt et al., 2000) points to a fundamental connection between the central black holes powering these AGN, and the dynamical properties of their host galaxies. There are several other galaxy properties that have also been found to scale with black hole mass, including luminosity (e.g., Kormendy & Richstone, 1995; Ferrarese & Merritt, 2000), light concentration (e.g., Graham et al., 2001), global velocity dispersion (e.g., Ferrarese & Merritt, 2000; Gebhardt et al., 2000; Gültekin et al., 2009), bulge mass (e.g., Magorrian et al., 1998; Marconi & Hunt, 2003; Häring & Rix, 2004), and total gravitational mass of the host (Bandara et al., 2009). Thus, it has become clear that an understanding of the central regions of galaxies, including black holes and AGN, is essential if we are to make sense of the formation and evolution of galaxies themselves.
However, the direct detection of black holes remains very challenging: see, e.g., Chapter 11 of Ferrarese & Ford (2005) for an overview of the observational difficulties. For kinematic measurements, a high central surface brightness is needed to obtain spectra of adequate S/N, and this requirement can pose problems for massive early-type galaxies with shallow surface brightness profiles in their cores. At the distances of the Virgo and Fornax clusters, the small angular size of the black hole “sphere of influence” in most galaxies introduces a further complication. For example, at 20 Mpc, the distance of Fornax, a black hole in a galaxy with km s-1 has a sphere of influence of only in radius (assuming the – relation from Ferrarese et al. 2006b). It is therefore not surprising that a dynamical black hole mass measurement exists for only a single early-type galaxy in the Fornax cluster (FCC 213; Houghton et al., 2006; Gebhardt et al., 2007).
On the other hand, the correlation between a galaxy’s mass and that of its black hole was recently shown to extend down to the central nuclear star clusters found in low-mass galaxies (Ferrarese et al., 2006a; Wehner & Harris, 2006). Other studies have reported similar relationships between black hole or nucleus mass and the host bulge luminosity, mass, and Sérsic index (Rossa et al., 2006; Balcells et al., 2007; Graham & Driver, 2007). These results are suggestive of a global relationship between galaxies and both types of central massive object (CMO; Côté et al. 2006, hereafter C06): however, it is still an open question as to whether black holes and nuclei form via the same mechanisms, or whether nuclei form first and serve as seeds for black hole formation.
The hydrodynamical simulations of Li et al. (2007) of a shared formation mechanism for both nuclei and black holes via the gravitational collapse of gas in bulgeless disks were able to reproduce a CMO and host mass correlation even without imposing an a priori - relation, and were observed to be in agreement with Ferrarese et al. (2006a). Alternatively, Ferrarese et al. (2006a) noted that nuclei could, in principle, form in all galaxies, but in massive galaxies they might either collapse or be destroyed (or otherwise altered) by binary black holes. Using semi-analytic models, it was the demonstrated by Devecchi & Volonteri (2009) and Devecchi et al. (2010) that nuclei could form at high redshifts and act as possible black hole seeds.
If nuclei and black holes form simultaneously, then it is possible that momentum feedback determines which object will eventually dominate the CMO mass. McLaughlin et al. (2006) noted that the same momentum flux that drives out gas from black holes (King, 2003, 2005) could also regulate the growth of nuclear star clusters. Nayakshin et al. (2009) used this finding to explain why nuclei, not black holes, appear more likely to form in less massive hosts. Both objects can form simultaneously as gas is driven to the center of a galaxy through an event such as a merger, but it is the mass of the host bulge that sets the individual formation rates. Some evidence for such a scenario comes from observations of intermediate-luminosity galaxies (Filippenko & Ho, 2003; González Delgado et al., 2008; Seth et al., 2008; Graham & Spitler, 2009), as well as a number of dwarfs (Barth et al., 2004; Reines et al., 2011), that have been found to contain both a central stellar nucleus and a black hole. Indeed, using observations in the Virgo cluster, Gallo et al. (2010) estimated that hybrid nuclei could occur in 0.3–7% of galaxies with stellar masses below , and in less than 32% of hosts above this stellar mass. In short, the study of nuclei presents us with a new opportunity to deepen our understanding of how galaxies and black holes co-evolve.
Like black holes, nuclei pose some observational challenges of their own. Although their existence in some dwarf galaxies has been known for decades, comprehensive surveys of galaxy clusters — in which the frequency of nucleation within complete galaxy samples could be robustly measured — did not appear until Binggeli et al. (1987) published their Virgo Cluster Catalog (VCC). This program observed 1277 members and 574 probable members of the Virgo cluster using the 2.5 m Las Campanas telescope; about 26% of all dwarf galaxies in the VCC sample were found to be nucleated. Shortly thereafter, a similar survey of the Fornax cluster by Ferguson (1989) — the Fornax Cluster Catalog (FCC) — found nuclei in 103/249 41% of their dwarf galaxies. In the above studies, dwarf galaxies were identified primarily morphologically by their flat surface brightness profiles, although in general they were found to be fainter than mag (Sandage & Binggeli, 1984).
Given the low luminosities and small sizes of most of these nuclei, the frequencies of nucleation estimated from ground-based photographic studies are certainly lower limits. For instance, Lotz et al. (2004) used WFPC2 on the Hubble Space Telescope (HST) to observe 69 dwarf elliptical galaxies in both Virgo and Fornax, finding nuclei in six galaxies that were previously classified as non-nucleated in the VCC and FCC. Based on wide-field imaging of Virgo dwarfs from the Isaac Newton Telescope, Grant et al. (2005) was able to identify many faint nuclei that were missed in the earlier photographic survey. In fact, imaging of late-type galaxies with HST commonly revealed “nuclear clusters” that had gone unnoticed in earlier studies, with an overall frequency of nucleation of (e.g., Carollo et al., 1998; Matthews et al., 1999; Böker et al., 2004; Walcher et al., 2005; Seth et al., 2006).
The first study to find a comparable frequency of nucleation among early-type galaxies was carried out by C06 with the Advanced Camera for Surveys (ACS) on HST: i.e., the ACS Virgo Cluster Survey (ACSVCS; Côté et al., 2004).111Related papers from the ACSVCS on the central structure of early-type galaxies include Ferrarese et al. (2006b, a); Côté et al. (2007); Glass et al. (2011). In addition to establishing a high frequency of nucleation for early-type galaxies (at least 66% for galaxies brighter than ), the high-resolution imaging made it possible to characterize the detailed properties of the nuclei for the first time, including their luminosity function, structural properties, color-magnitude relation, and nucleus-to-galaxy luminosity ratio. We note here that although in C06 and this work, we call the central excess of light rising above a galaxy’s extrapolated outer surface brightness profile a ”nucleus“, these objects are not limited to being nuclear star clusters; certainly, some could be described as disks, bars, or other large scale structures, which have been observed by previous studies of early-type galaxy centers (e.g. Ferrarese et al., 2006b; Balcells et al., 2007; Morelli et al., 2010). In this paper, which is part of the ACS Fornax Cluster Survey (ACSFCS), we examine the properties of nuclei belonging to galaxies in the Fornax Cluster, which is located at a distance of Mpc (statistical systematic error) (Blakeslee et al., 2009). This cluster is smaller, denser, more dynamically evolved, and more regular in shape than the Virgo cluster, and therefore allows us to study the properties of the nuclei of galaxies residing in a new and different environment.
Other papers in the ACSFCS series have described the data reduction procedures used in the survey (Jordán et al., 2007a, hereafter Paper I), systematic variations in the central structure of galaxies (Côté et al., 2007, hereafter Paper II), the logarithmic slope of the galaxy central surface brightness profiles (Glass et al., 2011, hereafter Paper IV), and the use of surface brightness fluctuations as a distance indicator (Blakeslee et al., 2009, hereafter Paper V). Paper III (2012, in prep.) of the ACSFCS will present a detailed isophotal analysis of the ACSFCS galaxies, including their dust properties, axial ratios, 2D structure, total magnitudes, colors, and surface brightness and color profiles. Papers studying the properties of globular clusters (GCs) in ACSFCS galaxies have examined their half-light radii (Masters et al., 2010, hereafter Paper VII), luminosity function (Villegas et al., 2010, hereafter Paper VIII), color-magnitude relation (Mieske et al., 2010, hereafter Paper IX), and color gradients (Liu et al., 2011, hereafter Paper X).
The outline of this paper is as follows. In §2 we describe the observations and methodologies used to measure photometric and structural parameters for the nuclei; in §3 we examine the nucleus properties, including their frequency of nucleation, luminosity function, sizes, surface brightness parameters, and colors; in §4 we put our results into the context of current formation scenarios; and in §5 we summarize our main results. An appendix presents a comparison of 1D and 2D methods for measuring photometric and structural parameters of nuclei and their host galaxies.
2. Observations and Analysis
The ACSFCS sample was constructed by selecting all galaxies from the FCC with: (1) blue magnitudes ; and (2) early-type morphologies: i.e., E, S0, SB0, dE, dE,N or dS0,N. These morphological types were taken directly from Ferguson (1989) which are in turn based on the classification scheme of Sandage & Binggeli (1984). In addition to the 42 FCC galaxies that met these criteria, two ellipticals that lie just beyond the FCC survey region (NGC 1340 and IC 2006) were added, giving a total of 44 targets. Unfortunately, due to a shutter failure during execution, no images were obtained for FCC 161 (NGC 1379). Our final sample therefore consists of 43 early-type galaxies, which is complete (apart from FCC 161) down to a limiting magnitude of mag ( mag). For all galaxies in this survey, membership in the cluster has been confirmed through radial velocity measurements. More details on the sample can be found in Papers I and III.
In §4.1, we will compare our results to a sample of galaxies and nuclei from the ACSVCS, which consists of 100 early-type members of the Virgo Cluster. That survey was magnitude limited down to mag ( mag) and 44% complete down to its limiting magnitude of mag ( mag). Both the Fornax and Virgo galaxies were observed with the ACS using Wide Field Channel (WFC) mode with the F475W and F850LP filters, which correspond closely to the - and -band filters in the Sloan Digital Sky Survey (SDSS) system (see, e.g., Fukugita et al., 1996; York et al., 2000; Sirianni et al., 2005).
Basic data for the ACSFCS galaxies are presented in Table 1. The ACSFCS identification number, the FCC number from Ferguson (1989), and any alternate names are reported in the first three columns. The table is ordered by increasing FCC blue magnitude, , which is given in column 4. In calculating absolute magnitudes, we used the individual surface brightness fluctuation (SBF) distances measured in Paper V. Beginning in §3, all reported magnitudes are extinction corrected, using dust maps from Schlegel et al. (1998), with the ratios of total-to-selective absorption in the WFC filters taken from Sirianni et al. (2005); the adopted -band extinctions are shown in column 5. The galaxy - and - band surface brightness at a geometric mean radius of , measured by spline interpolation, are recorded in columns 6 and 7. Note that all HST/ACS magnitudes quoted in this paper are AB magnitudes.
| ID | Name | Other | ) | ) | Class | Class | ||
|---|---|---|---|---|---|---|---|---|
| (mag) | (mag) | (mag/) | (mag/) | (FCC) | (ACS) | |||
| (1) | (2) | (3) | (4) | (5) | (6) | (7) | (8) | (9) |
| 1 | 21 | N1316 | 9.06 | 0.090 | 15.61 | 14.12 | N | cS |
| 2 | 213 | N1399 | 10.04 | 0.056 | 16.78 | 15.17 | N | cS |
| 3 | 219 | N1404 | 10.96 | 0.049 | 16.45 | 14.88 | N | cS |
| 4 | 1340 | E418-G005 | 11.23 | 0.077 | 17.00 | 15.56 | N | cS |
| 5 | 167 | N1380 | 10.84 | 0.075 | 16.88 | 15.32 | N | S1 |
| 6 | 276 | N1427 | 11.79 | 0.048 | 17.07 | 15.59 | N | S1 |
| 7 | 147 | N1374 | 11.95 | 0.060 | 17.14 | 15.58 | N | S1 |
| 8 | 2006 | E359-G007 | 12.59 | 0.048 | 17.72 | 16.18 | N | S2 |
| 9 | 83 | N1351 | 12.33 | 0.061 | 17.35 | 15.83 | N | S1 |
| 10 | 184 | N1387 | 11.77 | 0.055 | 16.70 | 15.05 | N | S1 |
| 11 | 63 | N1339 | 12.77 | 0.057 | 17.13 | 15.56 | N | S2 |
| 12 | 193 | N1389 | 12.59 | 0.046 | 17.34 | 15.88 | N | S2 |
| 13 | 170 | N1381 | 12.91 | 0.058 | 17.12 | 15.62 | N | S2 |
| 14 | 153 | I1963 | 13.55 | 0.062 | 18.32 | 16.91 | N | S2 |
| 15 | 177 | N1380A | 13.60 | 0.063 | 18.83 | 17.58 | N | S2 |
| 16 | 47 | N1336 | 13.34 | 0.049 | 18.50 | 17.11 | N | S2 |
| 17 | 43 | I1919 | 13.82 | 0.062 | 19.99 | 18.83 | Y | S2 |
| 18 | 190 | N1380B | 13.79 | 0.074 | 19.32 | 17.89 | N | S2 |
| 19 | 310 | N1460 | 13.68 | 0.047 | 19.32 | 17.96 | N | S2 |
| 20 | 249 | N1419 | 13.61 | 0.056 | 17.68 | 16.25 | N | S2 |
| 21 | 148 | N1375 | 13.39 | 0.063 | 18.20 | 17.02 | N | S2 |
| 22 | 255 | E358-G50 | 13.99 | 0.025 | 19.50 | 18.26 | Y | S2 |
| 23 | 277 | N1428 | 14.01 | 0.044 | 18.84 | 17.45 | N | S2 |
| 24 | 55 | E358-G06 | 14.23 | 0.043 | 19.68 | 18.41 | Y | S2 |
| 25 | 152 | E358-G25 | 14.13 | 0.044 | 20.44 | 19.25 | N | S1 |
| 26 | 301 | E358-G59 | 14.22 | 0.039 | 18.61 | 17.31 | N | S2 |
| 27 | 335 | E359-G02 | 14.90 | 0.063 | 20.40 | 19.27 | N | S2 |
| 28 | 143 | N1373 | 14.19 | 0.061 | 18.39 | 16.96 | N | S1 |
| 29 | 95 | G87 | 15.01 | 0.064 | 20.16 | 18.83 | N | S2 |
| 30 | 136 | G99 | 15.00 | 0.069 | 20.73 | 19.39 | Y | S2 |
| 31 | 182 | G79 | 15.01 | 0.057 | 19.61 | 18.18 | N | S2 |
| 32 | 204 | E358-G43 | 15.33 | 0.045 | 20.50 | 19.23 | Y | S2 |
| 33 | 119 | G26 | 15.44 | 0.060 | 21.35 | 20.10 | N | S1aaDue to the offset of the nucleus and the amount of central dust, the nucleus parameters for FCC 119 were derived using a King profile fit to the ACS image. |
| 34 | 90 | G118 | 15.10 | 0.052 | 19.55 | 18.76 | N | S2 |
| 35 | 26 | E357-G25 | 15.26 | 0.067 | 19.80 | 19.39 | N | S1 |
| 36 | 106 | G47 | 15.34 | 0.046 | 19.89 | 18.62 | Y | S2 |
| 37 | 19 | E301-G08 | 15.81 | 0.085 | 21.56 | 20.49 | Y | S2 |
| 38 | 202 | N1396 | 15.50 | 0.057 | 20.71 | 19.41 | Y | S2 |
| 39 | 324 | E358-G66 | 15.83 | 0.042 | 22.16 | 21.01 | N | S2 |
| 40 | 288 | E358-G56 | 15.82 | 0.025 | 21.03 | 19.85 | Y | S2 |
| 41 | 303 | NG47 | 15.74 | 0.046 | 21.63 | 20.49 | Y | S2 |
| 42 | 203 | E358-G42 | 15.82 | 0.051 | 21.50 | 20.28 | Y | S2 |
| 43 | 100 | G86 | 15.75 | 0.062 | 22.18 | 21.08 | Y | S2 |
(1) ACSFCS Identification number;
(2) Galaxy name, mainly from the Fornax Cluster Catalog (FCC) of Ferguson (1989);
(3) Alternative names in the NGC, ESO or IC catalogs;
(4) Total blue magnitude from ACSFCS (Paper III);
(5) from Schlegel et al. (1998);
(6)–(7) - and -band surface brightness measured at a geometric radius of 1″;
(8) Nuclear classification in the FCC: Y = nucleated, N = non-nucleated;
(9) Nuclear classification in ACSFCS: cS=core-Sérsic (non-nucleated), S1=Sérsic (non-nucleated), S2=double-Sérsic (nucleated)
The final two columns in Table 1 give the classifications of the galaxies as nucleated from Ferguson (1989), and the ones derived from our surface brightness profile analysis. The parameterization of these profiles is discussed in §2.1, and the fitting methods used are outlined in §2.2. Finally, the nucleus properties obtained from the above procedure are described in §2.3. Additional information about our program galaxies, such as coordinates and morphological classifications, can be found in Papers I and III.
2.1. Parameterization of the Surface Brightness Profiles
As stellar nuclei, which are the focus of this study, are found in the luminous central regions of their host galaxies, accurately modeling the underlying galaxy surface brightness is necessary to measure their photometric and structural parameters. Indeed, for the faintest nuclei, or for some nuclei embedded in high surface brightness galaxies with steeply rising brightness profiles, this can be important for even identifying a central nuclear component (see Appendix A of C06). Using the IRAF task ellipse, which is based on the algorithm of Jedrzejewski (1987), elliptical isophotes with logarithmically increasing semi-major axis length were fitted to the galaxies. In most cases, all ellipse parameters (center, ellipticity, and position angle) were allowed to vary. However, to achieve convergence, the galaxies with large amounts of central dust required the ellipse centers to be held fixed throughout the fit (FCC 335, FCC 119, FCC 90), as well as the position angles and ellipticities while fitting the innermost areas (FCC 119 and FCC 90), where the fixed parameter values were determined by ellipse fits to the outer regions (). For more details on the fitting procedures, see §3.2 of Ferrarese et al. (2006b) and Paper III.
The results from the ellipse isophotal analysis were used to derive azimuthally-averaged radial surface brightness profiles, which were then fitted using one of three different parameterizations for the global surface brightness profile. The first parameterization is the well known Sérsic profile (Sersic, 1968), a three parameter model which has the form
| (1) |
where is the intensity at the effective radius, , and the Sérsic index, , characterizes the overall shape of the light profile. The constant is defined such that , where and are the complete and incomplete gamma functions, respectively (Ciotti, 1991). For lower values of , the Sérsic profile is shallow in the inner regions and steep in the outer regions; produces a pure exponential profile, which generally provides a reasonable fit to dwarf galaxies. Higher values of yield functions which are steep in the inner regions and extended at large radii, with a less pronounced radial dependence on slope; these profiles generally fit bright ellipticals quite well (i.e., reduces to a classical de Vaucouleurs profile).
Historically, these two types of profiles have been used to separately parameterize dwarfs and giants. However, more complete studies of galaxies have found that actually varies steadily with galaxy luminosity (e.g., Graham & Guzmán 2003; Gavazzi et al. 2005; Ferrarese et al. 2006b; Kormendy et al. 2009; Misgeld & Hilker 2011; McLaughlin et al. 2012, in prep.). In what follows, we will refer to these single-component parameterizations as S1 models.
Although the Sérsic profile describes the outer component (typically beyond a few percent of the the effective radius) of galaxies remarkably well — a consequence of the wide range in concentration, spatial scale and surface brightness that is possible by varying , and , respectively — there can be variations in the central structure that cannot be accounted for in this simple model (see, e.g., Figures 1 and 2 of Paper II). Specifically, the brightest ellipticals tend to show a luminosity deficit in their central regions; for these objects, the six-parameter “core-Sérsic” model (Graham et al., 2003) provides a good description of their surface brightness profiles. The core-Sérsic model, referred to hereafter as a cS profile, can be written as
| (2) |
where
| (3) |
This parameterization consists of the usual Sérsic profile, with effective radius and Sérsic index , outside of a “break” radius (where the intensity is ). At , the outer profile transitions to an inner power-law component with slope , according to the “sharpness” parameter (where smaller values translate to smoother transitions).
By contrast, most of the low- and intermediate-luminosity galaxies in our sample show evidence for a luminosity excess in their cores which is, by definition, the signature of a central nucleus (see Appendix A of Côté et al., 2006).222The ACSVCS finding of “luminosity excesses” in Virgo cluster galaxies relative to the inward extrapolation of Sérsic models fitted to the outer profiles was subsequently confirmed by Kormendy et al. (2009) who reanalyzed a subset of the ACSVCS sample. A central excess in the surface brightness profile can then be modeled by adding a second Sérsic component. This double-Sérsic profile (which we denote hereafter as an S2 profile) has the form
| (4) |
where the enumerated subscripts indicate the Sérsic parameters for the outer and inner components.
It should be noted that, in C06, double-Sérsic profiles were not used to fit the nucleated galaxies. Instead, the central nuclei were represented by King profiles (Michie, 1963; King, 1966), while the outer component was represented by either a core-Sérsic or Sérsic profile. Our decision to use a double-Sérsic parameterization in the ACSFCS analysis is motivated by two considerations. Firstly, modeling the inner component with the Sérsic profiles allows for a diversity of possible physical systems, due to the range of the Sérsic parameter (see above). For , the profile is a pure exponential and is thus suitable for embedded disks, whereas represents Galactic GCs quite accurately, and presumably, nuclear star clusters as well. This is supported by the findings of Graham & Spitler (2009), who measured Sérsic indices of of , , and for the nuclear star clusters of the Milky Way, M32, and NGC 205, respectively; and by Seth et al. (2010) who observed a Sérsic index of for NGC 404. Secondly, the use of Sérsic profile for both the inner and outer components allows straightforward and convenient comparisons of their respective structural properties.
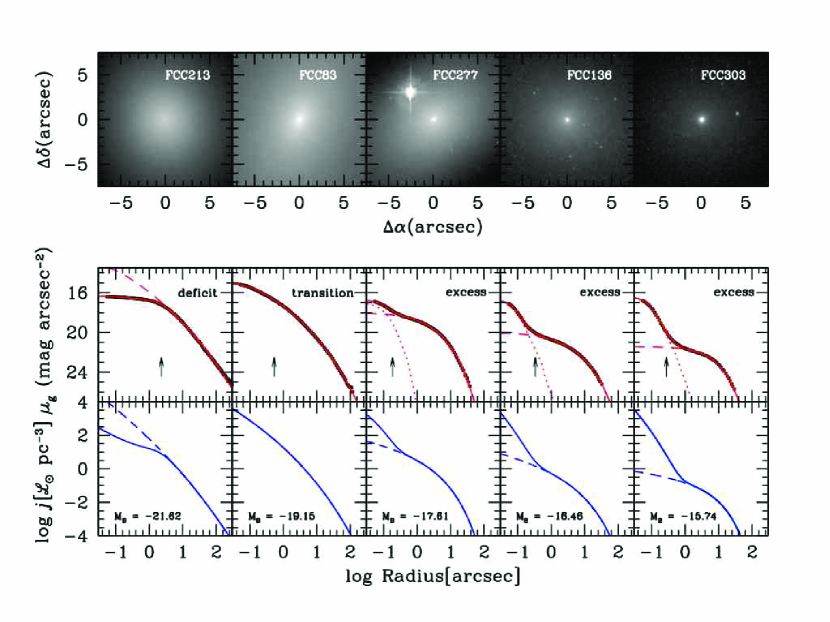
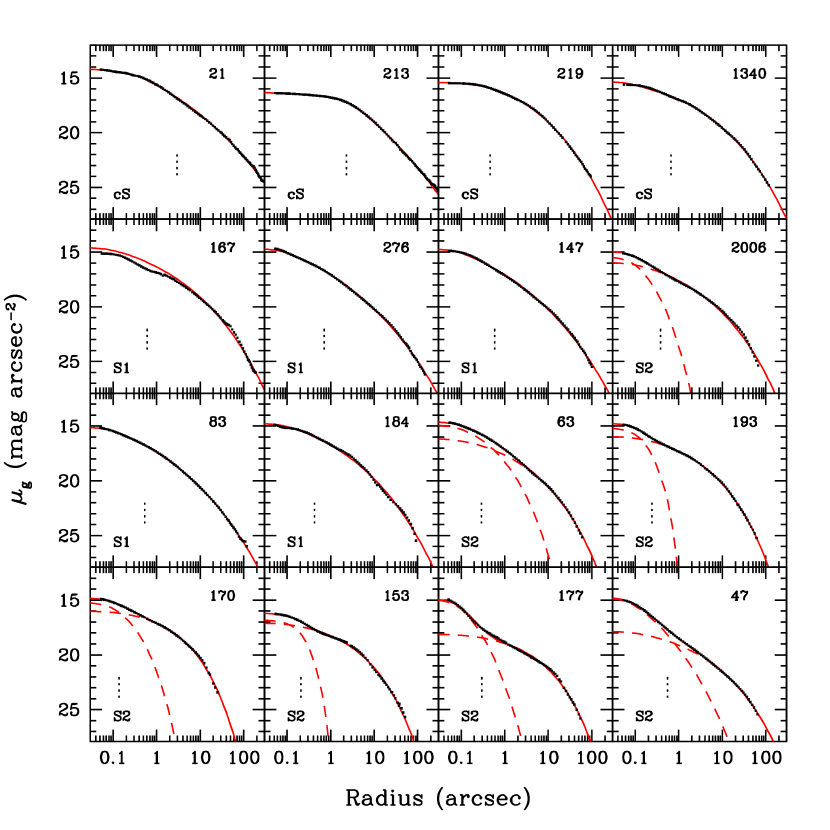
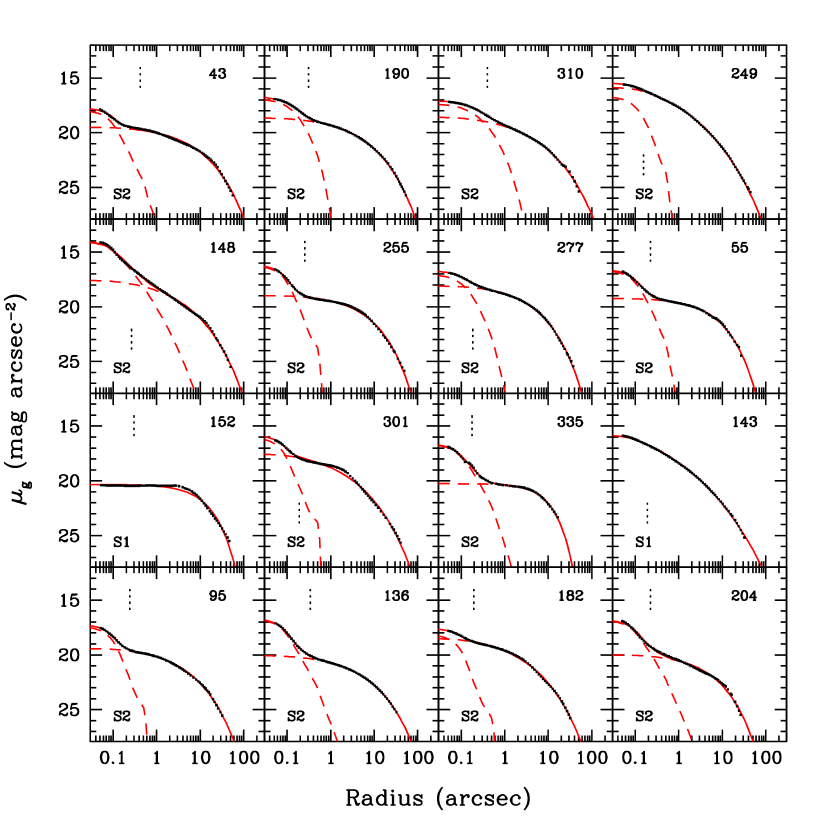
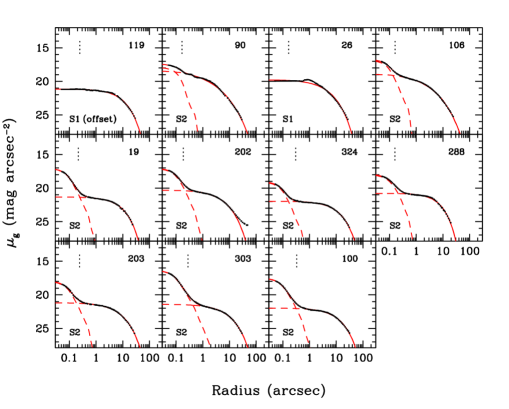
The overall trends described here are illustrated in Figure 1, which shows the systematic variations in the core and global structure of early-type galaxies along the luminosity function (see also C06; Ferrarese et al. 2006b, a; \al@cote07, glass11; \al@cote07, glass11). The upper panels in this figure show images centered on five representative galaxies from the ACSFCS, arranged in order of decreasing luminosity. The middle rows show model fits to the -band surface brightness profiles as described above: i.e., FCC 213 (cS), FCC 83 (S1), FCC 277 (S2), FCC 136 (S2) and FCC 303 (S2). Note the systematic decline in galaxy surface brightness from left to right, and the emergence of an increasingly prominent central nuclear component as galaxy luminosity decreases. At low and intermediate luminosities, these luminosity “excesses” (i.e., nuclei) relative to the underlying galaxy model correspond to a steady steepening of the three-dimensional luminosity density on small scales, as shown in the lower panel of Figure 1 (from Paper IV). Images and brightness profiles for the full sample of ACSFCS galaxies will be discussed below.
2.2. Fitting Procedure
As described in Paper I, the ACSFCS uses the Lanczos3 kernel for drizzling rather than the Gaussian kernel which was selected for the ACSVCS. Due to the slightly larger distance of the Fornax cluster — 20.0 vs. 16.5 Mpc (Mei et al. 2007; Paper V) — and the fact that some of the Virgo nuclei were only marginally resolved in the ACSVCS (C06; Ferrarese et al. 2006b, a), the sharper point spread function (PSF) possible with the Lanczos3 kernel was deemed to be more important for the ACSFCS galaxies than the Gaussian kernel’s ability to repair bad pixels.
New PSFs for the ACSFCS were constructed in an identical manner using more than a thousand stars from the GO-10048 and GO-10375 programs to obtain photometric calibrations of the Galactic GC 47 Tucanae (PI = J. Mack). Using multiple observations allowed PSFs to be extracted from data that were acquired no more than two months away from the ACSFCS observation times; this proved to be important since on 2004 December 20, the HST secondary mirror was moved by m.
After running KINGPHOT (Jordán et al., 2005) on the GC candidates identified in the ACSFCS images,333KINGPHOT fits two-dimensional, PSF-convolved King models to candidate GCs in the ACS images. it was found that, for a subset of galaxies (FCC 213, IC 2006, FCC 193, FCC 249, FCC 277, FCC 19, and FCC 202), the mean half-light radius for GC candidates was significantly larger in the -band than in the -band: i.e., by roughly 0.5 pixels in F475W, which is much larger than the pixel differences found in the ACSVCS. Anderson & King (2006) showed that the WFC PSF exhibits unpredictable variations on orbital timescales, particularly in the bluer filters, with differences in flux values of up to % in the central regions. To correct the seven galaxies whose imaging suffered from this variability, stellar sources in the individual images were used to adjust empirically the 47 Tucanae PSFs. Full details on this procedure are given in Paper I.
The azimuthally-averaged, one-dimensional (1D) surface brightness profiles were fitted using a minimization scheme to determine if a Sérsic or core-Sérsic model was most appropriate. If visual inspection of the images and/or surface brightness profiles revealed a nucleus, then an S2 parameterization was adopted. At each iteration of the fitting procedure, the models used were convolved with the PSF in two dimensions (assuming spherical symmetry), and both the models and PSF were oversampled by a factor of 10 with respect to the ACS pixel size (i.e. they were sampled every 0005).
All profile parameters, except for intensity, were first fitted to both bandpasses simultaneously. These preliminary values were then used as initial guesses for the independent - and -band fits for most of the galaxies, with the exception of those with high central surface brightness that appear to be nucleated. In these galaxies, the nuclei are often quite extended, and difficult to differentiate from the underlying galaxy light; thus, only the intensity parameters were allowed to vary between the two bands. As many previous investigators have noted, it is possible to measure reliably the total magnitudes and effective radii of marginally resolved stellar systems (i.e., star clusters, nuclei) using HST imaging, whereas the concentrations can usually be constrained with considerably lower precision (Kundu & Whitmore, 1998; Larsen, 1999; Carlson & Holtzman, 2001; Jordán et al., 2005). This is understandable given that the measurement of concentration (or Sérsic index) for a stellar system requires the curvature of the profile to be measured on scales smaller than the PSF. Fortunately, the derived radii and magnitudes are quite insensitive to Sérsic index, at least insofar as the adopted model is an accurate representation of the actual nuclear profile.
A conservative resolution limit of was estimated in C06 based on the half-light radii of King models fit to stars classified as unresolved by KINGPHOT, and from the size of the central non-thermal point source found in VCC 1316 (M87). C06 further showed that most of their detected nuclei were more extended than point sources, by fitting point source profiles in addition to King profiles, and comparing the residuals. Four of the nucleated galaxies (FCC 301, FCC 249, FCC 255, FCC 95) in Table 2 have best-fit effective radii that are measured to be smaller than our resolution limit in one, or both, photometric bands; these nuclei are thus unresolved — or nearly so — in our HST imaging.
| ID | Name | ||||||||
|---|---|---|---|---|---|---|---|---|---|
| (mag) | (mag) | (mag) | (mag) | () | () | () | () | ||
| (1) | (2) | (3) | (4) | (5) | (6) | (7) | (8) | (9) | (10) |
| 8 | 2006 | 0.07 | 0.08 | ||||||
| 11 | 63 | 0.69 | 0.71 | ||||||
| 12 | 193 | 0.00 | 0.00 | ||||||
| 13 | 170 | 0.19 | 0.15 | ||||||
| 14 | 153 | 0.01 | 0.00 | ||||||
| 15 | 177 | 0.10 | 0.06 | ||||||
| 16 | 47 | 0.61 | 0.56 | ||||||
| 17 | 43 | 0.02 | 0.16 | ||||||
| 18 | 190 | 0.02 | 0.01 | ||||||
| 19 | 310 | 0.35 | 0.30 | ||||||
| 20 | 249 | 0.00 | 0.00 | ||||||
| 21 | 148 | 0.33 | 0.29 | ||||||
| 22 | 255 | 0.00 | 0.00 | ||||||
| 23 | 277 | 0.02 | 0.01 | ||||||
| 24 | 55 | 0.01 | 0.00 | ||||||
| 26 | 301 | 0.00 | 0.00 | ||||||
| 27 | 335 | 0.05 | 0.02 | ||||||
| 29 | 95 | 0.00 | 0.00 | ||||||
| 30 | 136 | 0.05 | 0.03 | ||||||
| 31 | 182 | 0.00 | 0.00 | ||||||
| 32 | 204 | 0.10 | 0.10 | ||||||
| 33 | 119aaDue to the offset of the nucleus and the amount of central dust, the nucleus parameters for FCC 119 were derived using a King profile fit to the ACS image. | ||||||||
| 34 | 90 | 0.00 | 0.00 | ||||||
| 36 | 106 | 0.00 | 0.00 | ||||||
| 37 | 19 | 0.01 | 0.01 | ||||||
| 38 | 202 | 0.01 | 0.01 | ||||||
| 39 | 324 | 0.00 | 0.00 | ||||||
| 40 | 288 | 0.00 | 0.00 | ||||||
| 41 | 303 | 0.08 | 0.08 | ||||||
| 42 | 203 | 0.01 | 0.01 | ||||||
| 43 | 100 | 0.03 | 0.02 |
(1) ACSFCS Identification number;
(2) Galaxy name, mainly from the Fornax Cluster Catalog (FCC) of Ferguson (1989);
(3)–(4) - and -band magnitudes for the nuclei;
(5) Integrated color of nuclei;
(6) Nuclei color within a 4-pixel radius aperture;
(7)–(8) S2 model effective (half-light) radius in the - and -bands;
(9)–(10) - and -band luminosity fraction residing beyond .
After some experimentation, we have estimated uncertainties on the fitted parameters for the nuclei (and their host galaxies) using a Monte Carlo approach in which the - and -band surface brightness profiles for each galaxy are independently simulated 200 times. We included an amount of noise at each data point in the profile assuming a Gaussian distribution of errors and using the uncertainty on the intensity at each point computed by ELLIPSE. An additional source of error for the profiles comes from the determination of the background level, which we have also included by assuming a 10% error in the adopted background for each galaxy (estimated roughly by the galaxy-to-galaxy scatter in the measured background levels; see Figure 5 of Paper I). Errors on the magnitudes, colors and effective radii estimated from these Monte Carlo simulations are given in Table 1. We hasten to point out that these errors do not include possible sources of systematic errors, such as errors in the PSF, and that they are therefore best viewed in a relative sense, and as lower limits on the true errors.
Finally, as a check on the (1D) method, we also fitted surface brightness profiles to our galaxies using 2-dimensional (2D) techniques. The full results of this analysis are described in §A. In brief, the structural parameters obtained from the two procedures are largely in agreement, but due to the increased difficulty of characterizing complex structures using 2D fitting, we proceed with results from the 1D method, which we consider most appropriate for this study.
2.3. Identification of the Nuclei
The classification of a galaxy as nucleated or non-nucleated was performed in the following way. The program galaxies were all fitted with pure Sérsic profiles outside of a geometric mean radius of 05 ( pc). The geometric mean radius was derived from the fitted elliptical isophotes, and is thus defined as , where is the semi-major axis, and is the ellipticity. If an inward extrapolation of this profile revealed an excess of light in the center, then the full profile was refitted by adding a second Sérsic component, and the galaxy was thus considered nucleated and classified as S2. In general, the level of nucleation was slightly greater in the -band, as the nuclei are often found to be somewhat bluer than their hosts (see §3.6).
One of our program galaxies, FCC 119, appears to have a distinct nucleus offset that is from its photocenter by . Due to the presence of dust in the inner regions of the galaxy, the ellipse centers were held fixed to the photocenter throughout the fit; thus, the nucleus is not apparent in the 1D surface brightness profile (discussed below). We therefore use parameters derived from a KINGPHOT fit to this object, and consider this galaxy to be nucleated for the remainder of our analysis.
Galaxy classifications as nucleated or non-nucleated in the FCC, and our revised classification, are presented in columns 8 and 9 of Table 1. In Table 2, we record the parameters of the Sérsic profile fit to the nucleus of all S2 galaxies, as well as the KINGPHOT fit to FCC 119. Specifically, we have measured the - and -band integrated nucleus magnitudes (columns 3 and 4), integrated and 4-pixel radius aperture nucleus colors (columns 5 and 6), and - and -band nucleus half-light radii (columns 7 and 8). Error estimates for each of these parameters are also included in this table, derived using the Monte Carlo approach described in §2.2. We have also calculated, by integrating the Sérsic profiles, the fraction of luminosity occurring outward of (columns 7 and 8).
Although the nuclei half-light radii in a few galaxies were measured to be somewhat larger in the -band than in the -band (i.e. FCC 310, FCC 177, FCC 95), we note that these are not the same galaxies that suffered from the variable PSF discussed in §2.2; for the most part, these differences reflect the fact that size measurements are particularly challenging for under-luminous or extended nuclei in galaxies with steeply rising surface brightness profiles. For the reasons discussed in §2.2, we do not report the best-fit Sérsic indices in Table 2, although we note that the indices for all nuclei in our sample have , with a median of .
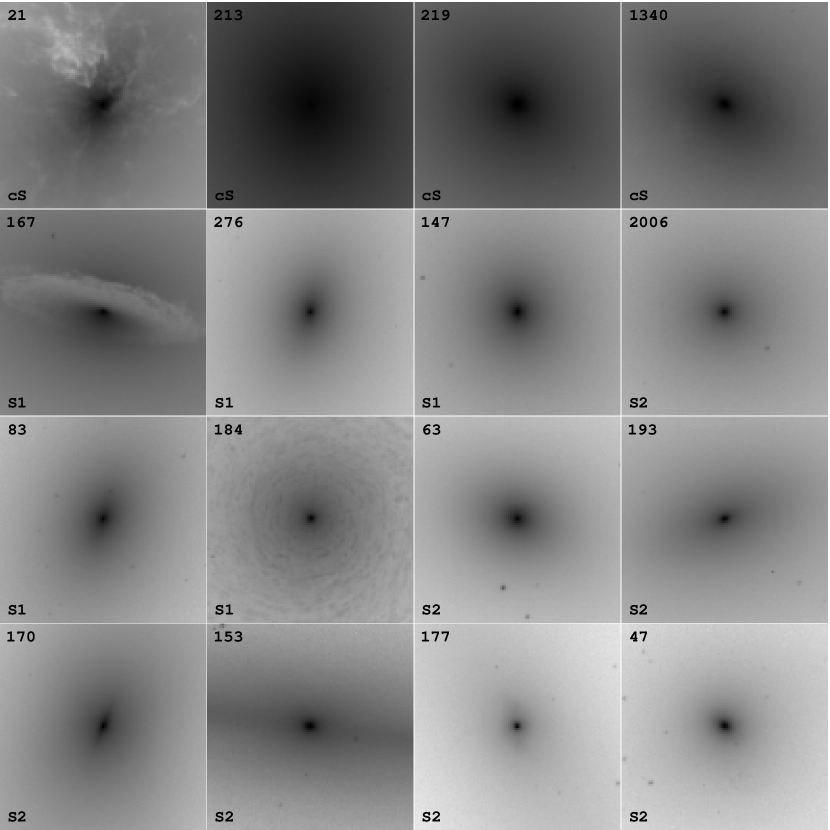
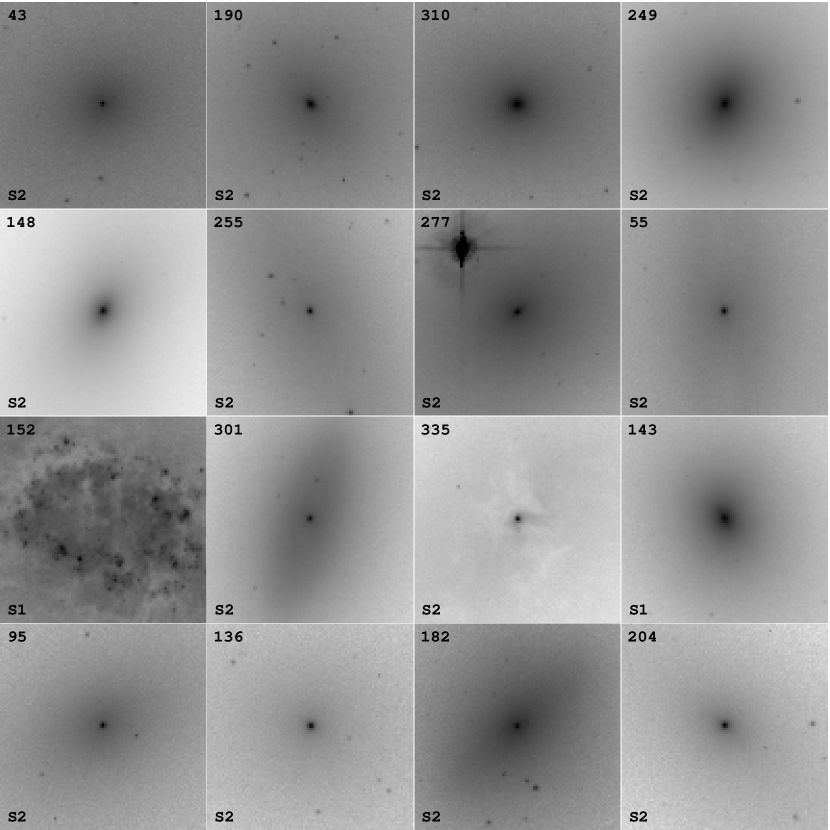
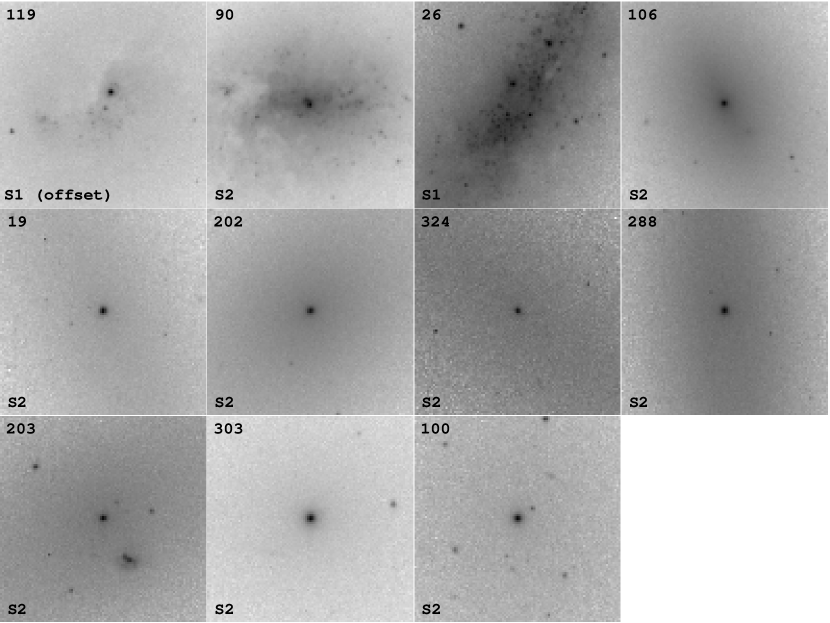
F475W images for the central region of the program galaxies, where a distinct nuclear component is often discernible, are shown in Figure 2. The FCC number of the galaxy is labeled in each of the panels, along with the type of profile fitted; S2 therefore indicates that the galaxy was considered to be nucleated (that is, fitted with a double-Sérsic profile). Individual fits to the azimuthally-averaged -band surface brightness profiles are shown in Figure 3. These images illustrate the systematic trend noted in Paper II, in which the central regions of early-type galaxies transition from shallow “cores” in the brightest systems (Ferrarese et al., 1994; Lauer et al., 1995; Faber et al., 1997; Rest et al., 2001; Ravindranath et al., 2001; Ferrarese et al., 2006b) to a two-component structure (nucleus+galaxy) as one moves down the luminosity function: i.e., toward fainter, and lower surface brightness, galaxies.


3. Results
In the following section, we analyze the properties of the ACSFCS nuclei derived from the above parameterization. Specifically, we examine the frequency of nucleation (§ 3.1), offset of the nuclei from their hosts (§ 3.2), nucleus-to-galaxy luminosity ratio (§ 3.3), and nucleus luminosity function (§ 3.4). Additionally, we compare their structural properties and scaling relations (§ 3.5), as well as colors (§ 3.6), with those of their host galaxies and GCs.
3.1. Frequency of Nucleation
Only 12 out of our 43 program galaxies were classified as nucleated in the FCC, which sets the frequency of nucleation at .444We include NGC 1340 and IC 2006 in this calculation; although they do not appear in the catalog of Ferguson (1989), both have “E” classifications in NED (i.e., non-nucleated ellipticals). Column 8 of Table 1 shows the classification as nucleated or non-nucleated in the FCC. These can be compared to our classification in the ACSFCS, where the use of the double-Sérsic (S2) model indicates that we consider the galaxy to be nucleated. We find all galaxies previously classified as nucleated in the FCC to be nucleated in our sample, as well as an additional 19 objects, for a total of 31/43 galaxies, or .
The cause of this sharp rise in frequency of nucleation can be attributed to both observational selection effects and the definition in our analysis of a nucleus as a central luminosity excess relative to a fitted galaxy model. In the top panel of Figure 4, the open histogram shows the luminosity of all of the program galaxies, while the hatched and solid histograms denote those found to be nucleated in the ACSFCS and the FCC, respectively. The bottom panel of Figure 4 plots as a function of luminosity for the two surveys. The ACSFCS uncovers many more nuclei in more luminous host galaxies, as the high resolution of the WFC allows us to resolve nuclei in their high surface brightness cores. This selection effect is explored further in Figure 5.
Galaxy surface brightness at a geometric mean radius of ( pc) was calculated using linear spline interpolation, in the - and -bands. By measuring surface brightness at a constant radius (rather than at some function of the effective radius), the result is a model-independent measure of central surface brightness, at a distance large enough to avoid the contribution from a typical nucleus, if present. Figure 5 plots the integrated nucleus magnitude derived from the S2 fit against galaxy surface brightness measured at a distance of 1″. The filled circles and open squares show the measurements for galaxies classified as nucleated in the ACSFCS and FCC, respectively. Clearly, the nuclei that went undetected in the earlier (photographic) survey come in two forms: bright nuclei that are embedded at the centers of galaxies with intermediate luminosity (which also have steeply rising profiles, see Figure 3) and faint nuclei belonging to the lowest luminosity galaxies. Needless to say, it is possible that we too may be missing some nuclei, so we take as a lower limit on the true frequency of nucleation in the ACSFCS sample.
3.2. Offset Nuclei
The offset of each nucleus from its host galaxy photocenter was measured for 28 of our 31 nucleated galaxies. For FCC 335, FCC 119, and FCC 90, the elliptical isophote fitting was performed with the ellipse centers held fixed, as convergence could not be otherwise achieved due to dust in their central regions. Thus, offsets for these nuclei could not be measured using the technique described below, although we did examine their offsets using our 2D (GALFIT) analysis, and they are also included in this section.
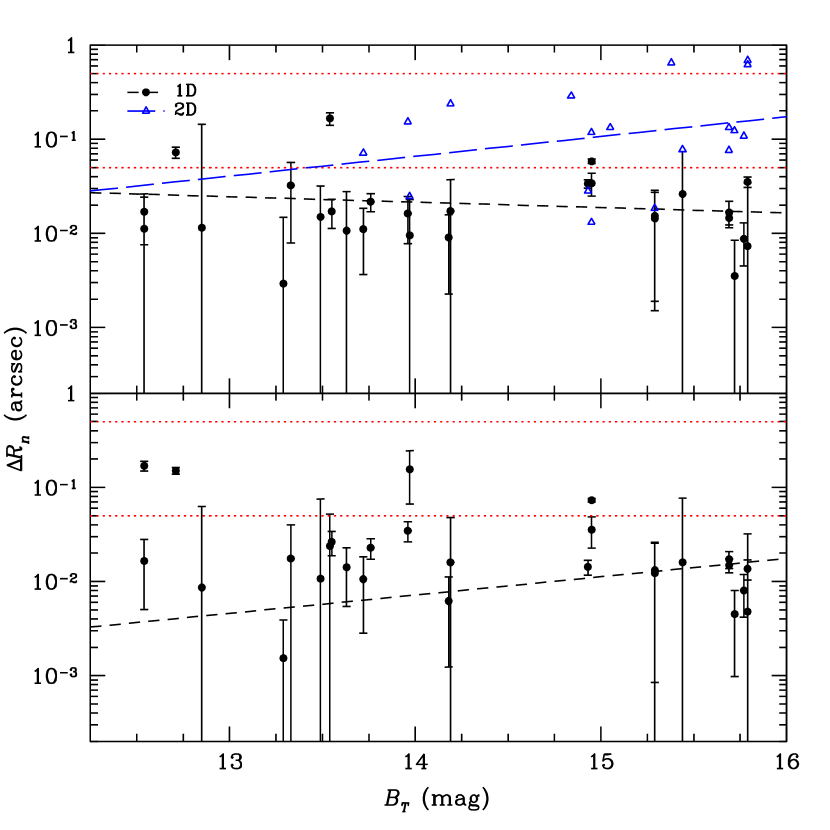
For the remaining 28 galaxies in question, an analysis slightly different to that used in C06 was performed. In C06, the galaxy photocenter was determined by taking the mean of the positions of all fitted isophotes satisfying . However, because of the possibility that isophotes might drift from the center due to bright sources in the field of view (causing an artificial offset in the photocenter calculated using the above method), we have adopted a different procedure in this work, where the photocenter and its error was determined by running ellipse to fit a single isophote with a semi-major axis length of approximately . As in C06, the position and error of the centroid of the nucleus were taken as the smallest fitted ellipse from the full ellipse run. We note that the geometrical parameter errors output by ellipse are calculated from the errors of the harmonic fit, with the first and second harmonics removed. The errors from the photocenter and centroid were then added in quadrature to obtain the total error on the offset. The results of this procedure are plotted as the black filled circles in Figure 6. We find that almost all of the galaxies in our sample have an offset of less than . The four that do have a larger offset (FCC 63, FCC 193, FCC 177, and FCC 277) have in only one of the two bands.
We generally observe the offsets from our 2D analysis to be larger than those determined using our 1D method. This is due to the fact that the 2D fitting procedure does not allow the ellipse parameters to vary with radius, and returns the model that best fits the average parameters of the entire galaxy, giving more weight to the outer regions in the determination of the photocenter. Thus, for our 2D analysis, we are not concerned with offsets larger than , and only three galaxies are found to have offsets larger than this — FCC 119 (), FCC 324 (), and FCC 288 (). FCC 119 is fairly irregular in structure, with a significant amount of dust in its core. FCC 324 and FCC 288 are both low surface brightness, highly flattened galaxies, with no obvious clusters near the photocenter that may have caused source confusion with what we consider to be the nucleus. We conclude that in our sample, at most % of the nuclei are offset at the level of or more, consistent with the findings of C06 for the Virgo cluster.
To measure any trend between offset and galaxy luminosity, we perform a weighted least-squares fit to the data from Figure 6. Using the offsets from our 1D analysis, we obtain
| (5) |
and from our 2D analysis,
| (6) |
The slopes of these relations do not indicate any significant trend between offset and galaxy luminosity. The errors on the fitted parameters are the standard errors.
Finally, some of the galaxies in our sample that we do not find to be nucleated may, in fact, be “dIrr/dE transition” objects, where a nucleus could be in the process of formation.555A prototype for this class is VCC1512 in the Virgo cluster which contains a prominent central excess that is composed of blue, densely packed star clusters. In particular, FCC 152 and FCC 26 are irregular in shape and contain many star clusters and significant amounts of dust in their central regions. It is possible that one or more of these clusters could be nucleus progenitors that will migrate inwards through dynamical friction (see §4.3.1).

3.3. The Nucleus-to-Galaxy Luminosity Ratio
Previous studies of early-type dwarfs (Lotz et al., 2004; Grant et al., 2005; Graham & Guzmán, 2003), including C06, found that nucleus brightness increases with host galaxy brightness. Similar relations are known to exist for the nuclear clusters in late-type galaxies (see, e.g., Carollo et al., 1998; Böker et al., 2004). A plot of nucleus versus host galaxy magnitude, the latter calculated by integrating the Sérsic profile best-fitting the main galaxy component over all radii, is shown at the top of Figure 7. Weighted best-fit linear relations of the form:
| (7) |
were fitted to the data, where and are nuclei magnitudes and and are the galaxy magnitudes. The best-fit parameters (, , ) are given in Table 3, where the quoted errors are the standard errors. Results are given for the two cases of fixing the slope at , and allowing it to vary freely (shown respectively as the solid and dashed lines in the upper panel of Figure 7).
| Sample | Band | |||||
|---|---|---|---|---|---|---|
| (mag) | (mag) | (dex) | (dex) | |||
| ACSFCS | ||||||
| ACSFCS |
Since the best-fit slope of the nucleus-galaxy luminosity relation is very nearly one, we consider the possibility of a constant nucleus-to-galaxy luminosity ratio, , where and are nucleus and galaxy luminosity, respectively. In the bottom of Figure 7, is plotted as a function of host galaxy magnitude in the same band. The values of the weighted means and standard deviations are given in Table 3, while the weighted mean ratio and standard error on the mean from both bands is
| (8) |
This is larger than the value of % found in C06 (a 1.9 discrepancy). At first glance, this might suggest that, at a given luminosity, early-type galaxies in Fornax were slightly more efficient in assembling their nuclei than those in Virgo; however, the difference is due to the use of Sérsic rather than King models in fitting the ACSFCS nuclei. As Sérsic profiles with even moderate have somewhat extended wings, they increase the inferred luminosity of the nuclei relative to the King models (whose defining characteristic is a tidal truncation radius). Re-fitting the Virgo data with S2 profiles confirms this conclusion — in § 4.1.2, where the new fits to Virgo are presented, we find agreement between for both clusters.
Finally, due to the definition of , the best-fit relation from Equation LABEL:eq:eta1 can be recast in terms of and galaxy magnitude, where and . This relation is plotted as the dashed line in the bottom panels of Figure 7. Although we do not see any trend between and galaxy luminosity, we note that in a study of galaxies containing both a nucleus and a black hole by Graham & Spitler (2009), it was found that the ratio of total CMO mass to spheroid mass tended to decrease in more massive galaxies.
3.4. Luminosity Function
One mechanism for the formation of galaxy nuclei is through multiple mergers of GCs that sink to the galaxy center by dynamical friction (e.g., Tremaine, 1976; Capuzzo-Dolcetta, 1993; Capuzzo-Dolcetta & Tesseri, 1999; Lotz et al., 2001; Bekki et al., 2004). A comparison of the luminosity function of our nuclei with that of the GCs identified in the ACSFCS can offer some insight into this process. In Figure 8, we present the results of a weighted maximum-likelihood fit to the luminosity functions of the nuclei, using a normalized Gaussian:
| (9) |
While this choice of parameterization is commonly used for GCs, there is no physical reason that the nuclei should have a Gaussian distribution. It is, nevertheless, a useful departure point for the purpose of comparison with the GCs. To parameterize the GC luminosity function, we also performed a maximum-likelihood fit of a normalized Gaussian, using the GC turnover magnitudes for each galaxy (which have been corrected for completeness), taken from Paper VIII. Each turnover magnitude was weighted by the number of GCs in the galaxy.
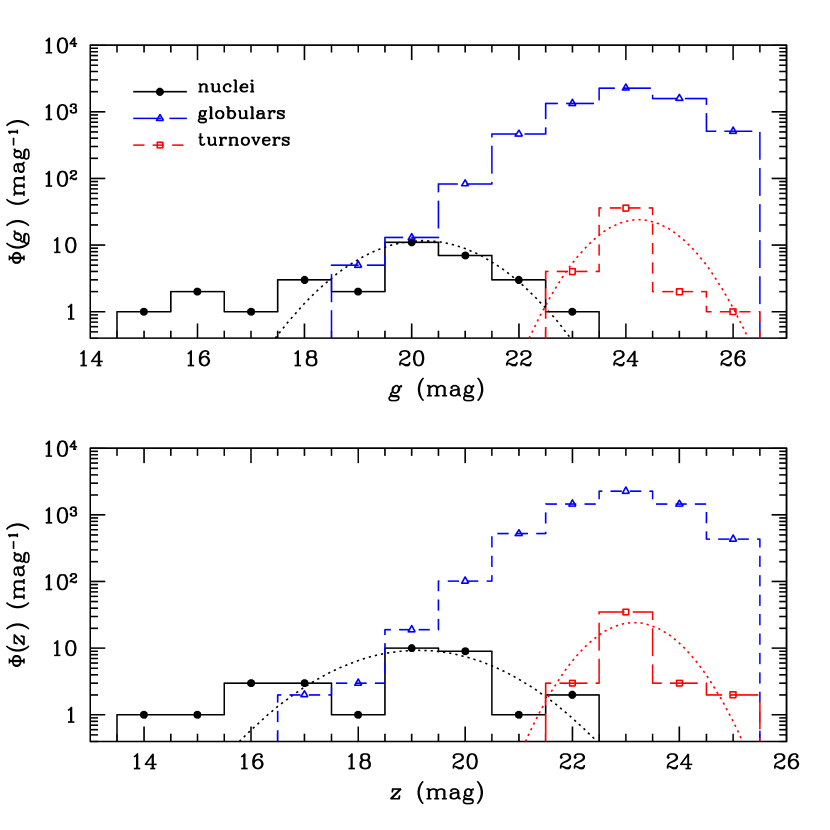

Our GC sample consists of candidates with probability index (see Paper VIII for more details on the GC probability index, and a detailed study of the GC luminosity functions). The best-fit parameters for both nuclei and GCs are given in Table 4, where the errors on the fitted parameters are the standard errors. We find the luminosity function of the nuclei to be both brighter, and have a greater spread, than that of the GCs. The difference in the means is mag in each band; that is, on average the nuclei are brighter than a typical GC.
In reality, since we find the nucleus-to-galaxy luminosity ratio to be roughly constant, the nucleus luminosity function should reflect that of the host galaxies (albeit with more scatter), and is most likely parameterized by a Schechter function truncated on both ends — on the bright end because we find no bright galaxies that are nucleated, and on the faint end because our sample is magnitude limited. To illustrate this, we show in Figure 9 a Schechter function overlaid on the -band galaxy luminosity distribution of the FCC and the ACSFCS. We then apply cutoffs at and mag (so that we are left with the magnitude range of the nucleated galaxies in our sample), and scale it down by (since we have 34 galaxies in this magnitude range, 31 of which are nucleated), and shift the Schechter function over by mag (which corresponds to an of 0.41%) and mag (to convert roughly from to ). Finally, we convolve it with a Gaussian with mag, the unweighted standard deviation of , to take the scatter around into account.666We use the unweighted standard deviation in this case, because we are looking to reproduce the observed rather than intrinsic scatter. The resulting function plotted over the nucleus luminosities shows good agreement, apart from a few bright outliers; specifically, the nuclei from FCC 63, FCC 47, and FCC 148 have . Each of these galaxies have a complex central structure that may be contributing to their brightness, either by causing accurate nucleus parameterization to be more difficult, or due to the fact that, in these cases, the nucleus themselves may be more complex.
| Sample | Band | ||||
|---|---|---|---|---|---|
| (mag) | (mag) | (mag) | (mag) | ||
| ACSFCS | |||||
| ACSFCS |
3.5. Structural Properties and Scaling Relations
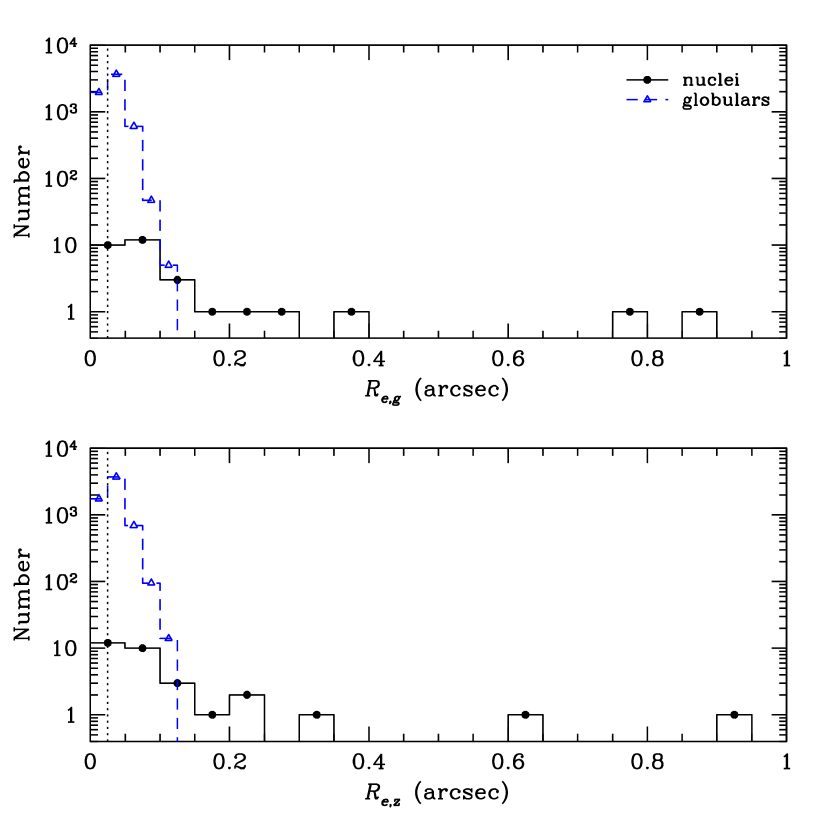
Nuclei at the distance of the Fornax cluster are almost never resolved in ground-based imaging, as 1″ corresponds to 100 pc at a distance of 20 Mpc. However, with ACS resolution it is possible to measure sizes for nuclei as small as (see C06, ). In Figure 10, we present a comparison of the effective radii of the ACSFCS nuclei and GC candidates. On average, the nuclei are larger in size, and have a much greater spread, than the GCs, although the considerable overlap between the two distributions shows that the most compact nuclei are very nearly the same size as typical GCs (Paper VII).
The two most prominent outliers are the nuclei of FCC 63 and FCC 47; both of these nuclei were also found to be the brightest in our sample (see § 3.4). Regardless, Figure 10 clearly demonstrates that the nuclei have a size distribution that peaks at compact sizes, and an extended tail populated by larger nuclei. The median sizes of the full sample are found to be (7.2 pc) and (7.0 pc) in the - and -bands, respectively.
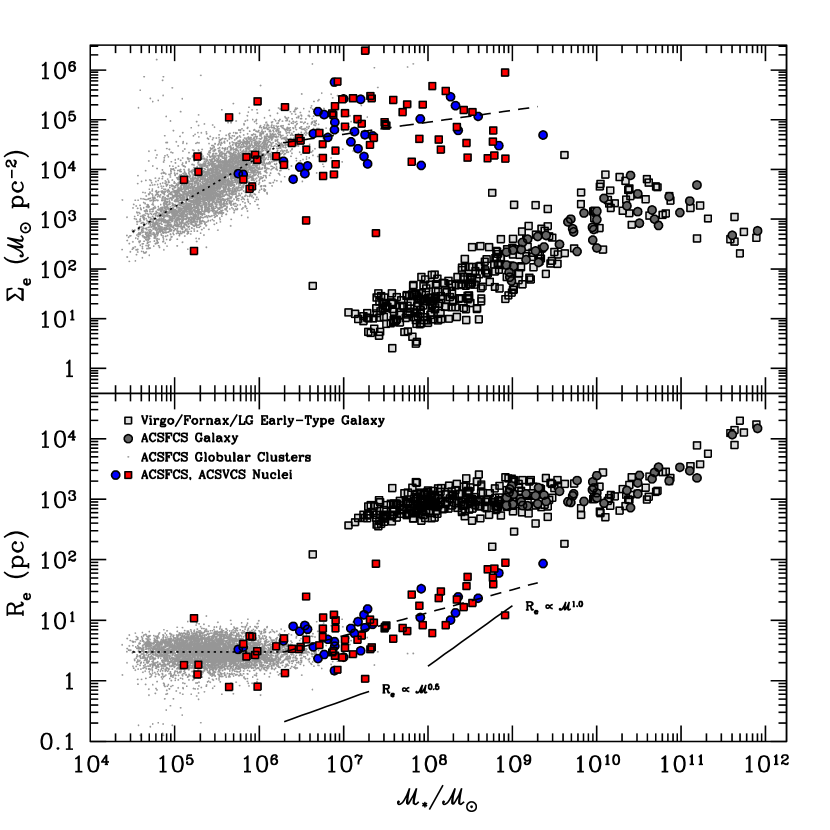
Figure 11 shows scaling relations for the nuclei from the ACSFCS and ACSVCS. In the upper panel, we plot the effective mass surface density, , against total stellar mass, , calculated from the observed colors and the relations of Bell et al. (2003). The lower panel shows effective radius as a function of stellar mass. In both panels, we also plot ACSFCS GCs, and the sample of early-type galaxies in Virgo, Fornax and the Local Group from McLaughlin et al. (2012, in prep.). As found by Jordán et al. (2005), the GCs have a size of pc that is nearly independent of mass, while the early-type galaxies show a smoothly varying – relation, a reflection of the fact that galaxies form a non-homologous family (McLaughlin et al. 2012, in prep.).
This figure highlights several other interesting properties of the nuclei. First, there is an obvious similarity in the scaling relations of the Fornax and Virgo nuclei; we shall return to this point and its implications for nucleus formation models in §4.1 and §4.3. The addition of the ACSFCS nuclei also reaffirms the trend noted by C06 that the nuclei, unlike GCs, obey a size-mass relation that merges with the GC sequence at low mass. For reference, the dashed line in the lower panel of Figure 11 shows the predicted scaling relation for nuclei that are assembled from repeated GCs mergers, (Bekki et al., 2004). The corresponding – relation is shown in the upper panel. Based on structural parameters alone, we conclude that the GC merger model is broadly consistent with the data (although the extremely red colors of the brightest nuclei pose a challenge to this model in its simplest form). The two solid lines in the lower panel show relations of the form and , which will be discussed in §4.3.1.
3.6. Nuclei Colors
As in C06, we find a relationship between nuclei colors and magnitudes with the brighter nuclei having redder colors and residing in more luminous hosts. This is shown in Figure 12, where we plot the nucleus 4-pixel aperture colors against -band magnitudes. Significant scatter is seen for the brighter galaxies, which are labeled with their FCC number. This scatter was also seen in C06, although in Virgo galaxies bright nuclei appeared to be preferentially red, while in the case of Fornax, bright nuclei are seen to scatter to both red and blue colors. The increased scatter in the color of the bright nuclei may simply reflect the more complex formation and enrichment histories in their inner regions of brighter, more massive galaxies: mergers, gas inflow, star formation, and GC accretion would naturally lead to a greater degree of scatter in the general color-magnitude trend. However, we caution that firm conclusions are difficult to draw, since at least part of the scatter is likely the result of larger observational errors, given the difficulty of measuring accurate photometric parameters for nuclei residing in luminous, high surface brightness galaxies.
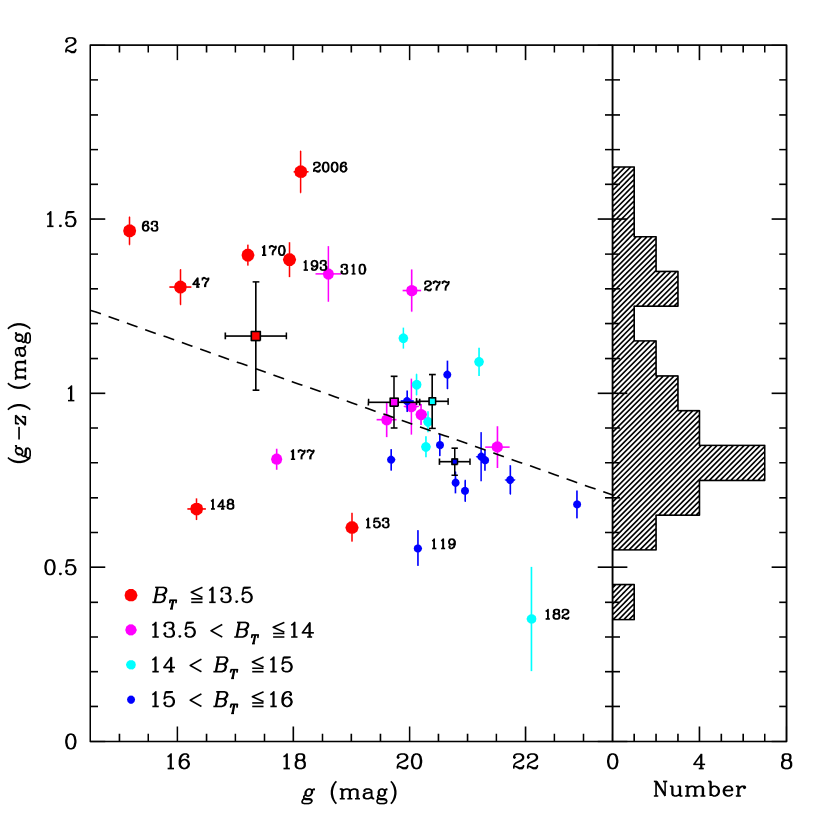
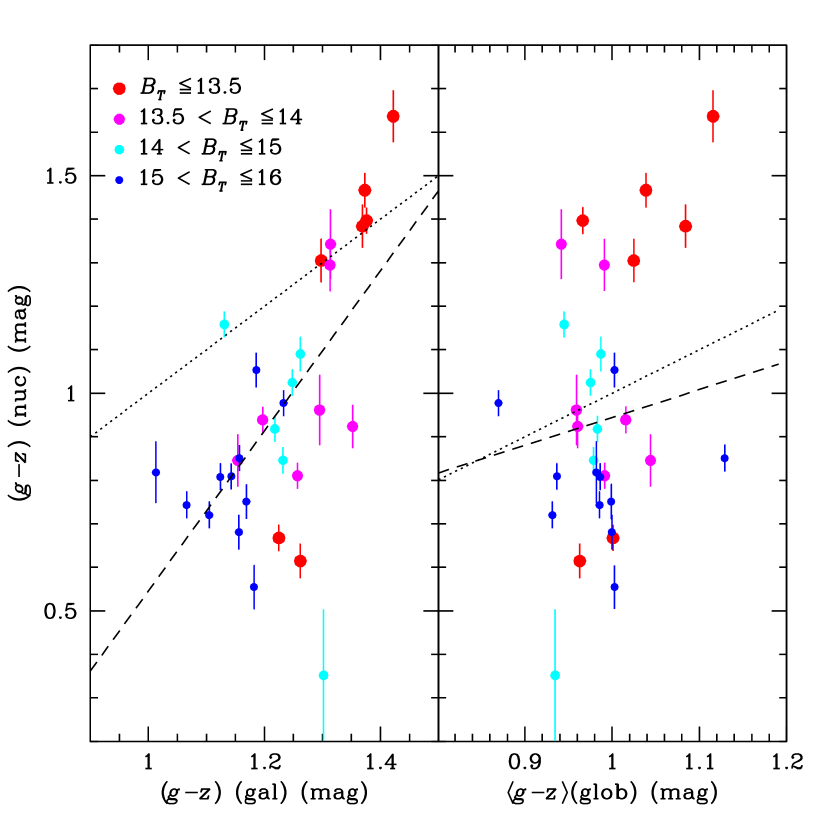
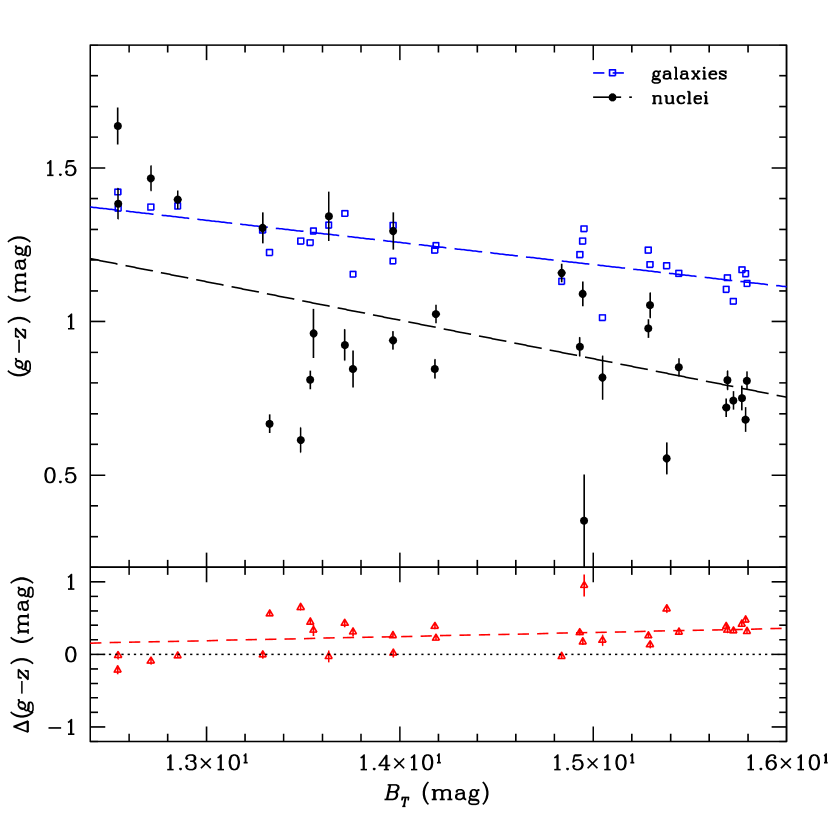
Figure 12 also shows the weighted line of best fit for nuclei in host galaxies fainter than :
| (10) |
Such color-magnitude (or possibly metallictiy-mass) relations are generally thought to be a sign of self-enrichment in low-mass stellar systems (e.g., Dopita & Smith, 1986; Morgan & Lake, 1989; Brown et al., 1991; Recchi & Danziger, 2005; Strader & Smith, 2008; Bailin & Harris, 2009). It would not be surprising to observe the same self-enrichment in nuclei, given the location of the nuclei at the centers of their host galaxies, where compressive tidal forces would aid in the retention of chemically enriched gas.
The colors of the nuclei compared to the mean color of their host galaxy’s GCs (calculated using the GC sample from Paper VIII) are examined in the right-hand panel
of Figure 13. We find only a very weak trend that redder nuclei also have redder GCs, where a weighted least-squares fit gives (with standard errors)
| (11) |
Since mean GC color has been found to correlate with that of the host galaxy (e.g., Larsen et al., 2001; Peng et al., 2006), we might expect to find a relation between the colors of nuclei and their GCs, given that we also find a correlation between nuclei and galaxy colors, plotted in the left-hand panel of Figure 13. The weighted best-fit line with standard errors is given by
| (12) |
which indicates that bluer nuclei tend to lie in bluer host galaxies, and vice-versa. The nuclei are also found to have a larger range in colors, and are in most cases bluer, than their host galaxies.
In Figure 14, we show galaxy and nuclei colors as a function of host galaxy luminosity. The colors of both the galaxies and the nuclei are found to become redder with increasing host luminosity:
| (13) |
where the errors on the fitted parameters are the standard errors. We find the nuclei colors to vary more steeply with host luminosity than those of the galaxies, although the trend for the nuclei is quite weak for galaxies fainter than . Examining the offset between galaxy and nucleus colors reveals that those nuclei that are redder than their hosts lie predominantly in high-luminosity galaxies. The weighted least-squares relation and standard errors for the color difference is given by
| (14) |
On average, we find the nuclei to be bluer than their hosts by mag. If we exclude the nuclei in galaxies with (the regime in which the nuclei are found to be redder than their hosts) we obtain a mean offset of mag, where the errors are the standard error of the mean.
4. Discussion
4.1. The Role of Environment: Comparison to the ACSVCS
As described in §1, our Fornax survey was preceded by a similar study of 100 early-type galaxies in the Virgo cluster (ACSVCS, Côté et al. 2004) where an investigation into the properties of the nuclei in ACSVCS galaxies was carried out by C06. Our prime motivation for a study of galaxies in the Fornax cluster is to provide a first glimpse into the properties of nuclei in two, rather different, clusters, and an assessment of the role played by environment in nucleus formation and evolution. The interested reader is referred to § 1 of Paper I, which compares some key properties of the two clusters. Briefly, Virgo is overall a much larger cluster, with a mass almost 10 times that of Fornax (M M☉ vs. (McLaughlin, 1999; Tonry et al., 2000; Drinkwater et al., 2001)), and a velocity dispersion twice as large ( vs. km s-1 (Binggeli et al., 1987; Drinkwater et al., 2001)). Compared to the Virgo Cluster, Fornax is poorer (Richness Class 0 vs. 1, (Abell et al., 1989; Girardi et al., 1995)) and more compact (R vs. Mpc). Its intracluster medium (ICM) has both lower temperature (1.20 vs. 2.58 keV) and metallicity (0.23 vs. 0.34 solar) (Fukazawa et al., 1998), with the Fornax electron density at a given radius being about 1/4 that of Virgo (Nulsen & Bohringer, 1995; Paolillo et al., 2002).
In this section, we will directly compare the results from both surveys. While C06 used King profiles for the nuclei in their paper, the ACSVCS results have since been updated with Sérsic model fits to the nuclei, which allows a fair comparison between the two studies.777See https://www.astrosci.ca/users/VCSFCS/DataProducts.html Distances from Paper V were used to calculate absolute magnitudes and physical sizes for both Fornax and Virgo galaxies. We note that the two surveys have slightly different cutoff magnitudes ( for Virgo and for Fornax) and that the distance modulus of Fornax is 0.5 mag larger than that of Virgo (Paper V). Therefore, the Virgo galaxies can reach absolute magnitudes roughly 1 mag fainter than those in Fornax.
4.1.1 Frequency of Nucleation
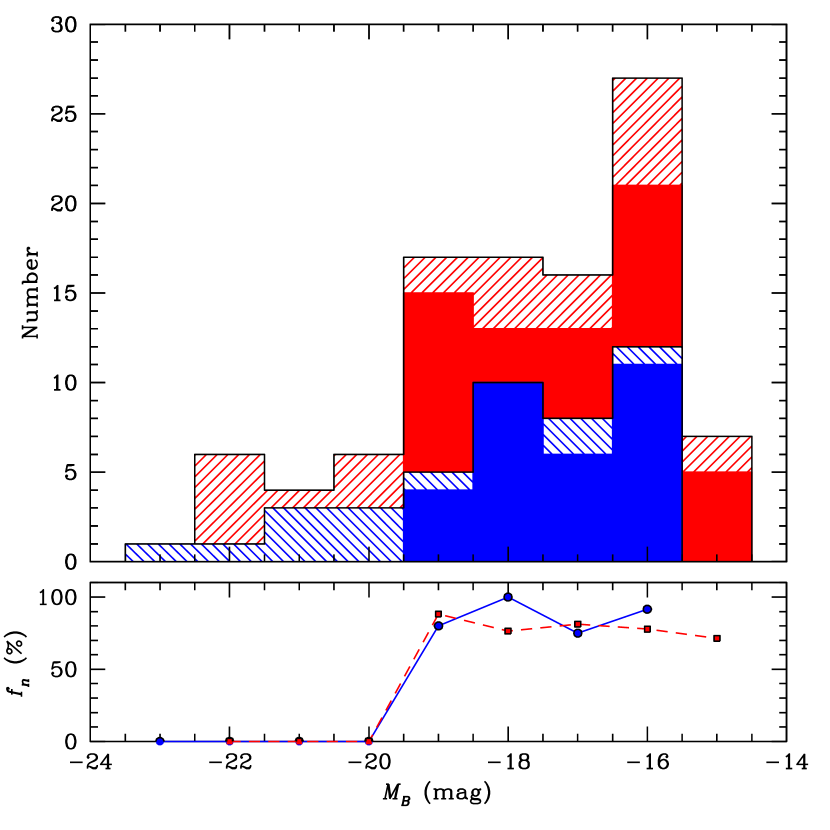
In Figure 15, we plot the frequency of nucleation of the Virgo and Fornax program galaxies as a function of their absolute blue magnitude. The Virgo galaxies appear in red, and the Fornax galaxies are shown in blue. In the upper panel, we overlay histograms for all galaxies (hatched) and nucleated galaxies (solid). This figure demonstrates how the Virgo galaxy magnitudes extend to mag below those of Fornax, as explained above. Our Virgo sample contains 100 galaxies, 67 of which are found to be nucleated, so we obtain a total frequency of nucleation, . This is in excellent agreement with the value of found for our full Fornax sample.
The bottom panel shows the frequency of nucleation in each luminosity bin. Both clusters exhibit very similar distributions with for the bright galaxies, while fainter than , continuously stays above . Since our Virgo sample has 84 galaxies below , and our Fornax sample has 35, we find the total frequency of nucleation for galaxies fainter than to be % for Virgo and % for Fornax.
Both C06 and this study have shown that this sharp increase in frequency of nucleation compared to previous ground based studies (the VCC and FCC) is due mainly to surface brightness selection (see Figure 7 and 8 in C06 and Figure 5 in this work), which can be attributed to the improved resolution and depth offered by the ACS imaging. That is, the excellent angular resolution of HST has allowed us to uncover previously undetected nuclei in both very high surface brightness galaxies, where the nuclei are difficult to distinguish from the main body, and low luminosity galaxies, in which the nuclei may lie below the magnitude limit of the older photographic surveys.
4.1.2 Nucleus-to-Galaxy Luminosity Ratio
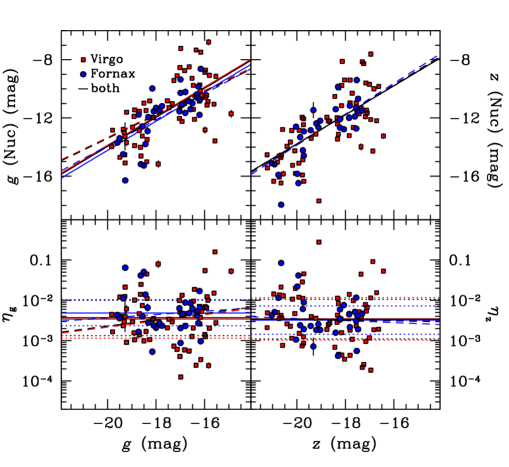
As in §3.3 and Figure 7, absolute nucleus magnitude has been plotted against absolute galaxy magnitude in the top panels of Figure 16. Relations of the form Equation LABEL:eq:eta1 have been fitted using weighted least-squares to the Virgo and Fornax samples, both separately and combined, and the parameters and standard errors are recorded in Table 5, the results of which are in agreement to within the errors for both galaxy samples.
We also plot nucleus-to-galaxy luminosity ratio as a function of absolute galaxy magnitude in the bottom panels of Figure 7. The values for the mean and standard deviation of are given in Table 5. Taking the mean nucleus-to-galaxy luminosity ratio of both data sets combined, we obtain the following values for each band:
| (15) |
which gives a mean value for both bands of
| (16) |
The quoted errors refer the standard error on the mean.
Finally, we note that, due to the definition of , the best-fit relation from Equation LABEL:eq:eta1 can be recast in terms of and galaxy magnitude, where and . This relation is plotted as the dashed line in the bottom panels of Figure 7, and we find that we do not see any significant trend between nucleus-to-galaxy luminosity ratio and galaxy magnitude.
| Sample | Band | |||||
|---|---|---|---|---|---|---|
| (mag) | (mag) | (dex) | (dex) | |||
| ACSFCS | ||||||
| ACSVCS | ||||||
| Combined | ||||||
| ACSFCS | ||||||
| ACSVCS | ||||||
| Combined |
| Sample | Bandpass | ||
|---|---|---|---|
| (mag) | (mag) | ||
| ACSFCS | |||
| ACSVCS | |||
| ACSFCS | |||
| ACSVCS |
4.1.3 Nucleus Luminosities and Sizes
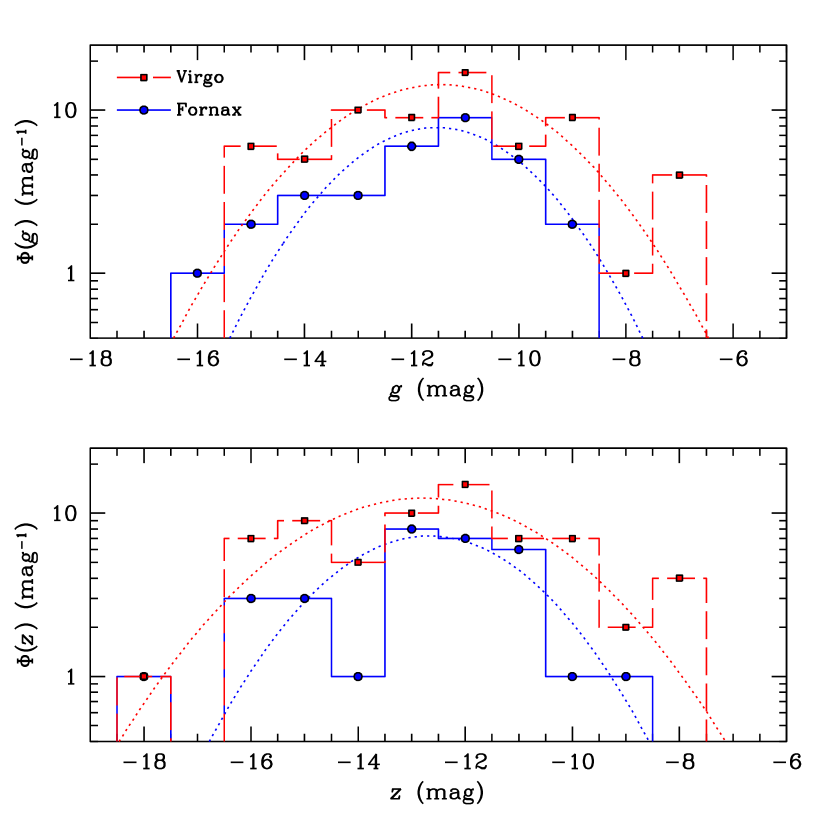
In Figure 17, histograms of nuclei luminosities for both our Virgo and Fornax sample are compared. The parameters of the weighted maximum-likelihood fit of a normalized Gaussian to each sample are given in Table 6, where the errors on the fitted parameters are the standard errors. Although we find differences between between the two surveys, there amounts are comparable to the errors estimated for the nuclei magnitudes.
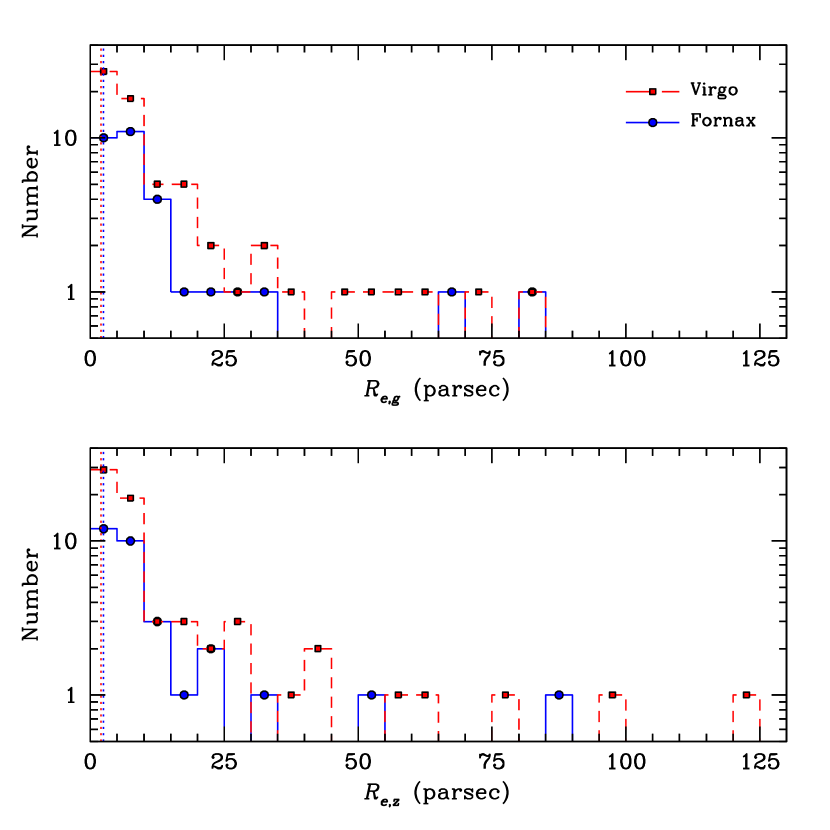
We plot a histogram of nucleus sizes in Figure 18 for both our Virgo and Fornax samples. Although there is a large range in size (the very large Virgo nucleus belongs to VCC 1178), most nuclei appear to have radii pc. The typical sizes are in good agreement, with median values of pc in the -band for both clusters, and pc and pc in the -band for Virgo and Fornax respectively.
4.1.4 Other Properties
In addition to the above properties, we find the Virgo and Fornax nuclei to be remarkably similar in a number of other ways. First, and most obviously, both the ACSFCS and ACSVCS galaxies exhibit a trend along the luminosity function in which their central surface brightness profiles gradually change from having a luminosity “deficit” to an “excess”: see, e.g., Figures 3 and 4 in C06, Figure 1 of Paper II, Figures 2 and 3 here, as well as a detailed discussion of this trend in Paper IV.
Plotting surface brightness against magnitude, the nuclei are found to have different scaling relations than the GCs (see Figure 18 in C06 and Figure 11 here). Although C06 used integrated nucleus colors in their study, our use of aperture colors may be a more appropriate comparison to the King profiles used to determine the integrated nucleus magnitudes. Indeed, the best-fit line parameters outlining the color-magnitude relation for the nuclei with , given by Equation 13 in C06 and Equation 10 in this work, are in good agreement.
Overall, we find a striking similarity between the nuclei of Virgo and Fornax, despite the clear environmental differences between the two clusters. This agreement suggests that the physical characteristics of individual galaxy clusters (such as ICM density), or the processes that depend on them (such as ram pressure stripping efficiency), do not play a dominant role in the formation and evolution of nuclei in early-type galaxies. Thus, it seems we can consider the nuclei examined here as being representative of those in early-type galaxies in general.
4.2. Extension to Low Luminosity: Comparison to the Local Group
Although the ACSVCS and ACSFCS provide a reliable measurement of the nucleation frequency for galaxies brighter than mag, it is instructive to consider the frequency of nucleation in galaxies fainter than this magnitude limit. We can do so by examining the members of the Local Group, where the smallest observed dwarf galaxies reach magnitudes faint as mag and can have effective radii on the order of pc (see, e.g., Martin et al., 2008). As sample completeness is a concern for such faint, compact systems, we focus on the subset of early-type galaxies brighter than .
At present, there are 25 known early-type galaxies in the Local Group brighter than this limit (compiled from Mateo, 1998; McConnachie et al., 2005; Brasseur et al., 2011). Of these, only two (NGC 205 and M32) are brighter than the ACSVCS limiting magnitude of mag (Mateo, 1998), both of which are known to be nucleated (e.g. Kent, 1987; Lauer et al., 1998; Mateo, 1998; Butler & Martínez-Delgado, 2005; De Rijcke et al., 2006). Moving down the luminosity function, at most six other galaxies may contain either nuclei or kinematically/structurally distinct features near their core, listed in order of decreasing luminosity: NGC 147 (De Rijcke et al., 2006), Sagittarius (Mateo, 1998; Layden & Sarajedini, 2000; Monaco et al., 2005; Bellazzini et al., 2008), Fornax (Coleman et al., 2004, 2005; Coleman & de Jong, 2008), Sextans (Kleyna et al., 2004; Walker et al., 2006), Andromeda II (McConnachie & Irwin, 2006), and Ursa Minor (Kleyna et al., 2003; Palma et al., 2003).888Although it is traditionally classified as non-nucleated, we include the Fornax dSph in this list since GC #4 is located half a core radius from the galaxy photocenter (see Figure 1 of Coleman & de Jong, 2008) and might thus be classified as a dwarf with an offset nucleus if moved to the distance of the Virgo or Fornax clusters. Considerable caution is advisable here since, in some cases (e.g., in Ursa Minor and, especially, in Sextans), the “nuclei” are rather subtle substructures (sometimes only apparent with the addition of kinematic data) that bear little resemblance to the prominent, compact nuclei seen in the faintest ACSVCS and ACSFCS galaxies. Yet, even with this liberal definition of a “nucleus”, only 8 out of the 27 Local Group early-type galaxies () can be classified as nucleated. If we exclude Fornax, Ursa Minor and Sextans from the list of nucleated galaxies, then falls to 19%. While it is possible that some nuclei have yet to be discovered, it seems certain that many of the faint Local Group galaxies do not contain a nucleus; e.g., McConnachie & Irwin (2006) studied of structural properties of six Andromeda satellites using deep, homogeneous imaging, and found a nucleus in only a single object (And II).
We conclude that the frequency of nucleation along the Local Group sample is clearly far lower than in either our ACS surveys of the Fornax or Virgo clusters. Why is there such a large disparity in ? We speculate that the lack of nuclei in very faint galaxies could be related to the general absence of GCs in galaxies below (see, e.g., Peng et al., 2008). If nuclei in low-mass galaxies are assembled through GC infall and mergers (see §4.3.1), then the presence of GCs would obviously be a prerequisite for nucleus formation. The faintest galaxies in the Local Group known to contain GCs are Sagittarius and Fornax, with and respectively (Mateo, 1998). The former is unquestionably nucleated, while Fornax may meet the definition of a nucleated galaxy (see above). Because no Local Group dwarfs below this magnitude are known to contain GCs, such galaxies might have been unable to form a nucleus if star cluster infall is the dominant mode of nucleus formation in low-mass systems.
It is also interesting to note that, assuming a constant nucleus-to-galaxy luminosity ratio of 0.4%, then the expected nucleus magnitude of a mag host would be mag. This corresponds closely to the mean turnover magnitude of the globular cluster luminosity function, mag (e.g., Jacoby et al., 1992; Harris, 2001; Brodie & Strader, 2006), suggesting that galaxies may be unable to form nuclei at the point where the expected nucleus luminosity would fall below the typical GC luminosity.
However, as caveats we firstly note that the nucleus of Sagittarius (Monaco et al., 2009) as well as the very central region of the Andromeda satellite NGC 205 (Siegel et al., 2007) have been observed to have undergone multiple star formation episodes, which indicates that other processes in addition to GC accretion must have shaped their formation history. In addition, the nuclei late-type dwarfs have been shown to not form form exclusively from GC infall (Walcher et al., 2006, e.g.,) or gas accretion (Hartmann et al., 2011), even though it has been observed that GC specific frequency is independent of morphology (Georgiev et al., 2010) and thus should be the same for both early- and late-type dwarfs.
4.3. Formation and Evolution Models
The origin of nuclei remains an open theoretical problem, with two main avenues of nucleus formation presently considered most viable. The first proposes that a galaxy’s star clusters will experience orbital decay due to dynamical friction and spiral inwards, eventually coalescing at the center of the galaxy. The second formation mode focuses on gas accretion at the center of the galaxy, followed by star formation. Some similarities in the scaling relations of nuclei and black holes (see §1) have also given rise to models that consider the formation of both types objects in a shared context. In this section, we shall examine theoretical studies of nuclei formation in light of our new results, as well as models that explore the relationship between nuclei and black holes.
4.3.1 Dissipationless Infall of Star Clusters
Tremaine et al. (1975) first suggested that the nucleus of M31 was formed from GCs that spiraled inward to the galaxy center due to dynamical friction, and this mechanism continues to offer an attractive explanation for the assembly of nuclei in at least some galaxies. Of course, not all clusters that come close to the center of a galaxy will necessarily contribute to the formation, or growth, of a stellar nucleus; as Capuzzo-Dolcetta (1993) showed, dynamical friction and tidal stripping are competitive processes, where GCs are more readily destroyed by large nuclei, limiting nucleus growth.
Nevertheless, some fraction of GCs are expected to avoid tidal disruption and could contribute to either nucleus formation, or the growth of pre-existing nuclei. Evidence in favor of this process was described in Capuzzo-Dolcetta & Tesseri (1999), who pointed out that the radial distribution of GCs in galaxies is less centrally concentrated than the halo stars (see also McLaughlin 1995, 1999; Côté et al. 2001, 2003; Peng et al. 2008). Such “missing” clusters could have contributed to nucleus formation. Monte Carlo simulations based on this premise by Lotz et al. (2001) predicted nuclei luminosities for dEs with that were consistent with observations for the brighter galaxies within this range, although they were overestimated for less luminous ones. The over-prediction of nuclear luminosities in their low-mass systems resulted from their short dynamical times — meaning that nuclei are able to grow very efficiently — in spite of the fact that these galaxies have relatively few star clusters (see e.g., Peng et al. 2008).
Numerical simulations by Oh & Lin (2000) and similar, higher resolution N-body simulations by Capuzzo-Dolcetta & Miocchi (2008a, b) were able to successfully reproduce the observed surface brightness profiles of known nucleated galaxies. A dependence on local tidal field was found in the Oh & Lin (2000) model, where disruptive tidal forces on the outskirts of galaxy clusters would alter GC orbits, increasing dynamical friction timescales and decreasing nucleation frequency. The Capuzzo-Dolcetta & Miocchi (2008a, b) models suggest that, if linear scaling is assumed, then the observed nuclei could have formed from the infall of tens, to hundreds, of GCs (see also §4.9 and §5.2.4 of C06). Both simulations found that nuclei may begin to coalesce away from the galaxy photocenter, although to quite different extents: i.e., up to kpc and settling within Gyr in Oh & Lin (2000), and pc away in Capuzzo-Dolcetta & Miocchi (2008a, b).
Other simulations by Bekki et al. (2004) observed that the scaling relations of nuclei formed through mergers of GCs would be notably different than those of the GCs. In §3.5, we discussed that the predicted scaling relation for nuclei in these simulations, , was generally in good agreement with observations (see Figure 11). More recent work by Bekki (2010) focused on simulations of star cluster infall due to dynamical friction in disk galaxies. He found that the effectiveness of dynamical friction did not depend strongly on bulge mass, but increased with smaller disk mass, and with larger disk mass fraction, galaxy surface brightness, and star cluster mass. The ratio of nucleus mass to disk mass was found to decrease as a function of increasing disk mass, with a mass ratio of for smaller disks, and for disks with masses . However, star cluster mergers on to a disk may not be sufficient to explain nuclei formed in spirals. N-body simulations by Hartmann et al. (2011), which aimed to reproduce the observed kinematics of the nuclei in M33 and NGC 4244, found that star cluster accretion on to a disk did not produce the necessary line-of-sight velocity rise, and at least half of the nucleus mass had to come from gas dissipation.
Some provisional evidence for dissipationless formation in at least some galaxies was presented in Paudel et al. (2011), who used optical spectroscopy for Virgo cluster dwarfs to study both their stellar populations and those of their nuclei. Despite the small sample and the different environment (Virgo vs. Fornax), their data present an interesting opportunity to speculate on possible formation mechanisms for the ACSFCS nuclei. Paudel et al. (2011) found that nuclei in a handful (5) of the faint () galaxies in their sample were older and more metal poor than their hosts, which is certainly suggestive of a connection to GCs. At higher luminosities, most of their nuclei were found to be younger than their hosts. While inconsistent with nucleus formation from old globular clusters, this observation may still be compatible with cluster infall, as our observations and many others have shown that ongoing star cluster formation can be present throughout some galaxies (e.g., Anders et al., 2004; Kyeong et al., 2010). In the ACSFCS sample, FCC 119, FCC 90 and FCC 26 are possible examples of galaxies with young cluster systems.
Additional support for such a scenario may come from the GC luminosity functions in Virgo and Fornax galaxies. The widths of GC luminosity functions are known to decrease significantly with galaxy luminosity, a trend that is accompanied by a slight decrease in turnover mass (Jordán et al. 2006, 2007b; Paper VIII). This truncation of the GC population on the bright end of the luminosity function may be caused, at least in part, by the shorter dynamical friction times as galaxies become less massive, although other (external) processes could also play a role (see §7.2 of Jordán et al. 2007b).
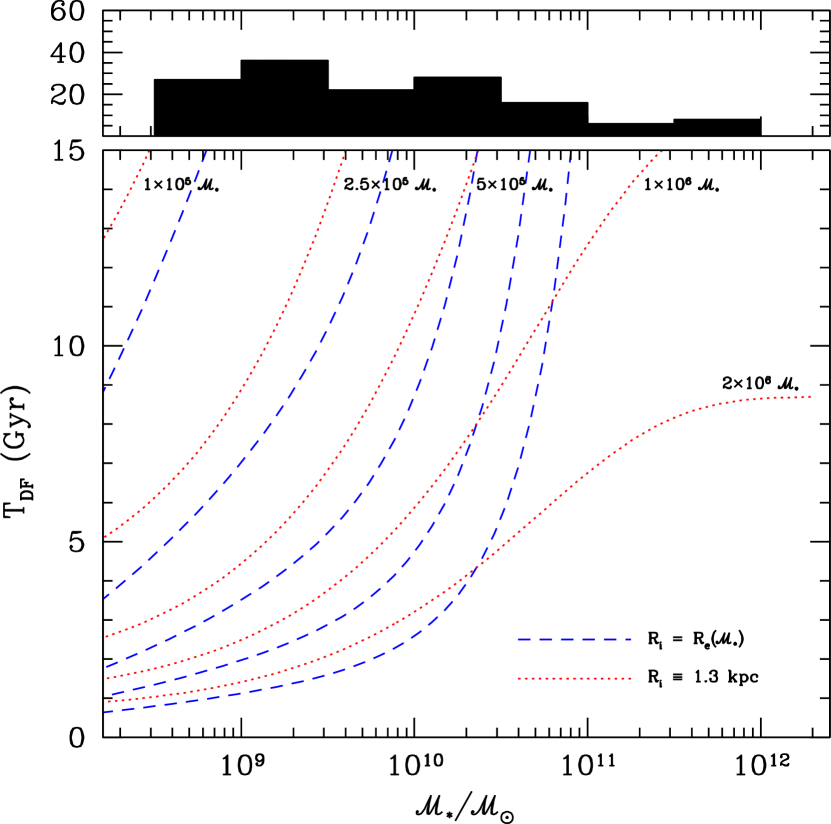
We revisit the question of star cluster infall efficiency by calculating the dynamical friction timescale, TDF, for all galaxies in our ACS surveys of Fornax and Virgo. The upper panel of Figure 19 shows the distribution of galaxy masses from the combined surveys (filled histogram), while the lower panel show the dependence of TDF on galaxy mass, , which is given by
Here is the initial galactocentric radius of the star cluster, is the circular velocity of the (assumed isothermal) galaxy, and is the mass of the star cluster (Binney & Tremaine, 2008). In this equation, is the coulomb logarithm, which is defined as
where is the maximum impact parameter between the cluster and the interacting particle (a star of mass m). Following Lotz et al. (2001), we assume where is the integrated-light velocity dispersion measured within from McLaughlin et al. (2012, in prep.). We also take for all galaxies, with measured directly from the ACS imaging (see §3.5 and Figure 11).
Calculations have been carried out for five different star cluster masses (i.e., 0.1, 0.25, 0.5, 1 and 2 million solar masses)999Recall that in the Milky Way, the GC mass corresponding to the peak of the luminosity function is (McLaughlin, 1999). and for two assumptions for . In the first case, we take (see also Lotz et al. 2001) which is shown as the dashed blue curves in Figure 19. In the second case, we simply fix at the median effective radius, kpc, for all galaxies in the ACSFCS sample. The results in this case are indicated by the dotted red curves in Figure 19. Although TDF clearly varies with the assumed cluster mass and the precise choice of , the strong mass dependence noted by previous investigators is clearly apparent in this figure. In particular, the dynamical friction timescales are dramatically shorter in galaxies with compared to higher-mass galaxies. We conclude that star cluster infall seems like a viable, indeed a likely, candidate for the growth of nuclei in low- and intermediate-mass galaxies in our sample. For the highest-mass galaxies, the mechanism appears much less viable given the fact that, in these systems, TDF greatly exceeds the Hubble Time for all but the most massive and centrally concentrated star clusters.
Finally, we conclude this section with some final remarks on Figure 11, which compared the structural parameters of nuclei to those of GCs and their host galaxies. While there is, as noted in §3.5, good agreement with the nuclei size-mass relationship found by Bekki et al. (2004) from simulations of GC mergers, there are reasons to believe that a single relation cannot be appropriate for all nuclei which, in our sample, span more than four decades in mass. For comparison, the simulated nuclei of Bekki et al. (2004) span a factor of just ten in mass. It is to be expected that the precise form of the size-mass relation in the context of the GC merger model will be different in different mass regimes. For instance, when only a small number of mergers contribute to the nucleus, we expect from the virial theorem and conservation of energy that . At later times, when the mass of the nucleus greatly exceeds the mass of an accreted GC, the relation should steepen to . These scaling relations, shown in the lower panel of Figure 11, are in good agreement with the observed sizes and masses.
All in all, based on the existing data, we believe that cluster infall must have played an important role in the formation of the nuclei the low- and intermediate-mass hosts within our sample. At the same time, the red colors of some of the largest and most massive nuclei (§3.6) present a strong challenge to this model, suggesting that an additional process — most likely the dissipational infall of metal-rich gas — likely begins to dominate the formation of nuclei in galaxies of progressively larger masses (Mihos & Hernquist 1994; \al@cote06, cote07; \al@cote06, cote07; Hopkins et al. 2008, 2009).
4.3.2 Dissipational Infall of Gas
It has long been suspected that nuclei could form through star formation following the accretion of gas in galaxy centers (van den Bergh, 1986), although the exact origin of the gas, and the mechanism that triggers the inflow, are matters of debate.
In some models, the gas is assumed to originate from outside the galaxy. Davies & Phillipps (1988) proposed that dEs may be formed from fading stellar populations in dwarf irregulars, where the accretion of Hi gas induced starbursts, the final one occurring in the center and forming the nucleus. Silk et al. (1987) predicted that the intergalactic medium (IGM) could fall into dwarf galaxies when it is cooled and compressed during group formation. This model noted that dwarfs closer to large galaxies may not be able to form nuclei as efficiently, since the large galaxy’s tidal field makes it difficult for the dwarf to capture the gas. Babul & Rees (1992) found an opposite trend with environment: they observe that nucleus evolution may depend on local IGM density, because this determines whether supernova-driven gas outflows are able to escape. Dwarfs in low-pressure regions would have their gas ejected and then fade away, while winds in dense environments would be restricted to the starburst region by the IGM. This confinement could cause gas to cool and recollapse, creating two short or one prolonged starburst.
Gas might also be funneled to the centers of galaxies which have disks and axisymmetric features. Milosavljević (2004) suggested that in spiral galaxies, magneto-rotational instability in the disk transports gas to the center. Bekki et al. (2006) and Bekki (2007) performed chemodynamic simulations of the inner kpc of dwarf galaxies with stellar masses of , to explore the remnant created through dissipative merging of stellar and gaseous clumps formed from nuclear gaseous spiral arms in a gas disk. The simulations produced nuclei which that rotating and flattened, consisting of stars with varying ages and metallicities. Although the initial clump was found to form off-center (about pc by visual inspection of the simulation data), it would fall into the center within Myr. They found that overall, the nuclei were characteristically younger and more metal rich than the host, with more massive hosts creating more metal-rich nuclei. Gas settling timescales increased with decreasing dwarf mass (due to feedback being more effective in smaller galaxies), so low mass dwarfs were found to have younger and bluer nuclei. More massive and dense nuclei were formed in more massive dwarfs with deeper central potentials, and both the mass and mass fraction of the nucleus were found to increase with spheroid mass. Nuclei in high surface brightness galaxies should also have higher surface brightness, owing to the increased dynamical friction due to higher stellar densities. The nucleus surface brightness was strongly dependent on the gas fraction of the host, and thus may be more likely to form in this manner in late-type galaxies with relatively large amounts of gas. Finally, the addition of a central black hole to the simulation had little effect on the properties of the remnant nucleus.
Another source of nuclear material, which was first proposed by Bailey (1980), could arise from stellar winds. It was found that only a small () amount of gas was needed to cause an inflow for an elliptical galaxy with . Seth (2010) observed that such a mechanism could produce the age, abundance gradient, and rotation curve seen in the nucleus of M32.
The dissipative infall of gas to the galaxy center can also be induced by galaxy mergers. Mihos & Hernquist (1994) performed N-body simulations of disk galaxy mergers, where they found that gas dissipation and the star formation that followed created dense stellar cores in the remnant. Similar higher resolution simulations by Hopkins et al. (2008, 2009), showed that gravitational torques during gas-rich mergers removed the angular momentum of the gas, which would then undergo gravitational collapse. The amount of gas infall was found to largely depend on the progenitor galaxy gas fraction, while the addition of a central black hole was not found to have a significant effect on the the properties of the final remnant. Unfortunately, these models lacked the resolution to study typical nuclei, particularly those in the low-mass galaxies: i.e., apart from a small number of cE galaxies in the ACSVCS sample, which have likely been heavily tidally stripped (e.g., Faber 1973; Ferrarese et al. 2006b; Côté et al. 2008; Chilingarian et al. 2009; Huxor et al. 2011; McLaughlin et al. 2012, in prep.), the simulated galaxies of (Hopkins et al., 2009) have masses , more than ten times larger than the masses of the faintest galaxies in the ACS surveys. However, in this restricted mass regime, the properties of these simulated galaxies are in good agreement with our ACSFCS (and ACSVCS) observations.
Likewise, the simulations of Bekki et al. (2006) and Bekki (2007), which instead focused on the low-mass galaxies, also appear to be consistent with observations, including those from our HST/ACS imaging and results from ground-based spectroscopy. First, the nuclei in these simulations were found to be younger and more metal rich than their hosts, with nucleus metallicity increasing with host mass, a trend that was seen in Paudel et al. (2011). Second, their finding that low-mass dwarfs have younger and bluer nuclei is consistent with some of the nuclei from Paudel et al. (2011), as well as with the nucleus colors observed in our study. Finally, they also found that the mass fraction of the nucleus increased with host spheroid mass, and that their simulated surface brightness profiles showed nuclei which become more prominent with increasing dwarf mass, whereas in low-mass dwarfs the nuclei were barely distinguishable. It is therefore possible, as discussed in §4.3.1, that nucleus formation through gas infall may be most significant for intermediate- and high-mass galaxies. In their analysis of the ACSVCS, C06 noted that some of the reddest and brightest nuclei “may be candidates for the dense stellar cores that form in numerical simulations (Mihos & Hernquist, 1994) when (chemically enriched) gas is driven inward, perhaps as a result of mergers.” Such a result can be reconciled with our nearly constant nucleus-to-galaxy luminosity ratio if star cluster infall accounts mainly for nucleus build up in lower-mass galaxies. At intermediate masses, both processes could contribute significantly to the growth of nuclei; candidates for such hybrid nuclei in the ACSFCS include FCC 43, FCC 249, FCC 310, FCC 148 and FCC 301, which may consist of both compact and extended components.
This basic scenario is also consistent with the general view that mergers (which can drive gas to the central regions of a galaxy) become increasingly important as galaxy luminosity increases, a consequence of the hierarchical merging paradigm. The observation that galaxy concentration — parameterized by Sérsic index — varies smoothly with galaxy luminosity (e.g., Jerjen & Binggeli 1997; Graham et al. 2003; Ferrarese et al. 2006b; McLaughlin et al. 2012, in prep.; see also §2.1) provides strong supporting evidence for this picture, as violent relaxation of merger remnants is thought to be responsible for the creation of de Vaucouleurs profiles (e.g. Barnes, 1988, 1992), while Sérsic index of both bulge and disks of spirals has been shown to increase after satellite infall (Eliche-Moral et al., 2005). Figure 20 shows the dependence of two fundamental parameters for nuclei — luminosity fraction and effective radius — against host galaxy Sérsic index (Paper III). Those galaxies whose internal structure has likely been transformed most extensively through mergers, accretions and harassment (i.e., those galaxies with high Sérsic indices) tend to have the most luminous and spatially extended nuclei (although the trend between and is statistically significant only when an unweighted fit is used). These trends are generally consistent with an increasing importance for gas dissipation as ones moves to higher and higher mass galaxies. Nuclei formed through merger-driven gas inflow could also be expected to follow a mass-radius scaling relation, as Hopkins & Quataert (2010) found that stellar systems may have a maximum stellar surface density, due to feedback from massive stars.
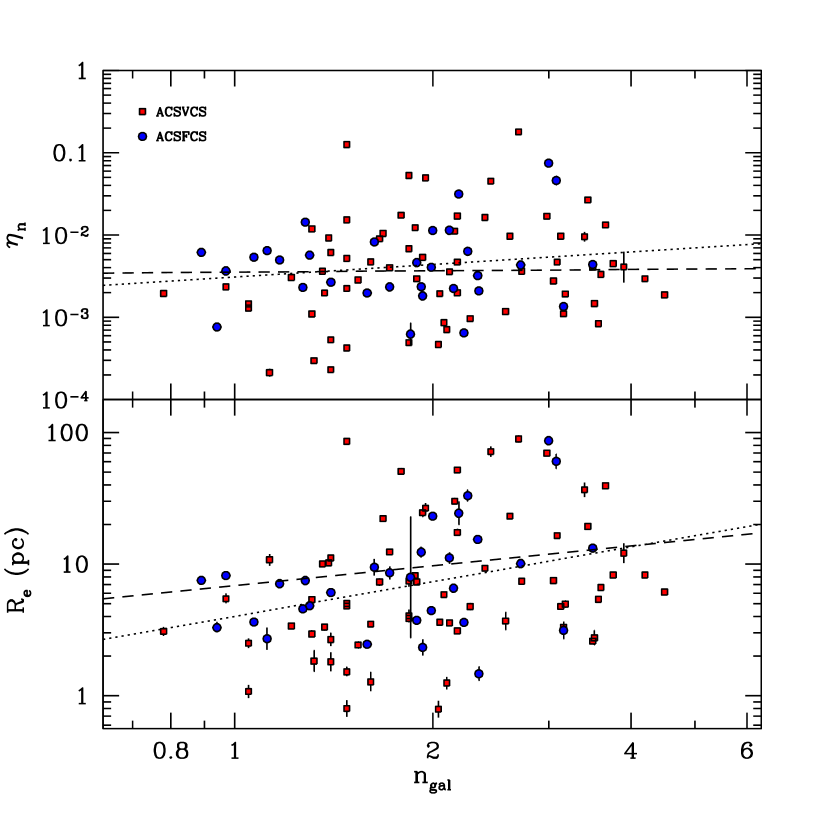
One complication with the gas inflow model is that it obviously requires the presence of gas, which is not consistent with the “classical” picture of early-type galaxies. However, both low-mass Es and high-mass “dEs” are now recognized to be quite complex, having been found to contain dust, spiral arms, embedded disks, and bars (Jerjen et al., 2000; Barazza et al., 2002; De Rijcke et al., 2003a; Lisker et al., 2006b; Ferrarese et al., 2006b), as well as counter rotating and kinematically decoupled cores (De Rijcke et al., 2004; Thomas et al., 2006; Chilingarian et al., 2008), and ongoing star formation (e.g., De Rijcke et al., 2003b; Lisker et al., 2006a; Côté et al., 2006; Michielsen et al., 2007). These features suggest that a non-negligible fraction of intermediate-mass galaxies classified as “early” types have experienced some level of morphological transformation, likely through mergers, accretions, or interactions with the cluster environment (Moore et al., 1996; Kazantzidis et al., 2011).
It is, in fact, possible that the nuclei in some of our early-type galaxies formed in late-type progenitors. A recent finding by Emsellem & van de Ven (2008) noted that galaxies with Sérsic indices of have compressive tidal forces in their central regions, with the size of the compressive region increasing with decreasing Sérsic index. Assuming a constant Sérsic index of , the amplitude of the tidal forces was found to scale linearly with galaxy mass, and form a central massive object (CMO) with a constant host mass fraction of . A CMO growing through gas accretion in this way would eventually reach a critical density and luminosity, altering the galaxy profile such that it no longer has central compressive forces. Comparison of this theoretical threshold nucleus luminosity with C06 reveals that many observed nuclei are much more luminous than would be predicted by this model, which suggests that the nuclei in early-type galaxies may have formed in some low Sérsic index, gas-rich progenitors that have since evolved morphologically.
High-resolution observations of molecular and neutral hydrogen in these galaxies may be able to constrain the role of gas inflow and enrichment in nucleus formation, since H2 will highlight regions of star formation, while HI is a tracer of processes affected by the ICM and gravitational interactions. Subarcsecond-resolution maps of molecular starburst gas — by using ALMA to observe the CO transitions and EVLA to detect HI through 1.4 GHz emission — would allow the relationship between galaxy nuclei and molecular gas to be examined in much greater detail than is currently possible.
4.3.3 Possible Connections to Black Holes
As discussed in § 1, recent observations have uncovered the coexistence of nuclei and black holes in intermediate-mass galaxies, which may have implications for the evolution of the central regions of galaxies. For instance, Hopkins & Quataert (2010) performed simulations of gas accretion on to a black hole, which they find can form a lopsided, eccentric nuclear disk that exerts a strong torque on and drives in the remainder of the gas, producing a system much like that found in M31.
Another simulation by Bekki & Graham (2010) examined the merging of two nuclei containing black holes, and found the dynamical heating of the cluster from the black hole binary expelled stars from the center, with the final stellar density of the remnant decreased with increasing black hole mass fraction. This type of merger could produce observed “core” galaxies with larger black holes (as originally noted by Ebisuzaki et al. 1991; see also Milosavljević & Merritt 2001), and shape the inner regions of intermediate-luminosity galaxies in which a nucleus is difficult to distinguish observationally (§3.1). Their simulations further showed that if only one nucleus had a black hole, the decrease in stellar density of the nucleus was less pronounced, as most of the heating comes from the black hole binary. In mergers where neither nucleus had a black hole, the stellar density of the nucleus increased.
If black holes do become an increasingly dominant component of the CMO mass budget in high- and intermediate-luminosity galaxies, then they could either hinder nucleus growth, or lower the density of the nucleus through mergers until it is destroyed by black hole binary feedback. These effects could create the trends in intermediate-mass galaxy surface brightness profiles observed in this study, where the galaxies undergo a transition from central light “excesses” to “deficits” as they become more luminous (see also Paper IV).
5. Summary
This HST study examined 43 early-type galaxies in the Fornax cluster, imaged in the ACS F475W and F850LP bands. Our analysis — performed in both one- and two-dimensions — extracted photometric and structural parameters for 31 compact stellar nuclei in these early-type galaxies. The main results are summarized as follows:
-
1.
We have compared our 1D results to those obtained by using 2D image modeling techniques, and found the extracted nucleus structural parameters to be in agreement for both methods. Although 2D fitting potentially allows for full structural decomposition of a galaxy, 1D methods enable characterization the outer regions with a single surface brightness profile. We conclude that 1D fits are more appropriate for our study, since they allow us to easily compare nucleus and galaxy parameters in an objective and homogeneous way.
-
2.
We find that % of the 43 galaxies in our sample are nucleated, which is a significant increase from ground-based studies. The nuclei — defined as a central excess relative to the inward extrapolation of a Sérsic model (C06) — are found exclusively in galaxies with (), and the frequency of nucleation for galaxies fainter than this magnitude is % (31/35). As was found previously in the Virgo cluster, nuclei are exceedingly common in low-mass, early-type galaxies in the Fornax cluster (i.e., ).
-
3.
Most nuclei are not significantly offset from their host photocenter — only three are offset by more than . We do not find any trend between the magnitude of the offset and host galaxy luminosity.
-
4.
We find a nearly constant nucleus-to-galaxy luminosity ratio of 0.4%. The observed nucleus luminosity function can be understood therefore in terms of the galaxy selection function (and the fact that galaxies brighter than do not contain nuclei). If we parameterize the nucleus luminosity function as a normalized Gaussian, we find peaks at and mag, which is times more luminous than the peak of the GC luminosity function. The nuclei are also found to have larger sizes and different effective surface brightness scaling relations than the GCs.
-
5.
The colors of the nuclei in hosts with are found to correlate with galaxy colors, as well as with galaxy and nucleus luminosities. In particular, both the galaxies and the nuclei were observed to become increasingly red with increasing galaxy luminosity, with the trend being steeper for the nuclei. This leads to a relation between nucleus-and-host color difference and host magnitude, where nuclei that are more red than their hosts are found predominantly in brighter galaxies, and vice versa. However, on average most of the nuclei are significantly bluer in color than their hosts by mag.
-
6.
A comparison to C06, which examined the nuclei of early-type galaxies in Virgo, reveals many similarities between the nuclei in the two environments. Both studies find similar frequencies of nucleation (increasing sharply from 0 to % for galaxies with mag), surface brightness selection effects, nucleus-to-galaxy luminosity ratios, nucleus luminosity functions, sizes, and color-magnitude relations. The trend along the luminosity function where the galaxy central surface brightness profiles gradually change from having a luminosity “deficit” to an “excess” is shared by both samples (see also \al@cote07, glass11; \al@cote07, glass11, ), which suggests that generic formation and evolution processes largely independent of the galaxy environment are involved in shaping the central regions of galaxies. Rather, nucleus creation may be more contingent on local factors, especially host galaxy mass.
Our conclusion is that, in low-mass galaxies, the dominant mechanism for nucleus growth is probably infall of star clusters through dynamical friction, while at higher masses, gas accretion resulting from mergers and torques becomes dominant. There is no reason to expect either of these processes to be discontinuous, and we argue that the relative importance of these processes vary smoothly as a function of galaxy mass. We examine the efficiency of dynamical friction in our sample galaxies and confirm the finding of many previous studies that star cluster infall is most effective in low-mass galaxies. Based on simulations carried out by other researchers, we argue that gas infall, followed by central star formation, becomes increasingly important in high-mass galaxies having Sérsic indices that may have been inflated by successive mergers and accretions. There is also some evidence for “hybrid nuclei” in some of the intermediate-mass galaxies in our sample: i.e., nuclear components with complex inner structures. Simulations that take into account multiple formation mechanisms — star cluster infall, gas accretion driven by tidal torques and/or accretions and mergers, the influence of central black holes, etc — are urgently needed to elucidate the processes that drive nucleus formation in different mass regimes.
Both dissipationless cluster infall and gas accretion models make predictions that nucleus formation would depend on local density (Oh & Lin, 2000; Babul & Rees, 1992). Although the fact that we do not find any major differences between the nuclei of Virgo and Fornax suggests that local density may not be a dominant factor in their formation, observations that examine the entire volume of a galaxy cluster (and that have the sensitivity necessary to detect the nuclei) may help determine the role environment plays in shaping the nuclei and their hosts. In this context, the forthcoming Next Generation Virgo Cluster Survey (Ferrarese et al. 2012), which is imaging the entire Virgo cluster to a (10) depth of , should provide important new constraints on formation models.
Appendix A Comparison with 2-Dimensional Surface Brightness Profile Fitting
§2 describes the determination of nuclei parameters through 1D fitting of surface brightness profiles from ellipse. This appendix examines the pros and cons of 1D and 2D methods when measuring parameters for the photometric and structural parameters of nuclei in early-type galaxies.
In general, the decision to use a 1D or 2D approach depends on the specific scientific goals. If a galaxy has multiple components (which even for early-type galaxies can include, e.g., bulges, large-scale disks, embedded disks, outer/inner rings, bars, shells, dust filaments, dusk disks, and even faint spiral arms)101010Although early-type galaxies are often considered structurally simple systems, all of these features are found in the sample of 143 early-type galaxies studied in the ACSVCS (Ferrarese et al. 2006b) and ACSFCS (Paper III)., then, by using 2D decomposition, individual structure can, in principle, be fitted with separate profiles and the galaxy’s composition examined in detail. The 2D fitting program GALFIT (Peng et al., 2002, 2010) allows the implementation of many surface brightness profile modifications, such as variability of their diskiness/boxiness, or the addition of spiral arms and non-axisymmetric bending modes — an attractive feature of the 2D method. However, full galaxy decomposition is, in practice, not always straightforward, particularly for nearby galaxies observed at HST/ACS resolution. In many situations, it is not clear how many components are needed to fully fit a galaxy, and the physical origin of each component may not be obvious. For example, sometimes multiple surface brightness profiles are required to fit what may be the same photometric component (see Peng et al. 2002 for examples) due to the fact that the models used in 2D methods have fixed center, ellipticity, and position angle, and have difficulty characterizing a galaxy profile in which these parameters are not intrinsically constant on all scales.
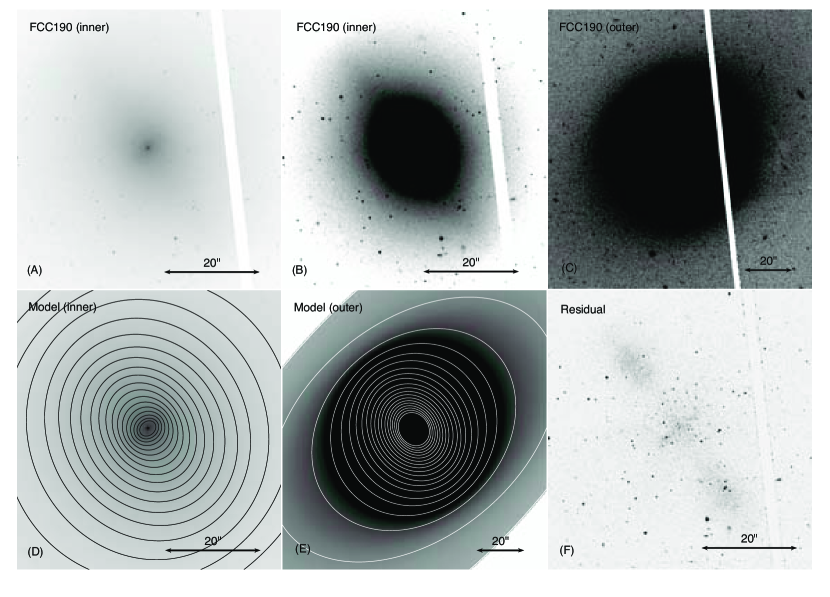
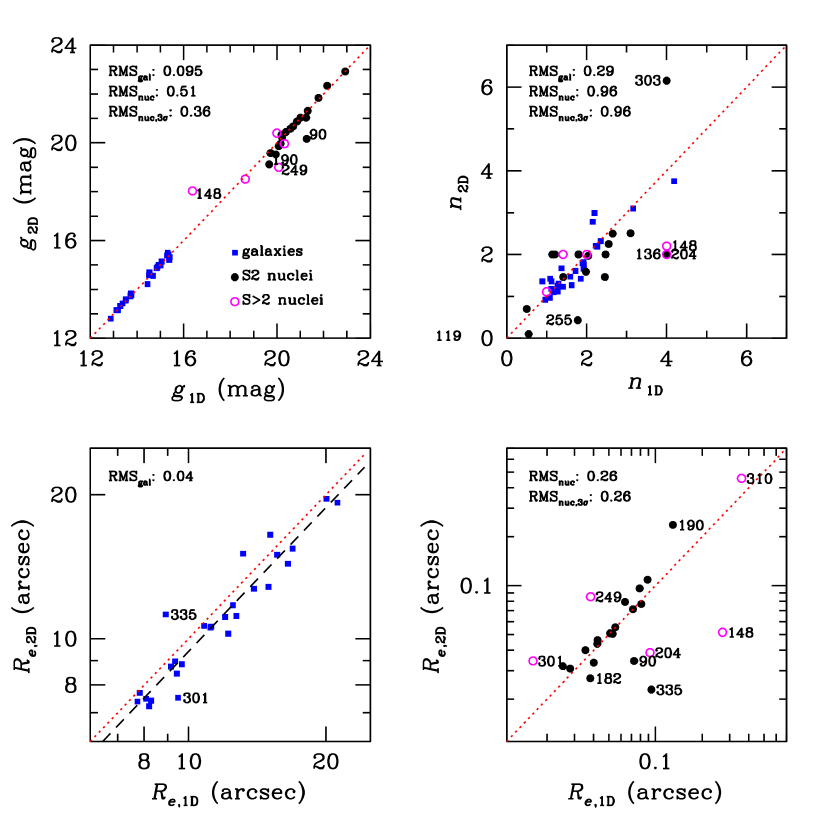
The method of 1D profile fitting used in this work, however, allows the aforementioned parameters to vary, and we are therefore usually able to cleanly fit an entire galaxy with a 1D model. A demonstration of this is shown in Figure 21, where we examine the structure of FCC 190 (panels A–C), and plot the ellipse model derived from our fitted elliptical isophotes (panels D–E). This figure illustrates the striking change in the shape of this galaxy’s isophotes when moving from small to large scales, and how this effect is well-captured by the model. The residuals of the fit (panel F) are relatively clean, and reveal a weak ( mag arcsec-2) central bar. To compare to a 2D fit, the inner residuals from fitting 1S and 2S profiles to FCC 190 using GALFIT are shown in Figure 25a. Clearly, two Sérsic profiles with fixed ellipticity and position angle are unable to fully parameterize this galaxy. However, the penalty in this approach is that the information about the shapes, sizes, and relative position angles of various galaxy components is lost, as their surface brightness profiles blend together into a single component which describes the galaxy on global scales.
Our study is concerned with the properties of the nuclei in comparison to their host galaxies, and with the global trends in these properties as a function of galaxy luminosity or mass. Thus, we are not interested in a full decomposition of any large-scale galaxy structure; rather, we are seeking to characterize the main galactic body component as a whole, so 1D techniques are most appropriate for our study. However, it is important to ensure that the nucleus structural parameters extracted using 1D methods are robust. To test this assertion, we perform surface brightness profile fitting in 2D, and compare the results obtained using the two techniques.
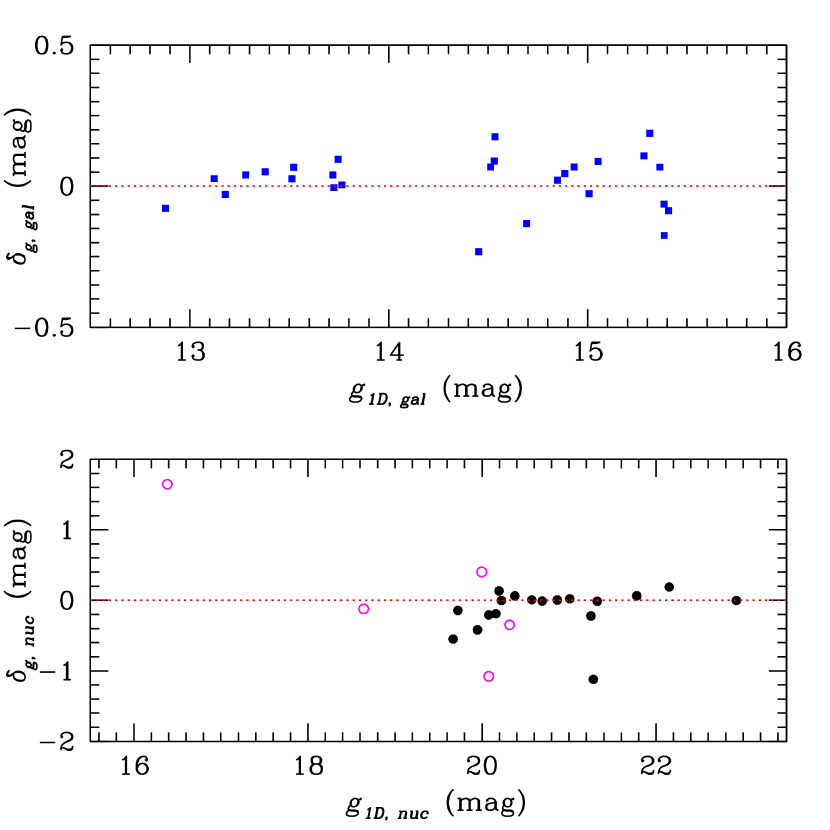
A.1. Procedure
To perform our 2D analysis, we use GALFIT (Peng et al., 2002, 2010), a program that fits galaxy images using multi-component 2D intensity profiles, using an iterative downhill gradient Levenberg-Marquardt algorithm. This 2D analysis is performed on all galaxies in our sample with , a cutoff which was chosen to include most of the nucleated galaxies, while avoiding those that are much more challenging to fit in either 1D or 2D. Galaxies brighter than this are known to often show a complex structure, regardless of their classification as Es, S0s, dEs or dS0s. For instance, some of the brighter dEs are known to show substructures including disks, spiral arms, and bars (e.g., Lisker et al., 2006b, 2007). Likewise, more massive galaxies — often classified as Es and S0s — frequently show similar morphological complexities (see, e.g., Bender & Moellenhoff, 1987; Combes et al., 1990; Nieto et al., 1992; Scorza et al., 1998; Ferrarese et al., 2006b; Krajnovic et al., 2011). The substructures identified in these early-type galaxies could either be a sign that they are intrinsically more complex objects, or a selection effect arising from their higher luminosities and surface brightnesses, which aid in the detection of these distinct components. In any case, the sample of galaxies used in our 2D analysis consists of 27 galaxies, 24 of which are found to be nucleated in our 1D analysis. This sample includes roughly equal numbers of galaxies listed in Table 2 of Paper I as “giants” (E/S0) or “dwarfs” (dS0, dE, etc), although such classifications such be viewed with caution since there can be significant discrepancies among classifiers: see, e.g., Chen et al. (2010) and Paper III where issues relating to the morphology of ACSVCS and ACSFCS galaxies are explored in more detail.
Our analysis proceeded by first measuring the background sky value. To do so, we used SExtractor to mask out any background sources, and then convolved this mask with a Gaussian in order to thoroughly cover any diffuse outer edges. The galaxy was then masked with an ellipse of geometric radius length between five and six effective radii (determined from the 1D analysis). We then used the biweight value of the remaining pixels as the sky value for each of the four ACS chips. Although the sky value between different chips was found to vary up to count, we found that such a count difference resulted in no more than difference in any of the fitted parameters; we therefore adopted the average of the biweight estimates for each of the four chips as the sky value.
We began by fitting each galaxy with a single Sérsic (S1) profile. We then attempted to fit each of the 24 galaxies classified as nucleated in 1D by adding a second Sérsic component (for the central nucleus). In 13 cases, it was possible to fit the nucleus with a Sérsic model with all fit parameters varying freely. Five more galaxies required a prior on the nucleus Sérsic index which was fixed at in analogy with Galactic GCs. For the six remaining galaxies, GALFIT was not able to converge on a nucleus with only one Sérsic component fitted to the main body of the galaxy; at least one other large-scale component needed to be added for before a fit to the nucleus could be achieved. However, in one case (FCC 43) the nucleus parameters were flagged as having caused numerical convergence issues, and thus we do not include the S2 fit in our results. In all cases, we did not impose any constraints on the relative position angles of of the fitted components.
The above procedures are summarized in Fig 22, where we have plotted the 1D versus 2D magnitudes, Sérsic indices, and effective radii for the galaxies and nuclei from our sample. For the galaxies that require more than two Sérsic components to fit the nucleus, we use the parameters from our 2D S1 fit to plot the galaxy portion. Although the galaxy main body (filled black circles) parameters are generally in good agreement from both techniques, we note a slight offset in effective radius, where those obtained from the 2D fits are usually somewhat smaller than in 1D (by a factor of , derived from least-squares fit, with a fixed line slope of 1, to the galaxy main body effective radii in the log). The S2 nuclei (filled blue squares) are also relatively consistent between techniques, although with some notable outliers that will be discussed below. Finally, the non-S2 nuclei (magenta open squares) appear to show the most scatter. We note that the scatter in nucleus magnitudes appears to be the most significant for the brightest nuclei, probably due to the increased difficulty of extracting nucleus parameters from structurally complex galaxies that often have high central surface brightness. This can be seen clearly in in Figure 23, where we have plotted the magnitude differences as a function of 1D magnitudes. We now discuss findings for galaxies in these different categories.
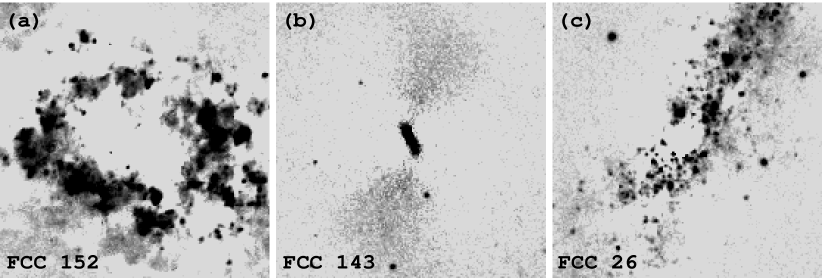
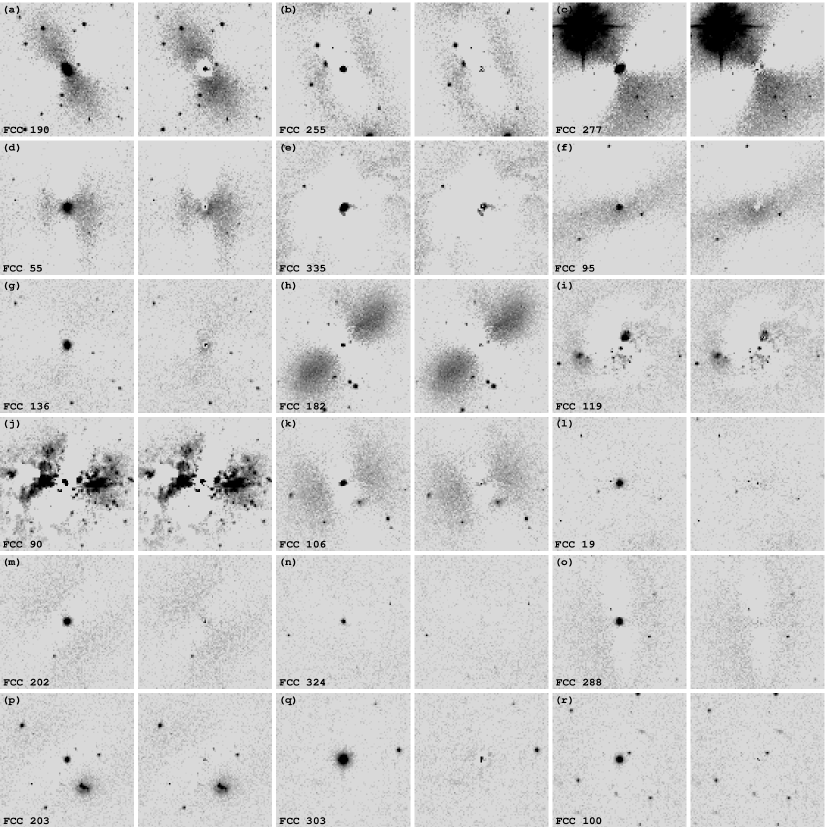
A.2. Non-Nucleated Galaxies (S1)
There are three galaxies in our 2D sample where we do not find a nucleus in our 1D analysis, a result with which we find full agreement in 2D. It is interesting to examine the residuals of a single-Sérsic fit to these objects individually to determine why they are not found to be nucleated, since it is the lack of a nucleus that is unusual for galaxies in our sample.
The residuals of FCC 152 (Figure 24a) reveal large amounts of dust, but with no nucleus-like object present in the central regions. FCC 143 (Figure 24b) shows a small bar in the residuals, which appears to have a bright excess in the center.111111 Performing a 1D fit to the residuals, we find and mag for the inner and and mag for the outer component. However, due to the complexity of the inner structure, we consider these results to be uncertain, and retain the non-nucleated classification. Nevertheless, even with the addition of one or two more large-scale Sérsic profile components, GALFIT is unable to fit a central nucleus. Finally, the low-mass galaxy FCC 26 (Figure 24c) has two bright compact objects located and away from the galaxy photocenter. However, it is unclear if either of these objects in this actively star-forming, “dE/dIrr transition” galaxy can unambiguously called a true “nucleus”.
A.3. Nucleated Galaxies Fit With Double-Sérsic Profiles (S2)
Of the 23 nucleated galaxies in our 2D sample, we are able to fit the galaxy and nucleus using an S2 profile for 18 systems. The residuals from the S1 and S2 fits to these galaxies are shown in Figure 25, where the galaxies are displayed in order of increasing blue magnitude from the FCC. This figure illustrates how the structural complexity of the galaxies seems to increase, and then diminish, as their luminosity decreases — reaching an apparent maximum in the range or — with the residuals for the faintest galaxies appearing much cleaner (see Ferrarese et al., 2006b; Lisker et al., 2006b). Of course, part of this apparent simplicity is likely related to the lower S/N of the available imaging for the faintest and lowest surface brightness systems.
For five of the S2 galaxies, the Sérsic index of the nucleus needed to be held fixed during the fit. FCC 190 (Figure 25a), FCC 55 (Figure 25d), FCC 95 (Figure 25e), and FCC 136 (Figure 25g), all have substructure such as bars that overlap with the nuclear region which the second Sérsic component attempts to fit. By fixing the Sérsic index of the nuclei at (appropriate for Galactic GCs), GALFIT is able to fit the nucleus, with the resulting magnitude and effective radius of the nucleus is in agreement with the 1D results in all cases except for FCC 190, which is discussed below. The other galaxy that requires a fixed nucleus Sérsic index, FCC 335, contains a large amount of dust in the central regions, and if the nucleus Sérsic index is allowed to vary, then the nucleus effective radius and Sérsic index converge to very small values that GALFIT warns may cause numerical convergance issues which cause the final solution to be unreliable. The differences between the 1D and 2D results for this galaxy are also discussed below, where we describe nuclei that are notable outliers in Fig 22. Specifically, the nuclei of FCC 190, FCC 335 and FCC 90 have 1D and 2D magnitude differences of mag and fractional differences in their effective radii of .
FCC 190: This nucleus is 0.55 mag brighter and twice as large in effective radius in the 2D fit than in 1D. The galaxy exhibits distinct “peanut-shaped” residuals, as shown in Figure 25a. It should be noted that after fitting a both a bulge and a disk component along with the nucleus, the nucleus magnitude and radius are still notably disparate.
FCC 335: In 2D, the nucleus is 0.42 mag brighter, but four times smaller, than in the 1D fit. The 2D residuals are shown in Figure 25e. This galaxy has a large amount of dust, and the center was held fixed during the ellipse fitting for the 1D analysis. However, the position of the 1D fit ellipse center is actually pixels away from the nucleus (as determined by GALFIT and confirmed by eye). This could cause the 1D analysis to overestimate the nucleus effective radius and underestimate the magnitude, as the light from the nucleus effectively becomes smeared out.
FCC 90: This nucleus is 1.12 mag brighter in 2D than in 1D. The residuals of a single-Sérsic fit (Figure 25j) show a bright central nucleus as well as a secondary fainter object away. This second object is the cause of a small secondary bump in the 1D surface brightness profile (see Figure 3). After simultaneously fitting this secondary object, the nucleus is still found to be 1.08 mag brighter in 2D than in 1D. Like FCC 90, there is large amounts of dust in the center of this galaxy, and the center was held fixed for the 1D ellipse fitting, at a point pixels away from the 2D nucleus center, which may partly account for the smaller and brighter nucleus found in 2D.
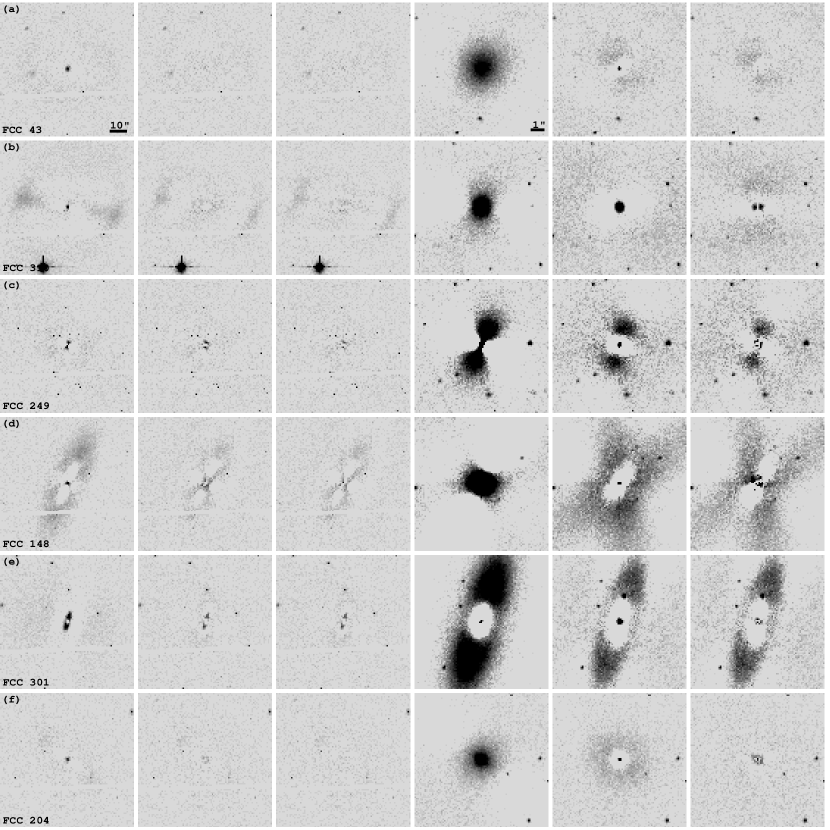
| FCC | ||||||
|---|---|---|---|---|---|---|
| (mag) | (arcsec) | |||||
| 1D | 2D | 1D | 2D | 1D | 2D | |
| 310 | ||||||
| 249 | ||||||
| 148 | ||||||
| 301 | ||||||
| 204 | ||||||
A.4. Nucleated Galaxies with Multiple Large-Scale Components (S2)
There are six nucleated galaxies in our sample which we were unable to model in 2D using an S2 model, as a second Sérsic component in GALFIT will, even with its Sérsic index held fixed, attempt to fit a different component of the underlying galaxy. Thus, we need to add a second, or even third, Sérsic component to the main body of the galaxy in order to fit the nucleus (i.e., three or four components in total). A comparison of the 1D and 2D nucleus parameters for these six galaxies is given in Table 7. Note that the nuclei in several of these galaxies are candidates for “hybrid nuclei” with a complex structure (e.g., a compact, high surface brightness component embedded in an small-scale disk-like feature) that are suggestive of multiple, parallel formation processes (see §4.3.1 and §4.3.2).
FCC 43: A small ( in diameter) round central component, seen in Figure 25a needs to be fitted before it is possible to fit to the nucleus. However, because of the small size of the fitted nucleus (i.e., an effective semi-major axis of 0.39 pixels), the output of GALFIT indicated that this parameter may have caused numerical convergence issues, making all parameters from this solution unreliable. We therefore did not include these results in Fig 22.
FCC 310: After fitting with a single Sérsic profile, the bar and and outer envelope-like structure of this galaxy become apparent from the residuals, seen in Figure 25b. To fit the nucleus, we must first fit an bulge-like component, an bar, and an outer envelope. After these three components are fit, the nucleus appears quite clearly in the residuals, and it can be fitted by adding a fourth Sérsic profile with its Sérsic index held fixed at .
FCC 249: A single-Sérsic fit reveals a peanut-shaped residual in the center (Figure 25c), with a possible nucleus. After a second small component is added, a nucleus becomes apparent in the residuals. The nucleus can then be fitted with its Sérsic index held fixed at .
FCC 148: This galaxy shows a very boxy inner bulge, with X-shaped isophotes in intermediate regions (Figure 25d). Since we are unable to fit the host and nucleus with a double-Sérsic model, a second large-scale component with disk-like properties (, and an axis ratio of 0.36) is added, after which GALFIT will converge on the nucleus. Although a nucleus is not very prominent in the two-component fit residual, the Sérsic index of the bulge-like component grows to if a nucleus is not included in the fit. After a nucleus is included, the fitted bulge Sérsic index is . The disk-like component does not change significantly with the addition of the nucleus.
FCC 301: The complex structure of this galaxy, seen in the single Sérsic component fit residuals in Figure 25e, can be appreciated from the 1D surface brightness profile (Figure 3), where the intensity is slightly over-subtracted at , and then under-subtracted out to . There are also bright outer wings, at scales. After a single-Sérsic component is fitted, a second component will converge on the larger bright central excess, and a third Sérsic profile will then fit the nucleus. However, the bright residuals show that the the main body of this galaxy is not well described in 2D, even by two Sérsic profiles.
FCC 204: As is the case for FCC 43, there appears to be an embedded disk in this galaxy, which can be seen in the residuals of a single Sérsic fit, Figure 25f. The nucleus is found to be slightly fainter in the 2D fit than in 1D. It is possible that in 1D, the central disk might be contributing to nucleus component and causing the nucleus luminosity to be over-estimated.
Overall, the 2D nuclei parameters from these complex galaxies are in reasonable agreement with those found in the 1D analysis. In terms of magnitude, only FCC 148 and FCC 249 show differences of mag, although all except for FCC 310 show discrepancies of in effective radius and Sérsic index. However, the differences do not appear to be systematic, in the sense that there does not seem to be consistent under- or over-estimation of a specific parameter in 1D or 2D. The nuclei parameters for these cases are likely to be more uncertain overall, and thus larger differences between the extracted parameters in these structurally complex galaxies is to be expected.
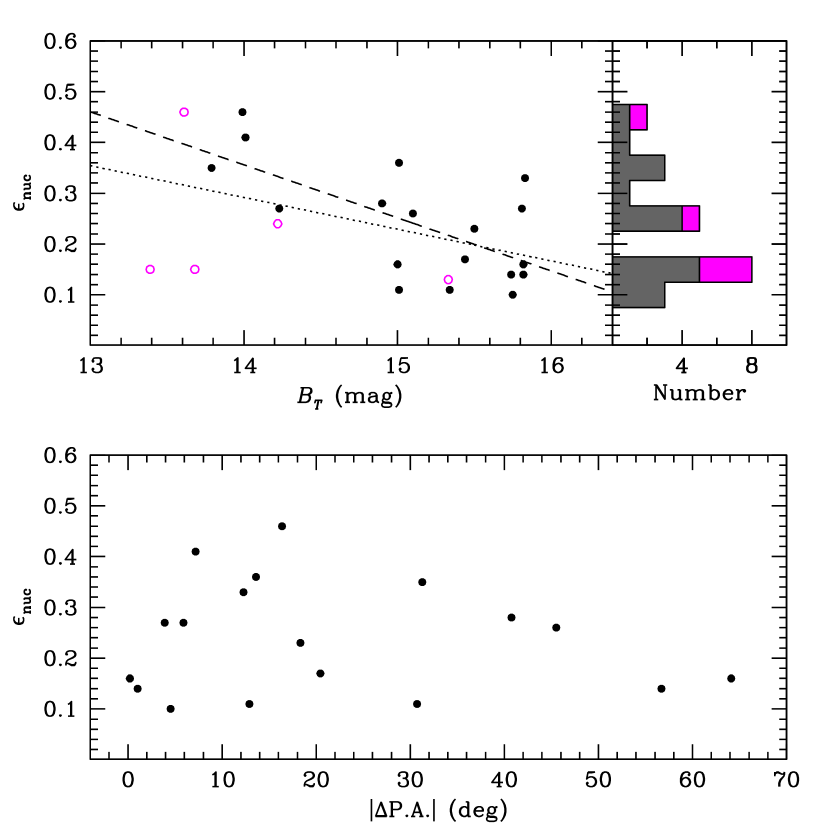
A.5. Nuclei Ellipticities
One advantage of performing the 2D analysis is that we are able to measure the nuclei ellipticities. In general, we find the nuclei to be flattened, with median ellipticities of 0.20 and 0.25 for the full and only S2 samples, respectively. The top right panel of Figure 27 shows a histogram of the ellipticity distribution, while in the top left panel, we plot ellipticity against host galaxy magnitude. A least-squares fit to all of the nuclei hints at a trend of increasing nuclei ellipticities with galaxy luminosity,
| (A1) |
and after removing the more uncertain S2 nuclei, we obtain a significant relation:
| (A2) |
This result suggests that nuclei in brighter (and higher mass) galaxies are more flattened, and may be more likely to contain edge-on disk-like components.
In the bottom panel of Figure 27, we show nuclei ellipticities versus the difference in position angle between the nuclei and their host galaxies. We find that the most highly flattened nuclei are aligned with their hosts, although over one third (7/18) of our sample are significantly ( deg) misaligned.
A.6. 2D Analysis Conclusion
Figure 22 shows that there is reasonable agreement between the nuclei parameters measured in 1D and 2D. We conclude that the 1D nucleus parameters are for the most part robust, and note that the brightest and most structurally complex galaxies — which typically have mag arcsec-2 — present a challenge for measuring nuclei parameters using either approach.
Indeed, even in cases where adding a second or third profile to the main body is required to fit the nucleus in 2D, it is unclear how many components must be added until a “best” fit is actually achieved, and it is usually difficult to say whether one method yields parameters closer to those of the true nucleus. In our study of Fornax nuclei, we are primarily interested in extracting the nuclei parameters relative to the average outer profile. Although much of the power of 2D techniques lies in their ability to fit multiple large-scale components, in galaxies that require more than one outer Sérsic profile, it becomes more difficult to perform a fully objective and homogeneous comparison between the nuclei and galaxy parameters. Our analysis therefore uses the results from our 1D fits, which meets the dual criteria of objectivity and homogeneity. The general consensus between methods indicates that the main conclusions in this work are independent of the specific approach used to model the galaxies and their nuclei.
References
- Abell et al. (1989) Abell, G. O., Corwin, Jr., H. G., & Olowin, R. P. 1989, ApJS, 70, 1
- Anders et al. (2004) Anders, P., de Grijs, R., Fritze-v. Alvensleben, U., & Bissantz, N. 2004, MNRAS, 347, 17
- Anderson & King (2006) Anderson, J. & King, I. R. 2006, PSFs, Photometry, and Astronomy for the ACS/WFC, Tech. rep.
- Babul & Rees (1992) Babul, A. & Rees, M. J. 1992, MNRAS, 255, 346
- Bailey (1980) Bailey, M. E. 1980, MNRAS, 191, 195
- Bailin & Harris (2009) Bailin, J. & Harris, W. E. 2009, ApJ, 695, 1082
- Balcells et al. (2007) Balcells, M., Graham, A. W., & Peletier, R. F. 2007, ApJ, 665, 1084
- Bandara et al. (2009) Bandara, K., Crampton, D., & Simard, L. 2009, ApJ, 704, 1135
- Barazza et al. (2002) Barazza, F. D., Binggeli, B., & Jerjen, H. 2002, A&A, 391, 823
- Barnes (1988) Barnes, J. E. 1988, ApJ, 331, 699
- Barnes (1992) — 1992, ApJ, 393, 484
- Barth et al. (2004) Barth, A. J., Ho, L. C., Rutledge, R. E., & Sargent, W. L. W. 2004, ApJ, 607, 90
- Bekki (2007) Bekki, K. 2007, PASA, 24, 77
- Bekki (2010) — 2010, MNRAS, 401, 2753
- Bekki et al. (2004) Bekki, K., Couch, W. J., Drinkwater, M. J., & Shioya, Y. 2004, ApJ, 610, L13
- Bekki et al. (2006) Bekki, K., Couch, W. J., & Shioya, Y. 2006, ApJ, 642, L133
- Bekki & Graham (2010) Bekki, K. & Graham, A. W. 2010, ApJ, 714, L313
- Bell et al. (2003) Bell, E. F., McIntosh, D. H., Katz, N., & Weinberg, M. D. 2003, ApJS, 149, 289
- Bellazzini et al. (2008) Bellazzini, M. et al. 2008, AJ, 136, 1147
- Bender & Moellenhoff (1987) Bender, R. & Moellenhoff, C. 1987, A&A, 177, 71
- Binggeli et al. (1987) Binggeli, B., Tammann, G. A., & Sandage, A. 1987, AJ, 94, 251
- Binney & Tremaine (2008) Binney, J. & Tremaine, S. 2008, Galactic Dynamics: Second Edition, ed. Binney, J. & Tremaine, S. (Princeton University Press)
- Blakeslee et al. (2009) Blakeslee, J. P. et al. 2009, ApJ, 694, 556
- Böker et al. (2004) Böker, T., Sarzi, M., McLaughlin, D. E., van der Marel, R. P., Rix, H., Ho, L. C., & Shields, J. C. 2004, AJ, 127, 105
- Bower et al. (2006) Bower, R. G., Benson, A. J., Malbon, R., Helly, J. C., Frenk, C. S., Baugh, C. M., Cole, S., & Lacey, C. G. 2006, MNRAS, 370, 645
- Bower et al. (1992) Bower, R. G., Lucey, J. R., & Ellis, R. S. 1992, MNRAS, 254, 601
- Brasseur et al. (2011) Brasseur, C. M., Martin, N. F., Macciò, A. V., Rix, H.-W., & Kang, X. 2011, ArXiv e-prints
- Brodie & Strader (2006) Brodie, J. P. & Strader, J. 2006, ARA&A, 44, 193
- Brown et al. (1991) Brown, J. H., Burkert, A., & Truran, J. W. 1991, ApJ, 376, 115
- Butler & Martínez-Delgado (2005) Butler, D. J. & Martínez-Delgado, D. 2005, AJ, 129, 2217
- Capuzzo-Dolcetta (1993) Capuzzo-Dolcetta, R. 1993, ApJ, 415, 616
- Capuzzo-Dolcetta & Miocchi (2008a) Capuzzo-Dolcetta, R. & Miocchi, P. 2008a, ApJ, 681, 1136
- Capuzzo-Dolcetta & Miocchi (2008b) — 2008b, MNRAS, 388, L69
- Capuzzo-Dolcetta & Tesseri (1999) Capuzzo-Dolcetta, R. & Tesseri, A. 1999, MNRAS, 308, 961
- Carlson & Holtzman (2001) Carlson, M. N. & Holtzman, J. A. 2001, PASP, 113, 1522
- Carollo et al. (1998) Carollo, C. M., Stiavelli, M., & Mack, J. 1998, AJ, 116, 68
- Chen et al. (2010) Chen, C.-W., Côté, P., West, A. A., Peng, E. W., & Ferrarese, L. 2010, ApJS, 191, 1
- Chilingarian et al. (2009) Chilingarian, I., Cayatte, V., Revaz, Y., Dodonov, S., Durand, D., Durret, F., Micol, A., & Slezak, E. 2009, Science, 326, 1379
- Chilingarian et al. (2008) Chilingarian, I. V., Cayatte, V., Durret, F., Adami, C., Balkowski, C., Chemin, L., Laganá, T. F., & Prugniel, P. 2008, A&A, 486, 85
- Ciotti (1991) Ciotti, L. 1991, A&A, 249, 99
- Cole et al. (2000) Cole, S., Lacey, C. G., Baugh, C. M., & Frenk, C. S. 2000, MNRAS, 319, 168
- Coleman et al. (2004) Coleman, M., Da Costa, G. S., Bland-Hawthorn, J., Martínez-Delgado, D., Freeman, K. C., & Malin, D. 2004, AJ, 127, 832
- Coleman et al. (2005) Coleman, M. G., Da Costa, G. S., Bland-Hawthorn, J., & Freeman, K. C. 2005, AJ, 129, 1443
- Coleman & de Jong (2008) Coleman, M. G. & de Jong, J. T. A. 2008, ApJ, 685, 933
- Combes et al. (1990) Combes, F., Debbasch, F., Friedli, D., & Pfenniger, D. 1990, A&A, 233, 82
- Côté et al. (2004) Côté, P. et al. 2004, ApJS, 153, 223
- Côté et al. (2007) — 2007, ApJ, 671, 1456
- Côté et al. (2008) Côté, P. et al. 2008, in IAU Symposium, Vol. 245, IAU Symposium, ed. M. Bureau, E. Athanassoula, & B. Barbuy, 395–398
- Côté et al. (2003) Côté, P., McLaughlin, D. E., Cohen, J. G., & Blakeslee, J. P. 2003, ApJ, 591, 850
- Côté et al. (2001) Côté, P. et al. 2001, ApJ, 559, 828
- Côté et al. (2006) — 2006, ApJS, 165, 57
- Davies & Phillipps (1988) Davies, J. I. & Phillipps, S. 1988, MNRAS, 233, 553
- De Rijcke et al. (2003a) De Rijcke, S., Dejonghe, H., Zeilinger, W. W., & Hau, G. K. T. 2003a, A&A, 400, 119
- De Rijcke et al. (2004) — 2004, A&A, 426, 53
- De Rijcke et al. (2006) De Rijcke, S., Prugniel, P., Simien, F., & Dejonghe, H. 2006, MNRAS, 369, 1321
- De Rijcke et al. (2003b) De Rijcke, S., Zeilinger, W. W., Dejonghe, H., & Hau, G. K. T. 2003b, MNRAS, 339, 225
- Devecchi & Volonteri (2009) Devecchi, B. & Volonteri, M. 2009, ApJ, 694, 302
- Devecchi et al. (2010) Devecchi, B., Volonteri, M., Colpi, M., & Haardt, F. 2010, MNRAS, 1399
- Dopita & Smith (1986) Dopita, M. A. & Smith, G. H. 1986, ApJ, 304, 283
- Drinkwater et al. (2001) Drinkwater, M. J., Gregg, M. D., Holman, B. A., & Brown, M. J. I. 2001, MNRAS, 326, 1076
- Ebisuzaki et al. (1991) Ebisuzaki, T., Makino, J., & Okumura, S. K. 1991, Nature, 354, 212
- Eliche-Moral et al. (2005) Eliche-Moral, M. C., Balcells, M., Aguerri, J. A. L., & Gonzalez-Garcia, A. C. 2005, ArXiv Astrophysics e-prints
- Emsellem & van de Ven (2008) Emsellem, E. & van de Ven, G. 2008, ApJ, 674, 653
- Faber (1973) Faber, S. M. 1973, ApJ, 179, 423
- Faber et al. (1997) Faber, S. M. et al. 1997, AJ, 114, 1771
- Fabian et al. (2006) Fabian, A. C., Celotti, A., & Erlund, M. C. 2006, MNRAS, 373, L16
- Ferguson (1989) Ferguson, H. C. 1989, AJ, 98, 367
- Ferrarese et al. (2006a) Ferrarese, L. et al. 2006a, ApJ, 644, L21
- Ferrarese et al. (2006b) — 2006b, ApJS, 164, 334
- Ferrarese & Ford (2005) Ferrarese, L. & Ford, H. 2005, Space Sci. Rev., 116, 523
- Ferrarese & Merritt (2000) Ferrarese, L. & Merritt, D. 2000, ApJ, 539, L9
- Ferrarese et al. (1994) Ferrarese, L., van den Bosch, F. C., Ford, H. C., Jaffe, W., & O’Connell, R. W. 1994, AJ, 108, 1598
- Filippenko & Ho (2003) Filippenko, A. V. & Ho, L. C. 2003, ApJ, 588, L13
- Franx (1993) Franx, M. 1993, PASP, 105, 1058
- Fukazawa et al. (1998) Fukazawa, Y., Makishima, K., Tamura, T., Ezawa, H., Xu, H., Ikebe, Y., Kikuchi, K., & Ohashi, T. 1998, PASJ, 50, 187
- Fukugita et al. (1996) Fukugita, M., Ichikawa, T., Gunn, J. E., Doi, M., Shimasaku, K., & Schneider, D. P. 1996, AJ, 111, 1748
- Gallo et al. (2010) Gallo, E., Treu, T., Marshall, P. J., Woo, J.-H., Leipski, C., & Antonucci, R. 2010, ApJ, 714, 25
- Gavazzi et al. (2005) Gavazzi, G., Donati, A., Cucciati, O., Sabatini, S., Boselli, A., Davies, J., & Zibetti, S. 2005, A&A, 430, 411
- Gebhardt et al. (2000) Gebhardt, K. et al. 2000, ApJ, 539, L13
- Gebhardt et al. (2007) — 2007, ApJ, 671, 1321
- Georgiev et al. (2010) Georgiev, I. Y., Puzia, T. H., Goudfrooij, P., & Hilker, M. 2010, MNRAS, 406, 1967
- Girardi et al. (1995) Girardi, M., Biviano, A., Giuricin, G., Mardirossian, F., & Mezzetti, M. 1995, ApJ, 438, 527
- Glass et al. (2011) Glass, L. et al. 2011, ApJ, 726, 31
- González Delgado et al. (2008) González Delgado, R. M., Pérez, E., Cid Fernandes, R., & Schmitt, H. 2008, AJ, 135, 747
- Graham & Driver (2007) Graham, A. W. & Driver, S. P. 2007, ApJ, 655, 77
- Graham et al. (2001) Graham, A. W., Erwin, P., Caon, N., & Trujillo, I. 2001, ApJ, 563, L11
- Graham et al. (2003) Graham, A. W., Erwin, P., Trujillo, I., & Asensio Ramos, A. 2003, AJ, 125, 2951
- Graham & Guzmán (2003) Graham, A. W. & Guzmán, R. 2003, AJ, 125, 2936
- Graham & Spitler (2009) Graham, A. W. & Spitler, L. R. 2009, MNRAS, 397, 2148
- Grant et al. (2005) Grant, N. I., Kuipers, J. A., & Phillipps, S. 2005, MNRAS, 363, 1019
- Gültekin et al. (2009) Gültekin, K. et al. 2009, ApJ, 698, 198
- Häring & Rix (2004) Häring, N. & Rix, H. 2004, ApJ, 604, L89
- Harris (2001) Harris, W. E. 2001, in Saas-Fee Advanced Course 28: Star Clusters, ed. L. Labhardt & B. Binggeli, 223–+
- Hartmann et al. (2011) Hartmann, M., Debattista, V. P., Seth, A., Cappellari, M., & Quinn, T. R. 2011, MNRAS, 418, 2697
- Hopkins et al. (2009) Hopkins, P. F., Cox, T. J., Dutta, S. N., Hernquist, L., Kormendy, J., & Lauer, T. R. 2009, ApJS, 181, 135
- Hopkins et al. (2008) Hopkins, P. F., Hernquist, L., Cox, T. J., Dutta, S. N., & Rothberg, B. 2008, ApJ, 679, 156
- Hopkins & Quataert (2010) Hopkins, P. F. & Quataert, E. 2010, MNRAS, 405, L41
- Houghton et al. (2006) Houghton, R. C. W., Magorrian, J., Sarzi, M., Thatte, N., Davies, R. L., & Krajnović, D. 2006, MNRAS, 367, 2
- Huxor et al. (2011) Huxor, A. P., Phillipps, S., Price, J., & Harniman, R. 2011, MNRAS, 414, 3557
- Jacoby et al. (1992) Jacoby, G. H. et al. 1992, PASP, 104, 599
- Jedrzejewski (1987) Jedrzejewski, R. I. 1987, MNRAS, 226, 747
- Jerjen & Binggeli (1997) Jerjen, H. & Binggeli, B. 1997, in Astronomical Society of the Pacific Conference Series, Vol. 116, The Nature of Elliptical Galaxies; 2nd Stromlo Symposium, ed. M. Arnaboldi, G. S. Da Costa, & P. Saha, 239–+
- Jerjen et al. (2000) Jerjen, H., Kalnajs, A., & Binggeli, B. 2000, A&A, 358, 845
- Jordán et al. (2007a) Jordán, A. et al. 2007a, ApJS, 169, 213
- Jordán et al. (2005) — 2005, ApJ, 634, 1002
- Jordán et al. (2006) — 2006, ApJ, 651, L25
- Jordán et al. (2007b) — 2007b, ApJS, 171, 101
- Kauffmann & Haehnelt (2000) Kauffmann, G. & Haehnelt, M. 2000, MNRAS, 311, 576
- Kazantzidis et al. (2011) Kazantzidis, S., Łokas, E. L., Callegari, S., Mayer, L., & Moustakas, L. A. 2011, ApJ, 726, 98
- Kent (1987) Kent, S. M. 1987, AJ, 94, 306
- King (2003) King, A. 2003, ApJ, 596, L27
- King (2005) — 2005, ApJ, 635, L121
- King (1966) King, I. R. 1966, AJ, 71, 64
- Kleyna et al. (2004) Kleyna, J. T., Wilkinson, M. I., Evans, N. W., & Gilmore, G. 2004, MNRAS, 354, L66
- Kleyna et al. (2003) Kleyna, J. T., Wilkinson, M. I., Gilmore, G., & Evans, N. W. 2003, ApJ, 588, L21
- Kormendy et al. (2009) Kormendy, J., Fisher, D. B., Cornell, M. E., & Bender, R. 2009, ApJS, 182, 216
- Kormendy & Richstone (1995) Kormendy, J. & Richstone, D. 1995, ARA&A, 33, 581
- Krajnovic et al. (2011) Krajnovic, D. et al. 2011, ArXiv e-prints
- Kundu & Whitmore (1998) Kundu, A. & Whitmore, B. C. 1998, AJ, 116, 2841
- Kyeong et al. (2010) Kyeong, J., Sung, E.-C., Kim, S. C., & Chaboyer, B. 2010, Journal of Korean Astronomical Society, 43, 1
- Larsen (1999) Larsen, S. S. 1999, A&AS, 139, 393
- Larsen et al. (2001) Larsen, S. S., Brodie, J. P., Huchra, J. P., Forbes, D. A., & Grillmair, C. J. 2001, AJ, 121, 2974
- Lauer et al. (1995) Lauer, T. R. et al. 1995, AJ, 110, 2622
- Lauer et al. (1998) Lauer, T. R., Faber, S. M., Ajhar, E. A., Grillmair, C. J., & Scowen, P. A. 1998, AJ, 116, 2263
- Layden & Sarajedini (2000) Layden, A. C. & Sarajedini, A. 2000, AJ, 119, 1760
- Li et al. (2007) Li, Y., Haiman, Z., & Mac Low, M.-M. 2007, ApJ, 663, 61
- Lisker et al. (2006a) Lisker, T., Glatt, K., Westera, P., & Grebel, E. K. 2006a, AJ, 132, 2432
- Lisker et al. (2006b) Lisker, T., Grebel, E. K., & Binggeli, B. 2006b, AJ, 132, 497
- Lisker et al. (2007) Lisker, T., Grebel, E. K., Binggeli, B., & Glatt, K. 2007, ApJ, 660, 1186
- Liu et al. (2011) Liu, C., Peng, E. W., Jordán, A., Ferrarese, L., Blakeslee, J. P., Côté, P., & Mei, S. 2011, ApJ, 728, 116
- Lotz et al. (2004) Lotz, J. M., Miller, B. W., & Ferguson, H. C. 2004, ApJ, 613, 262
- Lotz et al. (2001) Lotz, J. M., Telford, R., Ferguson, H. C., Miller, B. W., Stiavelli, M., & Mack, J. 2001, ApJ, 552, 572
- Magorrian et al. (1998) Magorrian, J. et al. 1998, AJ, 115, 2285
- Marconi & Hunt (2003) Marconi, A. & Hunt, L. K. 2003, ApJ, 589, L21
- Martin et al. (2008) Martin, N. F., de Jong, J. T. A., & Rix, H.-W. 2008, ApJ, 684, 1075
- Masters et al. (2010) Masters, K. L. et al. 2010, ApJ, 715, 1419
- Mateo (1998) Mateo, M. L. 1998, ARA&A, 36, 435
- Matthews et al. (1999) Matthews, L. D. et al. 1999, AJ, 118, 208
- McConnachie & Irwin (2006) McConnachie, A. W. & Irwin, M. J. 2006, MNRAS, 365, 1263
- McConnachie et al. (2005) McConnachie, A. W., Irwin, M. J., Ferguson, A. M. N., Ibata, R. A., Lewis, G. F., & Tanvir, N. 2005, MNRAS, 356, 979
- McLaughlin (1995) McLaughlin, D. E. 1995, AJ, 109, 2034
- McLaughlin (1999) — 1999, AJ, 117, 2398
- McLaughlin et al. (2006) McLaughlin, D. E., King, A. R., & Nayakshin, S. 2006, ApJ, 650, L37
- Mei et al. (2007) Mei, S. et al. 2007, ApJ, 655, 144
- Michie (1963) Michie, R. W. 1963, MNRAS, 125, 127
- Michielsen et al. (2007) Michielsen, D. et al. 2007, ApJ, 670, L101
- Mieske et al. (2010) Mieske, S. et al. 2010, ApJ, 710, 1672
- Mihos & Hernquist (1994) Mihos, J. C. & Hernquist, L. 1994, ApJ, 437, L47
- Milosavljević (2004) Milosavljević, M. 2004, ApJ, 605, L13
- Milosavljević & Merritt (2001) Milosavljević, M. & Merritt, D. 2001, ApJ, 563, 34
- Misgeld & Hilker (2011) Misgeld, I. & Hilker, M. 2011, MNRAS, 694
- Monaco et al. (2005) Monaco, L., Bellazzini, M., Ferraro, F. R., & Pancino, E. 2005, MNRAS, 356, 1396
- Monaco et al. (2009) Monaco, L., Saviane, I., Perina, S., Bellazzini, M., Buzzoni, A., Federici, L., Fusi Pecci, F., & Galleti, S. 2009, A&A, 502, L9
- Moore et al. (1996) Moore, B., Katz, N., Lake, G., Dressler, A., & Oemler, A. 1996, Nature, 379, 613
- Morelli et al. (2010) Morelli, L., Cesetti, M., Corsini, E. M., Pizzella, A., Dalla Bontà, E., Sarzi, M., & Bertola, F. 2010, A&A, 518, A32
- Morgan & Lake (1989) Morgan, S. & Lake, G. 1989, ApJ, 339, 171
- Murray et al. (2005) Murray, N., Quataert, E., & Thompson, T. A. 2005, ApJ, 618, 569
- Nayakshin et al. (2009) Nayakshin, S., Wilkinson, M. I., & King, A. 2009, MNRAS, 398, L54
- Nieto et al. (1992) Nieto, J.-L., Bender, R., Poulain, P., & Surma, P. 1992, A&A, 257, 97
- Nulsen & Bohringer (1995) Nulsen, P. E. J. & Bohringer, H. 1995, MNRAS, 274, 1093
- Oh & Lin (2000) Oh, K. S. & Lin, D. N. C. 2000, ApJ, 543, 620
- Palma et al. (2003) Palma, C., Majewski, S. R., Siegel, M. H., Patterson, R. J., Ostheimer, J. C., & Link, R. 2003, AJ, 125, 1352
- Paolillo et al. (2002) Paolillo, M., Fabbiano, G., Peres, G., & Kim, D.-W. 2002, ApJ, 565, 883
- Paudel et al. (2011) Paudel, S., Lisker, T., & Kuntschner, H. 2011, MNRAS, 413, 1764
- Peng et al. (2002) Peng, C. Y., Ho, L. C., Impey, C. D., & Rix, H. 2002, AJ, 124, 266
- Peng et al. (2010) — 2010, AJ, 139, 2097
- Peng et al. (2006) Peng, E. W. et al. 2006, ApJ, 639, 95
- Peng et al. (2008) — 2008, ApJ, 681, 197
- Ravindranath et al. (2001) Ravindranath, S., Ho, L. C., Peng, C. Y., Filippenko, A. V., & Sargent, W. L. W. 2001, AJ, 122, 653
- Recchi & Danziger (2005) Recchi, S. & Danziger, I. J. 2005, A&A, 436, 145
- Reines et al. (2011) Reines, A. E., Sivakoff, G. R., Johnson, K. E., & Brogan, C. L. 2011, Nature, 470, 66
- Rest et al. (2001) Rest, A., van den Bosch, F. C., Jaffe, W., Tran, H., Tsvetanov, Z., Ford, H. C., Davies, J., & Schafer, J. 2001, AJ, 121, 2431
- Robertson et al. (2006) Robertson, B., Hernquist, L., Cox, T. J., Di Matteo, T., Hopkins, P. F., Martini, P., & Springel, V. 2006, ApJ, 641, 90
- Rossa et al. (2006) Rossa, J., van der Marel, R. P., Böker, T., Gerssen, J., Ho, L. C., Rix, H., Shields, J. C., & Walcher, C. 2006, AJ, 132, 1074
- Sandage & Binggeli (1984) Sandage, A. & Binggeli, B. 1984, AJ, 89, 919
- Schlegel et al. (1998) Schlegel, D. J., Finkbeiner, D. P., & Davis, M. 1998, ApJ, 500, 525
- Scorza et al. (1998) Scorza, C., Bender, R., Winkelmann, C., Capaccioli, M., & Macchetto, D. F. 1998, A&AS, 131, 265
- Searle & Zinn (1978) Searle, L. & Zinn, R. 1978, ApJ, 225, 357
- Sersic (1968) Sersic, J. L. 1968, Atlas de galaxias australes, ed. Sersic, J. L.
- Seth et al. (2008) Seth, A., Agüeros, M., Lee, D., & Basu-Zych, A. 2008, ApJ, 678, 116
- Seth (2010) Seth, A. C. 2010, ApJ, 725, 670
- Seth et al. (2010) Seth, A. C. et al. 2010, ApJ, 714, 713
- Seth et al. (2006) Seth, A. C., Dalcanton, J. J., Hodge, P. W., & Debattista, V. P. 2006, AJ, 132, 2539
- Siegel et al. (2007) Siegel, M. H. et al. 2007, ApJ, 667, L57
- Silk & Rees (1998) Silk, J. & Rees, M. J. 1998, A&A, 331, L1
- Silk et al. (1987) Silk, J., Wyse, R. F. G., & Shields, G. A. 1987, ApJ, 322, L59
- Sirianni et al. (2005) Sirianni, M. et al. 2005, PASP, 117, 1049
- Springel et al. (2005) Springel, V. et al. 2005, Nature, 435, 629
- Strader & Smith (2008) Strader, J. & Smith, G. H. 2008, AJ, 136, 1828
- Thomas et al. (2006) Thomas, D., Brimioulle, F., Bender, R., Hopp, U., Greggio, L., Maraston, C., & Saglia, R. P. 2006, A&A, 445, L19
- Thomas et al. (1999) Thomas, D., Greggio, L., & Bender, R. 1999, MNRAS, 302, 537
- Tolstoy et al. (2009) Tolstoy, E., Hill, V., & Tosi, M. 2009, ARA&A, 47, 371
- Tonry et al. (2000) Tonry, J. L., Blakeslee, J. P., Ajhar, E. A., & Dressler, A. 2000, ApJ, 530, 625
- Trager et al. (2000) Trager, S. C., Faber, S. M., Worthey, G., & González, J. J. 2000, AJ, 120, 165
- Tremaine (1976) Tremaine, S. D. 1976, ApJ, 203, 345
- Tremaine et al. (1975) Tremaine, S. D., Ostriker, J. P., & Spitzer, Jr., L. 1975, ApJ, 196, 407
- van den Bergh (1986) van den Bergh, S. 1986, AJ, 91, 271
- Villegas et al. (2010) Villegas, D. et al. 2010, ApJ, 717, 603
- Wake et al. (2006) Wake, D. A. et al. 2006, MNRAS, 372, 537
- Walcher et al. (2006) Walcher, C. J., Böker, T., Charlot, S., Ho, L. C., Rix, H.-W., Rossa, J., Shields, J. C., & van der Marel, R. P. 2006, ApJ, 649, 692
- Walcher et al. (2005) Walcher, C. J. et al. 2005, ApJ, 618, 237
- Walker et al. (2006) Walker, M. G., Mateo, M., Olszewski, E. W., Pal, J. K., Sen, B., & Woodroofe, M. 2006, ApJ, 642, L41
- Wehner & Harris (2006) Wehner, E. H. & Harris, W. E. 2006, ApJ, 644, L17
- White & Frenk (1991) White, S. D. M. & Frenk, C. S. 1991, ApJ, 379, 52
- White & Rees (1978) White, S. D. M. & Rees, M. J. 1978, MNRAS, 183, 341
- York et al. (2000) York, D. G. et al. 2000, AJ, 120, 1579