Vol.0 (201x) No.0, 000–000
Star formation associated with the infrared dust bubble N68
Abstract
We investigated the environment of the infrared dust bubble N68 and searched for evidence of triggered star formation in its surroundings. We performed a multiwavelength study of the nebula with data taken from several large-scale surveys: GLIMPSE, MIPSGAL, IRAS, NVSS, GRS, and JCMT. We analyzed the spectral profile and the distribution of the molecular gas (13CO J = 1 - 0 and J = 3 - 2), and the dust in the environment of the N68. The position-velocity diagram clearly shows that the N68 may be expanding outward. We used two three-color images of the mid-infrared emission to explore the physical environment, and one color-color diagram to investigate the distribution of young stellar objects (YSOs). We found that the 24 m emission is surrounded by the 8.0 m emission. Morphologically, the 1.4 GHz continuum correlates strongly with the 24 m emission, and the 13CO J = 1 - 0 and J = 3 - 2 emissions correlate well with the 8.0 m emission. We investigated two compact cores located at the shell of the N68. The spectral intensity ratios of 13CO J = 3 - 2 to J = 1 - 0 range from 5 to 0.3. In addition, young star objects, masers, IRAS, and UC HII regions distribute at the shell of bubble. The active region may be triggered by the expanding of the bubble N68.
keywords:
infrared: stars — stars: formation — ISM: bubbles — HII regions1 Introduction
There are many signatures of star formation, for example, outflow/inflow, dark cloud and HII region, which can be used to investigate the process of star formation. Also there are many different kinds of interactions which can trigger the star formation, such as cloud-cloud collision(Li & Wang, 2012), supernova explosion (Xu et al., 2011a, b), bubble expansion (Zhang & Wang, 2012) and so on. Churchwell et al. (2006, 2007) detected and cataloged about 600 mid-infrared dust (MIR) bubbles between longitudes -60∘ and +60∘. The bubbles have bright 8.0 m shells that enclose bright 24 m interiors. The infrared (IR) dust bubbles may be produced by exciting O- and/or B-type stars, which is located inside bubble. The ultraviolet (UV) radiation from exciting stars may heat dust and ionize the gas to form an expanding bubble shell (Watson et al., 2008), which is known as ”collect-and-collapse” process. This process can trigger a massive star formation near the shell clumps. Therefore, the bubbles present an important opportunity to study the interaction between the HII regions and molecular clouds.
A few individual bubbles have been studied well, such as N49 and S51. There are many models and observations to explain the dusty wind-blown bubbles, such as bubble N49 of Everett & Churchwell (2010). Recently, we reported an expanding bubble S51 shown with a shell and a front side, employing 13CO and C18O J = 1 - 0 emission lines (Zhang & Wang, 2012). Beaumont & Williams (2010) reported CO J = 3 - 2 maps of 43 Spitzer identified bubbles. Watson et al. (2008) present an analysis of wind-blown, parsec-sized, mid-infrared bubbles and associated star formation.
To add the investigated bubble examples, we selected the IR dust bubble [CPA2006] N68 (hereafter N68) from the catalog of Churchwell et al. (2006). N68 is a complete or closed ring and centered on Galactic =35.654, =-0.062 (or R.A.(J2000) = 18h56m25s.70, DEC.(J2000) = 02∘26′01′′.0). It has a distance of 10.6 kpc, which was obtained by Anderson & Bania (2009) based on comparing the velocity of the ionized gas with the maximum velocity of HI absorption, and one looking for HI absorption at the velocity of molecular emission. In addition, its size is 34 pc 17 pc and the eccentricity of the ellipse is 0.72.
In this work, we mainly present a multiwavelength study of the environment surrounding the IR dust bubble N68. We explore its surrounding interstellar medium (ISM) and search for signatures of star formation. The observations and data are described in Sect.2; the results and discussions about the bubble N68 environment are presented in Sect.3; Sect.4 summarizes the results.
2 Data
| Source | Name | R.A.(J2000) | DEC.(J2000) |
|---|---|---|---|
| h m s | ∘ ′ ′′ | ||
| IRAS | IRAS18538+0222 | 18 56 21.30 | +02 26 37.00 |
| IRAS | IRAS18538+0216 | 18 56 23.50 | +02 20 38.00 |
| IRAS | IRAS18540+0220 | 18 56 35.60 | +02 24 54.00 |
| CHII | G35.590-0.025 | 18 56 22.67 | +02 21 14.58 |
| EGO | G35.040-0.470 | 18 57 03.30 | +02 21 50.00 |
| Maser | G35.578-0.031 | 18 56 22.55 | +02 20 28.10 |
| UCHII | G35.578-0.031 | 18 56 22.64 | +02 20 26.30 |
We analyzed IR and millimeter wavelength data extracted from several large-scale surveys including GLIMPSE (Benjamin et al., 2003; Churchwell et al., 2009), MIPSGAL (Carey et al., 2009), IRAS (Neugebauer et al., 1984), NVSS (Condon et al., 1998), GRS111This publication makes use of molecular line data from the Boston University-FCRAO Galactic Ring Survey (GRS). The GRS is a joint project of Boston University and Five College Radio Astronomy Observatory, funded by the National Science Foundation under grants AST-9800334, AST-0098562, AST-0100793, AST-0228993, & AST-0507657., and JCMT222The James Clerk Maxwell Telescope is operated by the Joint Astronomy Centre on behalf of the Science and Technology Facilities Council of the United Kingdom, the Netherlands Organisation for Scientific Research, and the National Research Council of Canada..
GLIMPSE is a MIR survey of the inner Galaxy performed with the Spitzer Space Telescope. We used the mosaicked images from the GLIMPSE and the GLIMPSE Point-Source Catalog (GPSC) in the Spitzer-IRAC (3.6, 4.5, 5.8, and 8.0 m). IRAC has an angular resolution of between and (Fazio et al., 2004; Werner et al., 2004). MIPSGAL is a survey of the same region as the GLIMPSE, using the MIPS instrument on Spitzer. The MIPSGAL resolution is 6′′ at 24 m. The 60 and 100 m fluxes of the IR Astronomical Satellite (IRAS) were employed to estimate the Lyman continuum ionizing flux. The NRAO VLA Sky Survey (NVSS) is a 1.4 GHz continuum survey covering the entire sky north of -40 deg declination (Condon et al., 1998).
The 14-m GRS has a full width at half maximum (FWHM) beam size of at 110 GHz for 13CO J = 1 - 0 transitions. Each field of the GRS in the 13CO J = 1 - 0 line comprises spectra on a fully sampled grid. The intensities are on a antenna temperature scale. To convert this to main beam temperature, is divided by the main beam efficiency of 0.48. The velocity resolution of the data is 0.25 km s-1 (0.22 km s-1 sampling) (Jackson et al., 2006). The 15-m JCMT has a FWHM beam size of at 330 GHz for 13CO J = 3 - 2 transitions. The correlator was configured with 4096 channels over a 250-MHz bandwidth, which provided a velocity resolution of 0.055 km s-1 per channel. The spectra of 13CO J = 1 - 0 and J = 3 - 2 have been smoothed to a velocity resolution of 0.50 and 0.44 km s-1, respectively.
The 13CO J = 1 - 0 and the 13CO J = 3 - 2 data cubes were processed with CLASS and GREG in the GILDAS software package333http://iram.fr/IRAMFR/GILDAS/.
3 Results and Discussions
3.1 The IR dust distribution of the N68
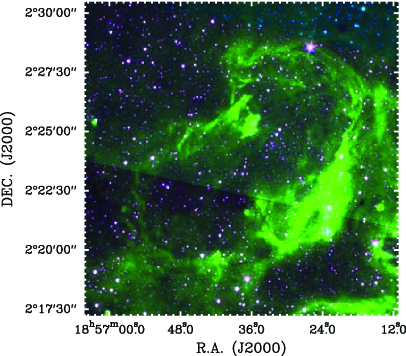
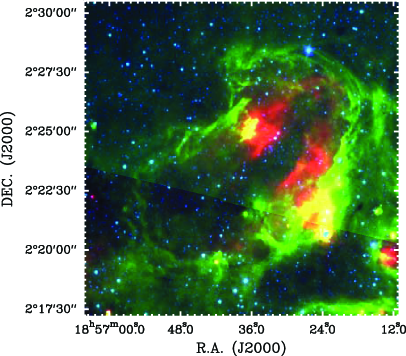
Two Spitzer three-color images of the N68 were shown in Fig.1. Both figures clearly illustrate the photo-dissociation region (PDR) visible in 8.0 m (in green) emission, which originates mainly in the polycyclic aromatic hydrocarbons (PAHs). Due to these large molecules inside the ionized region are destroyed, the PAH emission delineates the HII region boundaries, and molecular clouds inside are excited in the PDR by the radiation leaking from the HII region (Petriella et al., 2010; Pomarès et al., 2009). The 24 m emission (right in Fig.1), appearing just in the northwest part of the bubble N68, corresponds to hot dust. It is likely that O- and/or early B-type stars produced the bubble shell of this HII region, with hot dust located inside the bubble. The 3.6 m emission (in red, left panel in Fig.1) shows the positions of different stars.
In addition, the molecular gas of the bubble shell exhibits several clumps and filaments along the PDR shell seen from Fig.1. The distribution and morphology of this material suggests that a collect-and-collapse process may be occurring.
3.2 The continuum emission and clump structure
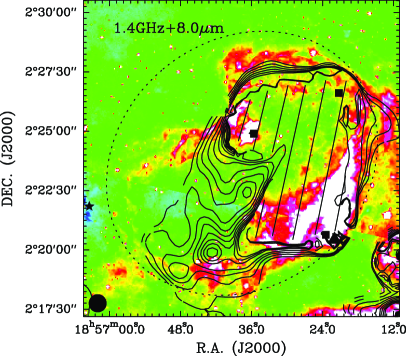
The 1.4 GHz continuum NVSS is full of the entire bubble N68 (left panel in Fig.2), particularly saturated at the northwest part. The area, saturated for the NVSS, morphologically correlates with the 24 m emission in Fig.1. We suggest that exciting stars, which are radiating strong UV radiation, may exist in this region. Possibly because the obstruction from molecular cloud, the hot dust develops and permeates into the southeast part of N68.
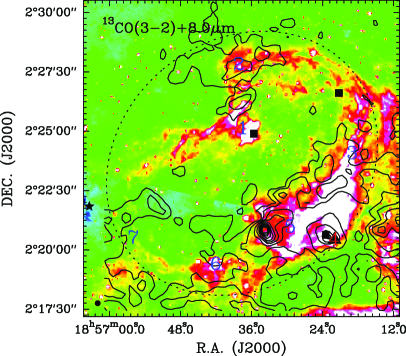
The 13CO J = 3 - 2 contours (Fig.2) from JCMT data show several clumps, which may be the birth place of YSOs. These contours are almost distributed on the 8.0 m shell of the bubble. At the southwest of the N68, there are two strong cores which will be investigated in the followed Sect.3.4.
The 1.4 GHz continuum flux is about 1.27 Jy within this bubble. The number of stellar Lyman photon, absorbed by the gas in the HII region, follows the relation (Mezger et al., 1974)
| (1) |
where is a slowly varying function tabulated by Mezger & Henderson (1967); for effective temperature of exciting star 33000 K and at radio wavelengths, . Finally, we obtain Lyman continuum ionizing photons flux log 48.79 from nebula. Assuming the exciting stars belong to O9.5 star with log = 47.84 (Panagia, 1973), we suggest there should be about 8.89 exciting stars to ionize the bubble. And there are presumably many other non-IR excess sources within the bubble that could also be O- and/or early B-type stars.
3.3 The distributions of the 13CO J = 1 - 0 molecular clouds
3.3.1 Opacity, column density, and mass
We used 13CO J = 1 - 0 to derive the opacity, column density, and mass of nebula within the box shown in Fig.3. The size of the box is 13.3′13.3′. The velocity range is from 38.5 to 68.8 km s-1. The box is centered on R.A.(J2000) = 18h56m25s.70, DEC.(J2000) = 02∘26′01′′.0.
Here we assume that the nebula is in local thermodynamic equilibrium (LTE). We used the theory of the radiation transfer and molecular excitation (Winnewisser et al., 1979; Garden et al., 1991). The 13CO J = 1 - 0 opacity is gained from the equation:
| (2) |
where the is excitation temperature. The 13CO J = 1 - 0 column density is obtained from the equation:
| (3) |
We assume that the 13CO J = 1 - 0 is optically thin, the excitation temperature is = 20 K and the [H2/13CO] abundance ratio is (Frerking et al., 1982). The molecular hydrogen column density was then calculated. The molecular cloud mass is estimated at including the entire bubble N68 shell at a distance of kpc.
3.3.2 Clump structure
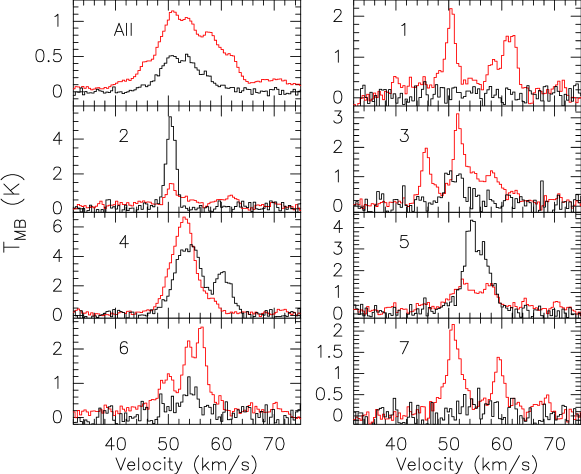
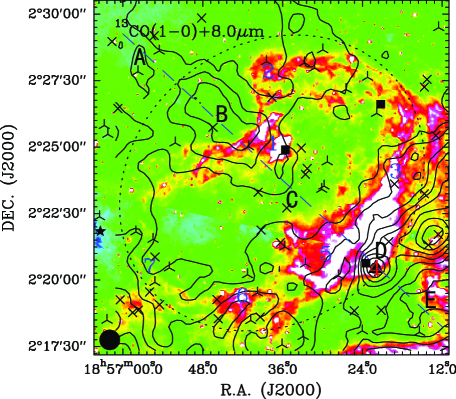
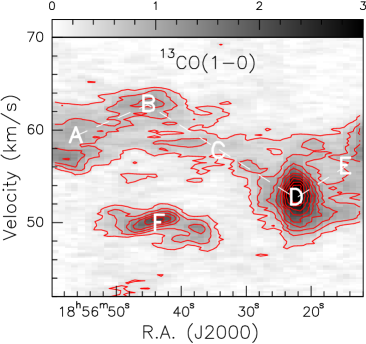
Fig.3 shows integrated velocity contours of the 13CO J = 1 - 0 emission superimposed on the GLIMPSE 8.0 m color image. The integrated velocity range is from 38.5 to 68.8 km s-1. Generally, there should be similar sketch between the distributions of the millimeter emission and Mid-IR emission (Petriella et al., 2010; Zhang et al., 2012). Comparing the morphologic distribution (Fig.3), there are many correlations between the contours and the 8.0 m emission, however, their peak positions deviate slightly from each other. In addition, the nebula is clumped and extended outside the bubble. Therefore we have selected seven sources (1 7; indicated in Fig.3) to investigate their spectral information in followed Sect.3.3.4.
Along the dash-straight line in Fig.3, we show the position-velocity diagram. Fig.3 shows that the components of sources A, B, C, D and E are correlative with the N68, while the component of source F is not. The components of sources A, B, C, D and E are made up of a morphology of letter in the position-velocity diagram (right panel in Fig.3). Source C inside bubble N68 has only one velocity component. And from source B (in the shell of the bubble) to source D (in the shell of the bubble), the position-velocity diagram dose not show the letter shape. This is not followed by the model of an expanding bubble inside a turbulent medium (Arce et al., 2011). However, considering the eccentricity of the bubble and positions of sources A, B, C, D and E, we also suggest that the bubble N68 may be expanding outside. The systematic velocity of the N68 is 58 km s-1 (the source C inside the bubble), and the velocities are 59 and 57 km s-1 for sources A and B outside the bubble, respectively. Also, the velocities are 63 and 53 km s-1 for sources B and D in the shell of the bubble. So the bubble N68 may be expanding with a velocity of 5 km s-1 along the line of sight relative to source C.
3.3.3 The young stars distribution
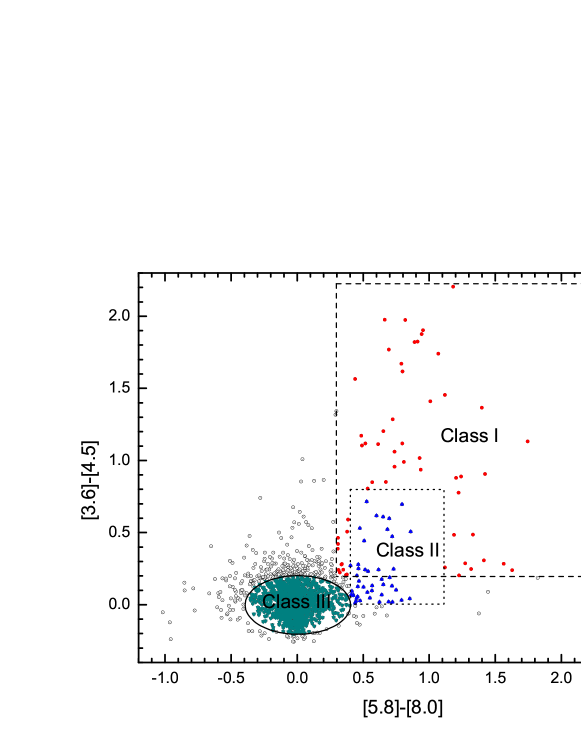
The color-color diagram (Fig.4) shows the distribution of class I, II and III stars. Here we only consider these sources with detection in four Spitzer-IRAC bands (Hora et al., 2008). In addition, to look for a relation between the young stars and the bubble formation, we draw the class I and II stars on the 8.0 m emission image of the N68 (Fig.3). We found that class I and II stars almost are distributed on the shell of the bubble. The distribution of class I and II stars is also correlative with 13CO cloud. We also report the distributions of the IRAS, the extended green object (EGO), the maser and the UC HII region. These star formation tracers are located near and on the shell of nebula. It is possible that the shell of the bubble is the birth place of young stars, which may be the result of interacting effect between the HII region and molecular cloud, and be the production of a collect-and-collapse process.
3.3.4 The spectra of the 13CO J = 1 - 0 and J = 3 - 2
Fig.5 shows the 13CO J = 1 - 0 and J = 3 - 2 spectra of sources 1, 2, 3, 4, 5, 6, and 7 on the shell of the nebula. The average of all spectra of the whole bubble is exhibited (indicated with ) in panel of Fig.5. This shows that the spectra of the 13CO J = 1 - 0 has a wider width and stronger intensity than those of the J = 3 - 2. At the sources 2 and 5, however, the spectra of the 13CO J = 3 - 2 has a stronger intensity than that of the J = 1 - 0. The 13CO J = 1 - 0 spectrum of source 4 does not have the 61 km s-1 component relative to the J = 3 - 2. In addition, from the contours, the 13CO J = 3 - 2 distribution (Fig.3) is clumpier than that of the J = 1 - 0 (Fig.2). Therefore, the difference between the 13CO J = 1 - 0 and J = 3 - 2 is very much, and needs further investigation.
The intensity ratio of the 13CO J = 3 - 2 to J = 1 - 0 is = 0.46, 3.53, 0.38, 0.70, 2.69, and 0.46 for sources , 2, 3, 4, 5, and 6, respectively. Our results are consistent with that of Minamidani et al. (2011), whose ranges from 3.60.9 to 0.240.07. This is suggestive that 13CO J = 1 - 0 and J = 3 - 2 transitions have different critical densities, so the traces the excitation of molecular gas.
3.4 Two compact cores in the shell of the N68
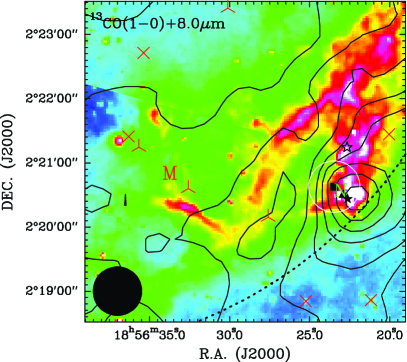
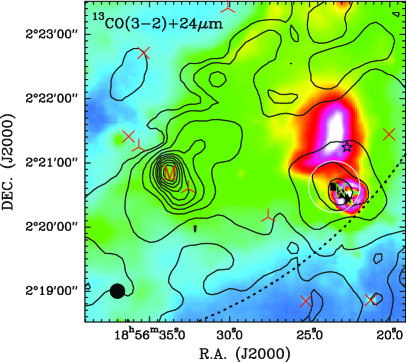
There are two compact cores M (R.A.(J2000) = 18h56m33s.73, DEC.(J2000) = 2∘20′49′′.81) and N (R.A.(J2000) = 18h56m23s.07, DEC.(J2000) = 2∘20′33′′.44), located at the southwest shell of N68. Fig.6 shows the integration contours of the 13CO J = 1 - 0 and J = 3 - 2 emission. The cores M and N are located at the peaks of integration contours of the 13CO J = 3 - 2 emission. The peak of the 13CO J = 1 - 0 contours is located at core N, but it does not appear for core M. In addition, the difference between the 8.0 and 24 m emission is obvious. The present of the 24 m emission is suggestive that the hot dust has plunged into the bubble shell.
On the other hand, there are many star formation tracers located near core N. We marked the positions of a H2O maser, a OH maser, a IRAS point source, a compact HII region and a UC HII region in Fig.6. The H2O maser, the OH maser, the IRAS point source and the UC HII region are located at the core N. There are many velocity components for the H2O maser and the OH maser. We just list three of their strongest components. The fluxes are 20.15 Jy at 48.90 km s-1, 7.25 Jy at 49.45 km s-1 and 2.80 Jy 48.35 km s-1 for H2O maser emission, while 9.90 Jy at 50.00 km s-1, 4.40 Jy 46.05 km s-1 and 3.70 Jy at 47.36 km s-1 for the OH maser emission (Forster & Caswell, 1999). These are suggestive that core N is a strongly active massive star forming region.
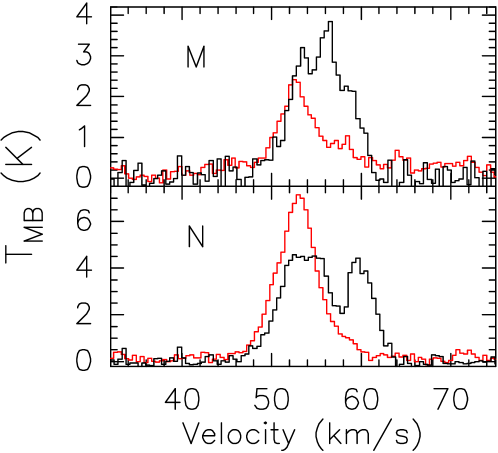
We also exhibit the spectra of cores M and N in Fig.7. The difference of spectral profiles between 13CO J = 1 - 0 and J = 3 - 2 emission is obvious. the 13CO J = 3 - 2 has double profiles for cores M and N, but the 13CO J = 1 - 0 lacks of the blue profile. For core N, the 13CO J = 1 - 0 has a main beam temperature of 7 K at 53 km s-1, yet the 13CO J = 3 - 2 shows a flat spectrum of absorption. This discrepancy is needed to further investigate.
4 Conclusions
We have investigated the environment of the IR dust bubble N68 with the 13CO J = 1 - 0 and J = 3 - 2 emission lines, the 1.4 GHz continuum, and the IR bands emission. The main results can be summarized as follows.
The morphology of the molecular line emission (13CO J = 1 - 0 and J = 3 - 2) and the associated velocity signatures are consistent with the shell structure seen from the 8.0 m images. The expanding shells in N68 are suggestive of triggered massive star formation. There is evidence for dense clumps coincident with the shells. The expanding shells have an expansion speed of 5 km s-1. However, it is not clear whether HII region is the driving mechanism of the shell expansion.
We have presented a study about compact cores M and N located at the shell of nebula. Compact core N is associative with the H2O maser, the OH maser, the IRAS point source, and the UC HII region. The spectral velocity components of the H2O maser and the OH maser indicate that the star formation region is strongly activate. However, the deep-going properties of the compact cores M and N are needed to further investigate.
We also used the GLIMPSE, and the MIPSGAL survey data to analyze the YSOs and the warm dust distribution around the bubble N68. We identified class I and II YSOs using the [5.8]-[8.0] versus [3.6]-[4.5] relation, and correlated their distribution relative to the PDR, which we assume to be associated with and surrounding an HII region. We find that the N68 appears to have a significant number of YSOs associated with their PDRs, implying that triggered star formation mechanisms acting on the boundary of the expanding HII region.
5 Acknowledgements
This work was supported by the Young Researcher Grant of National Astronomical Observatories, Chinese Academy of Sciences No.O835032002.
References
- Anderson & Bania (2009) Anderson, L. D., & Bania, T. M. 2009, ApJ, 690, 706
- Arce et al. (2011) Arce, H. G., Borkin, M. A., Goodman, A. A., Pineda, J. E., & Beaumont, C. N. 2011, ApJ, 742, 105
- Beaumont & Williams (2010) Beaumont, C. N., & Williams, J. P. 2010, ApJ, 709, 791
- Benjamin et al. (2003) Benjamin, R. A., Churchwell, E., Babler, B. L., et al. 2003, PASP, 115, 953
- Carey et al. (2009) Carey, S. J., Noriega-Crespo, A., Mizuno, D. R., et al. 2009, PASP, 121, 76
- Churchwell et al. (2009) Churchwell, E., Babler, B. L., Meade, M. R., et al. 2009, PASP, 121, 213
- Churchwell et al. (2006) Churchwell, E., Povich, M. S., Allen, D., et al. 2006, ApJ, 649, 759
- Churchwell et al. (2007) Churchwell, E., Watson, D. F., Povich, M. S., et al. 2007, ApJ, 670, 428
- Condon et al. (1998) Condon, J. J., Cotton, W. D., Greisen, E. W., et al. 1998, AJ, 115, 1693
- Everett & Churchwell (2010) Everett, J. E., & Churchwell, E. 2010, ApJ, 713, 592
- Fazio et al. (2004) Fazio, G. G., Hora, J. L., Allen, L. E., et al. 2004, ApJS, 154, 10
- Forster & Caswell (1999) Forster, J. R., & Caswell, J. L. 1999, A&AS, 137, 43
- Frerking et al. (1982) Frerking, M. A., Langer, W. D., & Wilson, R. W. 1982, ApJ, 262, 590
- Garden et al. (1991) Garden, R. P., Hayashi, M., Hasegawa, T., Gatley, I., & Kaifu, N. 1991, ApJ, 374, 540
- Hora et al. (2008) Hora, J. L., Carey, S., Surace, J., et al. 2008, PASP, 120, 1233
- Jackson et al. (2006) Jackson, J. M., Rathborne, J. M., Shah, R. Y., et al. 2006, ApJS, 163, 145
- Li & Wang (2012) Li, N., & Wang, J. J. 2012, RAA, accept
- Mezger & Henderson (1967) Mezger, P. G., & Henderson, A. P. 1967, ApJ, 147, 471
- Mezger et al. (1974) Mezger, P. G., Smith, L. F., & Churchwell, E. 1974, A&A, 32, 269
- Minamidani et al. (2011) Minamidani, T., Tanaka, T., Mizuno, Y., et al. 2011, AJ, 141, 73
- Neugebauer et al. (1984) Neugebauer, G., Habing, H. J., van Duinen, R., et al. 1984, ApJ, 278, L1
- Panagia (1973) Panagia, N. 1973, AJ, 78, 929
- Petriella et al. (2010) Petriella, A., Paron, S., & Giacani, E. 2010, A&A, 513, A44
- Pomarès et al. (2009) Pomarès, M., Zavagno, A., Deharveng, L., et al. 2009, A&A, 494, 987
- Watson et al. (2008) Watson, C., Povich, M. S., Churchwell, E. B., et al. 2008, ApJ, 681, 1341
- Werner et al. (2004) Werner, M. W., Roellig, T. L., Low, F. J., et al. 2004, ApJS, 154, 1
- Winnewisser et al. (1979) Winnewisser, G., Churchwell, E., & Walmsley, C. M. 1979, A&A, 72, 215
- Xu et al. (2011a) Xu, J.-L., Wang, J.-J., & Miller, M. 2011a, ApJ, 727, 81
- Xu et al. (2011b) Xu, J.-L., Wang, J.-J., & Miller, M. 2011b, RAA, 11, 537
- Zhang et al. (2012) Zhang, C. P., Esimbek, J., Zhou, J. J., Wu, G., & Du, Z. M. 2012, Ap&SS, 337, 283
- Zhang & Wang (2012) Zhang, C. P., & Wang, J. J. 2012, A&A, 544, A11