Possible existence of – and – correlations for Short Gamma-Ray Bursts with a factor 5 to 100 dimmer than those for Long Gamma-Ray Bursts
Abstract
We analyzed correlations among the rest frame spectral peak energy , the observed frame 64ms peak isotropic luminosity and the isotropic energy for 13 Short Gamma Ray Burst (SGRB) candidates having the measured redshift , sec and well determined spectral parameters. A SGRB candidate is regarded as a misguided SGRB if it is located in the 3- dispersion region from the best-fit function of the – correlation for Long GRBs (LGRBs) while the others are regarded as secure SGRBs possibly from compact star mergers. Using 8 secure SGRBs out of 13 SGRB candidates, we tested whether – and – correlations exist for SGRBs. We found that – correlation for SGRBs() seems to exist with the correlation coefficeint and chance probability . We found also that the – correlation for SGRBs() is tighter than – correlation since and . Both correlations for SGRBs are dimmer than those of LGRBs for the same by factors 100 (–) and 5(–). Applying the tighter – correlation for SGRBs to 71 bright BATSE SGRBs, we found that pseudo redshift ranges from to with the mean of 1.05. The redshifts of SGRBs apparently cluster at lower redshift than those of LGRBs (), which supports the merger scenario of SGRBs.
keywords:
gamma rays: bursts — gamma rays: observations — gamma rays: short.1 Introduction
For Long Gamma Ray Bursts (LGRBs), several observational correlations among the rest frame spectral peak energy , the peak isotropic luminosity and the isotropic energy in the prompt emission phase have been proposed. – correlation was first reported by Amati et al. (2002) and argued by many authors (Sakamoto et al., 2004; Lamb et al., 2004; Amati, 2006; Amati et al., 2009; Yonetoku et al., 2010).
As for , Yonetoku et al. (2004) reported a rather tight correlation between and the observed frame 1-second peak isotropic luminosity . In 2004, the number of LGRBs with well determined redshifts and spectral parameters was only 16. Nevertheless, the correlation was found to be very tight: the linear correlation coefficient () between and is and the chance probability () is . Several authors argued on the property of the – correlation (Ghirlanda et al., 2005b, a; Krimm et al., 2009) and confirmed the existence. Tsutsui et al. (2009) found that adding a new observables , the luminosity time defined by , improves the correlation and gave –– correlation. In –– correlation, the intrinsic dispersion is reduced by 40 % compared with the – and – correlations.
Ghirlanda et al. (2004) applied the – correlation to bright short Gamma Ray Bursts (SGRBs) observed by BATSE without measured redshift. That is, they assumed that SGRBs obey the same – correlation of LGRBs and estimated the pseudo redshifts of SGRBs although no evidence for the existence of the – correlation for SGRBs at that time. They found that the pseudo redshifts are obtained for all selected SGRBs and the distribution is similar to that of LGRBs known at that time. On the other hand, Nakar & Piran (2005); Band & Preece (2005); Butler et al. (2007); Shahmoradi & Nemiroff (2010) argued that – correlation might be due to selection effects, since was determined from the time integrated spectra. However, Ghirlanda et al. (2010) showed that in the individual pulses of several LGRBs, – correlation holds for each pulse even though changes an order of magnitude from pulse to pulse. Similar property was found for GRB061007 by Ohno et al. (2009). These results strongly suggest that – correlation is not a result of selection biases but a real physical one.
As for SGRBs, the number of SGRBs with measured redshifts and was so small that it was difficult to check if – correlation holds or not. However, Ghirlanda et al. (2011) showed that for 14 Fermi/GBM SGRBs without redshifts, the individual pulses follow a relation of with where is the observed energy flux. This reminds us what happened to the individual pulses of LGRBs in Ghirlanda et al. (2010) and suggests that a similar correlation might exist even for SGRBs in the rest frame.
In this study, we select 13 SGRB candidates with well determined redshift, spectral parameters, , and to see if the correlations among , and exist. In section 2, we will show that our criteria on SGRBs yield 8 secure SGRBs out of 13 SGRB candidates. Using these SGRBs, we examine if the – and – correlations exist or not. In section 3, we will apply the – correlation obtained in section 2 to 71 bright BATSE SGRBs without measured redshift to determine the pseudo redshift . Section 4 will be devoted to discussions. Throughout the paper we adopt a cosmological model with , and
2 SGRBs with well determined redshift , , and
In the previous works, it has been checked whether SGRBs are consistent with the – and – correlations for LGRBs. First, Amati (2006) showed that two short GRBs are clear outliers of the – correlation. Then, Ghirlanda et al. (2009) found that their six SGRBs are inconsistent with the – correlation, while they possibly follow the – correlation. Now, by the end of 2011, there are more than 10 SGRBs which have well-determined redshifts and spectral parameters so that we can check more systematically if SGRBs are consistent with LGRB correlations and if they have their own correlations among , and . Recently, Zhang et al. (2012) examined the – correlations for the 7 short and 105 long GRBs separately and confirmed quantitatively that they are significantly different from each other. On the other hand, concerning the – correlation, they derived the correlation from the mixture of LGRBs and SGRBs and insisted, from a visual inspection, that SGRBs are consistent with their LGRB correlation. In fact, to argue the consistency between LGRBs and SGRBs, they should derive the correlations separately and compare them, as we will do below. Comparison of our results and Zhang et al. (2012) will be given in section 4.
Table 1 shows our list of SGRB candidates which are selected as GRBs with following Gruber et al. (2011), rather than . The list contains the redshift , the rest frame duration , the spectral peak energy , the peak luminosity in 64 ms of the observer-frame time bin, the isotropic energy , class of SGRB candidates which will be explained later, and the reference. To make Table 1, we collected all GRBs by the end of 2011 with the value of , the measured redshift , the spectral peak energy , the peak flux and the fluence within the energy range between and of each instrument. In order to obtain tighter correlations, the time bin of , and then , should be defined in the time in GRB rest frame as discussed in Tsutsui et al. (2011, 2012) for LGRBs. However, the number of SGRBs is so small to determine the best time bin of that we simply adopt here 64 msec in the observer frame for all SGRBs candidates.
For GRBs detected by Fermi/GBM (090423, 090510, 100117A, 100206, 100816A), we analyze the spectrum with the software package RMFIT111http://fermi.gsfc.nasa.gov/ssc/data/analysis/ (version 3.3rc8) and the GBM Response Matrices v1.8, following the guidance of the RMFIT tutorial222http://fermi.gsfc.nasa.gov/ssc/data/analysis/user/vc_rmfittutorial.pdf. For the other GRBs, we obtained the data from the reference in 1. From these spectral parameters, peak fluxes and fluences, we can calculate the bolometric isotropic energy and the peak luminosity between the energy range of 1–100,000 keV in GRB rest frame using the Band function (Band et al., 1993). Although in most of previous works, and between 1–10,000 keV were adopted, in this paper we adopt 1–100,000 keV range, because 090510 has keV. between 1–100,000 keV of GRB 090510 is 5 times larger than that of between 1-10,000 keV. For 090424, 050709, 051221, 061006, 070714B, 071020, 080913, 100117A and 101219A, we used fixed high energy photon index as , because we can not obtain high energy photon index due to the lack of number of photons. For short GRBs with extended emission, and were estimated for initial short/hard spikes.
Here we defined SGRB candidates as GRBs with . These are ”candidates” because there might be some contamination from LGRBs with relatively short duration (Zhang et al., 2009; Levesque et al., 2010; Lü et al., 2010). Zhang et al. (2009) proposed multiple observational criteria from their physical motivations, such as supernova (SN) association, specific star formation rate (SFR) of the host galaxy, the location offset from the host galaxy, the duration, the hardness and the spectral lag, etc. However, because most of these observational properties are not available in many cases, these criteria are not so useful in practice. In this study, we adopt much simpler criteria by Lü et al. (2010) which utilize the – correlation for LGRBs as a discriminator against SGRBs. Thus, we define GRBs which have and are consistent with – correlation for LGRBs within 3- dispersion level as ”misguided SGRBs” and the others as ”secure SGRBs”. That is, if a SGRB candidate is not consistent with the – correlation for LGRBs, we regard it as a secure SGRB. In Table 1, we can find that misguided SGRBs tend to have longer and redshift than secure SGRBs. It might be not surprising because, the higher the redshift is, the more difficult it becomes to observe the long tail of the prompt emission. Then it is inevitable to underestimate . We should note that all SGRBs with extended emission in Table 1 (061006, 070714B, 101219A) belong to secure SGRBs, so the extended emission might be a good indicator of secure SGRBs.
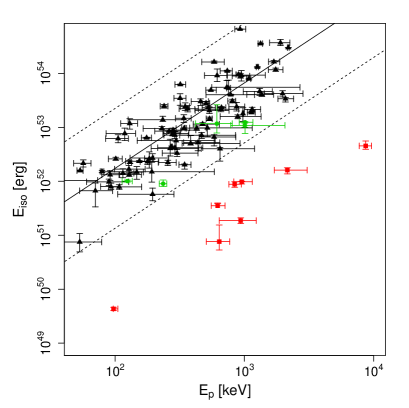
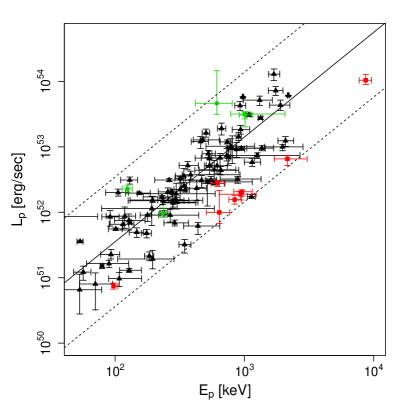
Figure. 1 shows the – (left) and – (right) diagrams for both SGRB candidates in this Letter and LGRBs from Yonetoku et al. (2010). In the left of Fig. 1, the best fit function and 3- dispersion region of – correlation for LGRBs are indicated by the black solid and dotted lines, respectively. A misguided SGRB which is located within 3- dispersion region of the – correlation for LGRBs is marked by a green filled circle, while a secure SGRB by a red filled square. We can see that the secure SGRBs are always under the best fit function of – correlation for LGRBs although it can be above it from our definition of the secure SGRB. This suggests that – correlation might exist even for secure SGRBs. Similar argument was already discussed in previous studies (Amati, 2006; Ghirlanda et al., 2009; Zhang et al., 2012). We estimate the best fit function of – relation for secure SGRBs and quantitatively check these previous arguments.
Let us assume a linear correlation in logarithm as, where angle bracket denotes an average, and a chi square function as
| (1) |
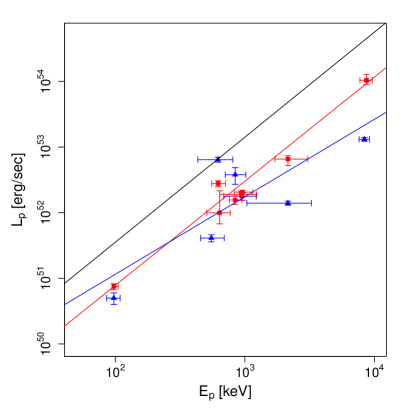
where () is statistical error of () for each burst , and (the same for all bursts) is the intrinsic dispersion of the relation added as extra component of scatter, since statistical errors of and do not account for a large scatter of the relation. In this paper, we assume the intrinsic distribution around a relation is gaussian and we estimate a value of as the value which makes a reduced chi square value unity by trial and error. Then, the best fitted values and 1- errors of and are estimated with the fixed value of . In the left of Fig. 2 we plot only secure (red filled square) and misguided (green filled circle) SGRBs in – diagram. The red solid line is the best fit fuction of – correlation for secure SGRBs given by
| (2) |
The logarithmic correlation coefficient() is 0.91 with the chance probability() of and . The dotted red line shows the 3- dispersion. We can say that – correlation exists for secure SGRBs also. Therefore although it is correct that SGRBs do not obey – correlation for LGRBs, which has been claimed, they do obey the different – correlation with almost the same power law index but a factor smaller amplitude in .
Now let us discuss – correlation. In the right of Figure 1, we plot secure (filled square) and misguided (green filled circle) SGRBs in – diagram. The best-fit function and 3- dispersion region of – correlation for LGRBs from Yonetoku et al. (2010) are indicated by the black solid and dotted lines, respectively. All of secure and misguided SGRB lie inside the 3- dispersion region of – correlation for LGRBs. This might lead us an argument that SGRBs follows the same – correlation for LGRBs as discussed in previous studies (Ghirlanda et al., 2009; Zhang et al., 2012). However if we focus only on secure SGRBs, all of them are located under the black solid line in the right of Fig. 1. This result seems to be unnatural because if they really come from the same – correlation for LGRBs, about half of them must be above the black solid line. This fact implies the existence of – correlation for secure SGRBs although the best fit function of them is within the 3- dispersion of – correlation for LGRBs. In this paper, we obtain a – correlation only from secure SGRBs for the first time and compare it with the relation for LGRBs.
In the right of Figure 2 we plot only secure (filled square) and misguided (green filled circle) SGRBs in – diagram. It is clear that secure SGRBs have their own correlation and the best-fit function is given by,
| (3) |
with , and . The dotted red line shows the 3- dispersion. From the value of amd , we can say that the – correlation for secure SGRBs is tighter than the – correlation for SGRBs. For this reason we use Eq. (3) as a distance indicator in chapter 3 to determine the pseudo redshift of SGRBs without measured redshift.
The best fit function for long GRBs in Yonetoku et al. (2010) is given by,
| (4) |
Comparing equation (3) and (4), we can say that SGRBs obey – correlation with almost the same power law index but a factor 5 smaller amplitude in with 10- statistical significance. Here we compared the – correlation for SGRBs of our sample with the one for LGRBs of Yonetoku et al. (2010), while Zhang et al. (2012) did the one for SGRBs of their sample with the one for LGRBs of Ghirlanda et al. (2010). One may suspect that the difference might come from the difference of the sample both of long and short GRBs, but we will show that we can get the same result with this paper even if we use Ghirlanda et al. (2010) and Zhang et al. (2012) sample in section 4.
| GRB | redshift | [sec] | [keV] | [erg/s] | [erg] | class | ref333References for spectral parameters, peak fluxes and fluences: (1)Golenetskii et al. (2004) ; (2) Villasenor et al. (2005) ; (3) Golenetskii et al. (2005); Norris et al. (2005) ; (4) Golenetskii et al. (2006) ; (5) Ohno et al. (2007); Kodaka et al. (2007) ; (6) Golenetskii et al. (2007) ; (7) Pal’Shin et al. (2008); Stamatikos et al. (2008) ; (8) This work ; (9) Golenetskii et al. (2010). |
|---|---|---|---|---|---|---|---|
| 040924 | 0.86 | 0.81 | misguided | (1) | |||
| 05070944470 msec peak luminosity | 0.16 | 0.60 | secure | (2) | |||
| 051221 | 0.55 | 0.91 | secure | (3) | |||
| 061006 | 0.44 | 0.35 | secure | (4) | |||
| 070714B | 0.92 | 1.04 | secure | (5) | |||
| 071020 | 2.15 | 1.11 | misguided | (6) | |||
| 080913 | 6.70 | 1.04 | misguided | (7) | |||
| 090423 | 8.26 | 1.30 | misguided | (8) | |||
| 090510 | 0.90 | 0.16 | secure | (8) | |||
| 100117A | 0.92 | 0.16 | secure | (8) | |||
| 100206 | 0.41 | 0.09 | secure | (8) | |||
| 100816A | 0.81 | 1.11 | misguided | (8) | |||
| 101219A | 0.72 | 0.35 | secure | (9) |
3 Redshift Estimation
From the analysis in the previous section, the – correlation for SGRBs derived would be a better distance indicator of SGRBs than the – correlation. The best-fit function of Eq. (3) can be rewritten using the observed quantities as
| (5) |
where , and are the luminosity distance, the peak energy at the observer’s rest frame and the peak flux, respectively. The right hand side of this equation consists of only the observable quantities. Therefore assuming the -CDM cosmology with , we can uniquely determine the redshift through the luminosity distance which is a function of redshift. We call this as the pseudo redshift. The important point here is that the left hand side of Eq. (3) is a monotonically increasing function of from zero for to for so that a unique solution exists for any observed value of the right hand side. To estimate uncertainties of pseudo redshifts, 1- intrinsic dispersion of the relation on the normalization of the equation (3) are taken into account.
We used the data of 79 bright SGRBs observed by CGRO-BATSE reported by Ghirlanda et al. (2009). The values were not measured for 8 samples, so that finally we use 71 samples listed in their list. They selected the events with the burst duration of and the peak photon flux of in 64 msec time resolution. They basically used the cutoff power-law (CPL) model to measure the spectral parameters. Using Eq. (5), we can estimate the pseudo redshifts of all 71 SGRBs. In Fig. 4, we show the distribution on the plane. The solid line is a reference of flux limit of . We found that the pseudo ranges from to . The mean pseudo redshift is 1.05. However, We expect more dim SGRBs under the solid line. We note here that for LGRBs (Jakobsson et al., 2012). In Fig. 3, there are few SGRBs for low with large . This might be a selection effect since the comoving volume is in proportion to for so that the SGRB with large would be rare. For , we do not see such an effect. Although in principle we can determine the luminosity function as in Yonetoku et al. (2004), in practice, the number of SGRBs is too small to do so. In Figure 3, we plot pseudo – diagram for 71 BATSE bright SGRBs (blue filled triangle) with secure and misguided SGRBs in the left of Figure 2. The distribution of BATSE bright SGRBs is very similar to that of the secure SGRBs. Furthermore, all of them are out of the 3- region of LGRBs indicated by the dotted lines so that there is no misguided SGRBs in them.
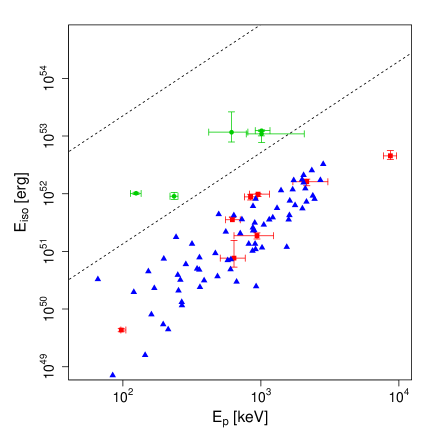
Figure. 4 shows that the pseudo redshift distribution of the bright BATSE SGRBs has a rather sharp cut off around . This favors the compact star merger scenario of SGRBs since the time is needed for the binary to merge so that there might be the maximum redshift of SGRBs. Our result seems to be different from the result of Ghirlanda et al. (2004) in which the distribution of pseudo redshifts of SGRBs are similar to that of LGRBs. This is because they assumed the – correlation for LGRBs in Yonetoku et al. (2004). The correlation for LGRBs can be rewritten as which is times brighter than Eq. (2) and then assuming such a bright correlation overestimates pseudo redshifts. We used the correlation constructed with only secure SGRBs, and then our result would be much more reliable.
4 Discussions
As mentioned before, the comparison of the distribution of LGRBs and SGRBs in – and – planes was performed in Zhang et al. (2012). As to the former, they recognized the difference in the distribution and found that the – correlation from SGRBs is almost parallel but dimmer by a factor of 10 compared with the one from LGRBs. This is reasonably consistent with our result. However, as to the latter, they insisted that SGRBs follow the same correlation as the one derived from LGRBs, which is in contradiction with our analysis. Below, we will discuss the origin of this discrepancy.
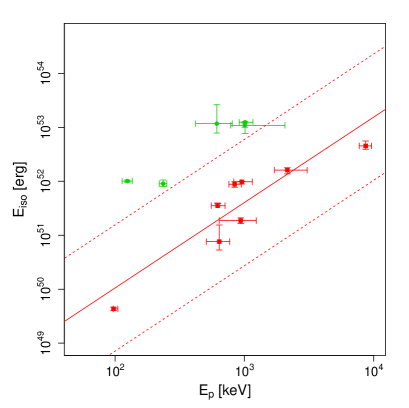
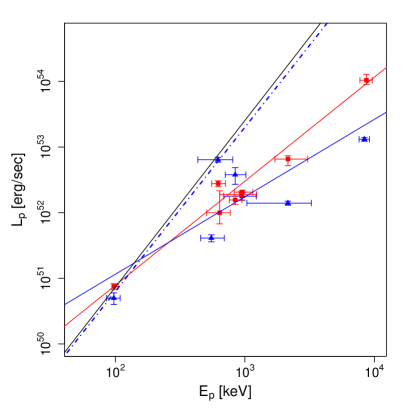
The left panel of Figure 5 shows – diagram for our secure SGRB sample (red filled circles) and SGRB sample from Zhang et al. (2012) (blue filled squares) with the best-fit line for each sample. Here it should be noted that the best-fit line solely from SGRBs was not derived in Zhang et al. (2012) and was newly derived here. The best-fit line for LGRBs of Yonetoku et al. (2010) is also plotted with a black solid line. We can see that all but one events are located below the LGRB line. This fact indicates that SGRBs are systematically dimmer than LGRBs with the same even if we consider SGRB sample by Zhang et al. (2012).
Here we should note that 7 of 8 SGRBs in our sample are actually the same events with Zhang et al. (2012), though they have different values of which leads to the different best-fit lines. Let us comment on the difference in each event. First of all, our peak luminosities are uniformly defined by the 64-msec time resolution in obesrver frame for all SGRBs, while Zhang et al. (2012) used different time resolutions (from 4 ms to 1024 ms). This is because they adopted the values of reported by multiple observation teams. The value of 4-msec peak luminosity is typically a few times larger than that of 1024-msec peak luminosity (Tsutsui et al., 2011, 2012) so that using different time resolution to define would make artificial dispersion in the – correlation (Yonetoku et al., 2010). Secondly, we integrate energy spectra between 1-100,000 keV in GRB rest frame to calculate , while an energy range of 1-10,000 keV was considered in Zhang et al. (2012). Therefore they tend to underestimate compared with us. From these reasons, the values of are different in the two samples and, we believe, our sample is more reliable compared with Zhang et al. (2012).
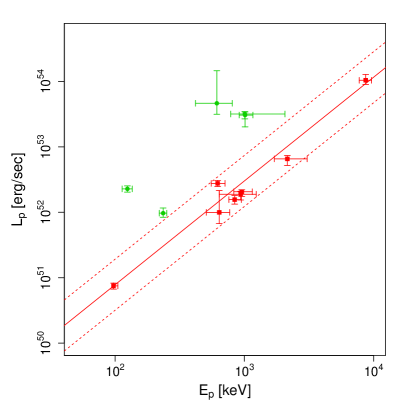
On the other hand, the correlation for the LGRBs are also different between our analysis and Zhang et al. (2012). The right panel of Figure 5 is the same diagram as the left panel, but the best-fit line is for LGRBs in Ghirlanda et al. (2010) which Zhang et al. (2012) uses. The best-fit line for combined short and long GRB sample obtained by Zhang et al. (2012) is also plotted with a blue dash-doted line. Although the best-fit lines are significantly different from ours, the same tendency can still be seen.
It is beyond the scope of this paper to explain the difference between the – correlations for LGRBs from Ghirlanda et al. (2010) and the one from Yonetoku et al. (2010), and we just make a short remark on this. The major difference comes from the treatment of GRB 060218. The former regarded it as a ordinary LGRB, while in the latter it was regarded as an outlier by a statistical argument. Because GRB 060218 is located far away from the – correlation of Yonetoku et al. (2010) (more than 8-), it makes the best-fit line much steeper like the one of Ghirlanda et al. (2010). Anyway, it seems to be robust that SGRBs have systimatically smaller than LGRBs for a given , even if we consider the possible systematic errors in LGRBs, as well as SGRBs.
In this paper, we suggested possible correlations among , and even for SGRBs. However, the correlations for SGRBs are much dimmer than those for LGRBs. The – (–) correlation for SGRBs is located approximately () times below the one for LGRBs. For the – correlation for SGRBs, similar arguments have been made by some authors (Ghirlanda et al., 2009; Zhang et al., 2012), but we for the first time argue that there exist distinct – and – correlations for SGRBs.
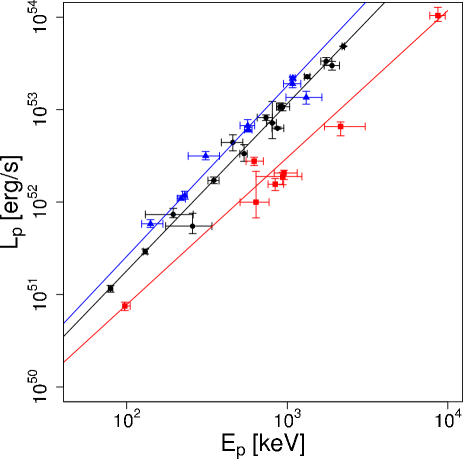
The distinction between SGRBs and LGRBs becomes much clearer if we use the gold sample of LGRBs compiled by Tsutsui et al. (2012). Tsutsui et al. (2012) argued that there are two – correlations, one is for small- GRBs and the other is for large- GRBs, where stands for Absolute Deviations from Constant Luminosity. In figure 6, we shows the – diagram for small- LGRBs (black filled circles), large- LGRBs (blue filled triangles), and secure SGRBs (red filled squares). The outliers of gold sample in Tsutsui et al. (2012) and misguided SGRBs are removed from this figure. We can see the existence of three distinct – correlations with almost the same power law index and different amplitudes.
The accurate functional forms of – and – correlation are very important to study the progenitor and the radiation mechanism of SGRBs. At present the intrinsic dispersion is rather large, that is , 0.13(0.39) in logarithm for –(–), respectively. This is mainly due to the small number of secure SGRBs, which prevents more detailed analysis. In conclusion we need more data of SGRBs with accurate , , and to confirm or refute the – and – correlations for SGRBs suggested in this Letter.
Acknowledgments
This work is supported in part by the Grant-in-Aid for Young Scientists (B) from the Japan Society for Promotion of Science (JSPS), No.24740116(RT), by the Grant-in-Aid from the Ministry of Education, Culture, Sports, Science and Technology (MEXT) of Japan, No.23540305, No. 24103006 (TN), No.20674002 (DY), No.23740179, 24111710, and 24340048 (KT), and by the Grant-in-Aid for the global COE program The Next Generation of Physics, Spun from Universality and Emergence at Kyoto University.
References
- Amati (2006) Amati L., 2006, Monthly Notices of the Royal Astronomical Society, 372, 233
- Amati et al. (2009) Amati L., Frontera F., Guidorzi C., 2009, Astronomy and Astrophysics, 508, 173
- Amati et al. (2002) Amati L. et al., 2002, Astronomy and Astrophysics, 390, 81
- Band et al. (1993) Band D. et al., 1993, Astrophysical Journal, 413, 281
- Band & Preece (2005) Band D. L., Preece R. D., 2005, The Astrophysical Journal, 627, 319
- Butler et al. (2007) Butler N. R., Kocevski D., Bloom J. S., Curtis J. L., 2007, The Astrophysical Journal, 671, 656
- Ghirlanda et al. (2004) Ghirlanda G., Ghisellini G., Celotti A., 2004, Astronomy and Astrophysics, 422, L55
- Ghirlanda et al. (2005a) Ghirlanda G., Ghisellini G., Firmani C., 2005a, Monthly Notices of the Royal Astronomical Society: Letters, 361, L10
- Ghirlanda et al. (2005b) Ghirlanda G., Ghisellini G., Firmani C., Celotti A., Bosnjak Z., 2005b, Monthly Notices of the Royal Astronomical Society: Letters, 360, L45
- Ghirlanda et al. (2011) Ghirlanda G., Ghisellini G., Nava L., Burlon D., 2011, Monthly Notices of the Royal Astronomical Society: Letters, 410, L47
- Ghirlanda et al. (2010) Ghirlanda G., Nava L., Ghisellini G., 2010, Astronomy and Astrophysics, 511, 43
- Ghirlanda et al. (2009) Ghirlanda G., Nava L., Ghisellini G., Celotti A., Firmani C., 2009, Astronomy and Astrophysics, 496, 585
- Golenetskii et al. (2010) Golenetskii S. et al., 2010, GRB Coordinates Network, 1147
- Golenetskii et al. (2004) Golenetskii S., Aptekar R., Mazets E., Pal’Shin V., Frederiks D., Cline T., 2004, GRB Coordinates Network, 2754, 1
- Golenetskii et al. (2005) Golenetskii S., Aptekar R., Mazets E., Pal’Shin V., Frederiks D., Cline T., 2005, GRB Coordinates Network, 4394, 1
- Golenetskii et al. (2006) Golenetskii S., Aptekar R., Mazets E., Pal’Shin V., Frederiks D., Cline T., 2006, GRB Coordinates Network, 5710, 1
- Golenetskii et al. (2007) Golenetskii S., Aptekar R., Mazets E., Pal’Shin V., Frederiks D., Cline T., 2007, GRB Coordinates Network, 6960, 1
- Gruber et al. (2011) Gruber D. et al., 2011, Astronomy & Astrophysics, 531, 20
- Jakobsson et al. (2012) Jakobsson P. et al., 2012, The Astrophysical Journal, 752, 62
- Kodaka et al. (2007) Kodaka N. et al., 2007, GRB Coordinates Network, 6637, 1
- Krimm et al. (2009) Krimm H. A. et al., 2009, The Astrophysical Journal, 704, 1405
- Lamb et al. (2004) Lamb D. Q. et al., 2004, New Astronomy Reviews, 48, 423
- Levesque et al. (2010) Levesque E. M. et al., 2010, Monthly Notices of the Royal Astronomical Society, 401, 963
- Lü et al. (2010) Lü H.-J., Liang E.-W., Zhang B.-B., Zhang B., 2010, The Astrophysical Journal, 725, 1965
- Nakar & Piran (2005) Nakar E., Piran T., 2005, Monthly Notices of the Royal Astronomical Society: Letters, 360, L73
- Norris et al. (2005) Norris J., Sakamoto T., Band D., Barthelmy S., 2005, GRB Coordinates Network, 4388, 1
- Ohno et al. (2009) Ohno M., Ioka K., Yamaoka K., Tashiro M., Fukazawa Y., Nakagawa Y. E., 2009, Publications of the Astronomical Society of Japan, 61, 201
- Ohno et al. (2007) Ohno M. et al., 2007, GRB Coordinates Network, 6638, 1
- Pal’Shin et al. (2008) Pal’Shin V. et al., 2008, GRB Coordinates Network, 8256, 1
- Sakamoto et al. (2004) Sakamoto T. et al., 2004, The Astrophysical Journal, 602, 875
- Shahmoradi & Nemiroff (2010) Shahmoradi A., Nemiroff R., 2010, Monthly Notices of the Royal Astronomical Society, 407, 2075
- Stamatikos et al. (2008) Stamatikos M. et al., 2008, GRB Coordinates Network, 8222, 1
- Tsutsui et al. (2009) Tsutsui R., Nakamura T., Yonetoku D., Murakami T., Kodama Y., Takahashi K., 2009, Journal of Cosmology and Astroparticle Physics, 08, 015
- Tsutsui et al. (2011) Tsutsui R., Nakamura T., Yonetoku D., Murakami T., Morihara Y., Takahashi K., 2011, Publications of the Astronomical Society of Japan, 63, 741
- Tsutsui et al. (2012) Tsutsui R., Nakamura T., Yonetoku D., Takahashi K., Morihara Y., 2012, eprint arXiv, 1201, 2763, PASJ in press
- Villasenor et al. (2005) Villasenor J. S. et al., 2005, Nature, 437, 855
- Yonetoku et al. (2004) Yonetoku D., Murakami T., Nakamura T., Yamazaki R., Inoue A. K., Ioka K., 2004, The Astrophysical Journal, 609, 935
- Yonetoku et al. (2010) Yonetoku D., Murakami T., Tsutsui R., Nakamura T., Morihara Y., Takahashi K., 2010, Publications of the Astronomical Society of Japan, 62, 1495
- Zhang et al. (2009) Zhang B. et al., 2009, The Astrophysical Journal, 703, 1696
- Zhang et al. (2012) Zhang F.-W., Shao L., Yan J.-Z., Wei D.-M., 2012, eprint arXiv, 1201, 1549, 26 pages, 9 figures