Consequences of an attractive force on collective modes and dust structures in a strongly coupled dusty plasma
Abstract
We present investigations of the combined effects of Debye-Hückel repulsive and overlaping Debye spheres attractive interaction potentials around charged dust particles on collective modes, phase separation and ordered structures in a strongly coupled dusty plasma. We obtain static and dynamical information via Molecular Dynamics simulations in the liquid and crystallized phases and identify the onset of an instability in the transverse mode, by using lattice summation method. The results are useful for understanding the origin of coagulation/agglomeration of charged dust particles and the formation of ordered dust structures in low-temperature laboratory and space plasmas.
keywords:
dusty plasmas , attractive force , molecular dynamics simulation , collective excitations1 Introduction
Dusty plasmas are composed of electrons, ions and dust particles of different sizes (ranging from nanometer to micrometer). Dust particles, which are negatively charged by absorbing electrons from the background plasma, respond to electrostatic and electromagnetic fields and become active components of the dusty plasma system, especially when their dynamics comes into the picture at kinetic levels [1, 2]. Dusty plasmas are ubiquitous in many physical environments, viz. in interstellar media and nebulas, in our solar sysem (e.g. Saturn’s ring system, cometary tails and comas, in in the Earth’s mesosphere and ionosphere), in industrial and laboratory processing plasmas for high-technological applications (also in medicine), as well in laboratory gas discharges and magnetically confined fusion reactors. In low-temperature laboratory dusty plasmas on ground and on International Space Station under microgravity, dust is intentionally introduced in plasmas for fundamental studies of collective phenomena at kinetic level (e.g. the discovey of the dust acoustic wave [3]), involving an ensemble of charged dust grains. In astrophysics, the coagulation of charged dust particulates plays a significant role in the formation of large scale structures (e.g. plenetesimals). There are forthcoming space missions for exploring the composition and dynamics of dust particles in the vicinity of Sun, as well on Mars and Moon.
To describe the interaction between the charged dust particles in dusty plasma systems, the Debye-Hückel (DH) potential has been widely adopted as a model potential around a chargd dust grain that has a well defined surface potential. The DH potential expresses that the Coulomb repulsion between the charged gains of similar polarity is screened by the plasma environment, where electrons and ions represent a polarizable background. Consequently, the Coulomb potential is exponentially shielded over a characteristics distance, the dusty plasma Debye radius [1] , and we have
| (1) |
where is the charge of the dust particles and is the permittivity of free space.
At short inter-particle distances, the DH interaction potential has to be modified, since the Debye spheres of the neighboring grains would overlap [4]. From classical electrostatics, one can then derive an additional term of the interparticle potential that expresses the interaction between these overlapping Debye spheres (ODS) [4, 5]. The resulting (total) potential in this case becomes
| (2) |
which exhibits an attractive force beteen charged dust grains of the same polarity at distances beyond .
In this Letter, we investigate the effect of this peculiarity of the attractive potential on the structure of two-dimensional dust-plasma systems in the crystallized phase and in the strongly coupled liquid phase, where the potential energy dominates over the kinetic energy, i.e. , where is the coupling parameter, viz.
| (3) |
Here is the Boltzmann constant, the dust temperature, and the Wigner-Seitz radius (that characterizes the inter-dust particle spacing), with being the dust particle number density. We also introduce the dimensionless screening parameter
| (4) |
In a previous theoreical investigation [6], the attractive term in has been shown to cause instability of transverse dust lattice oscillations. Considering the nearest neighbor interactions only, the onset of instability was identified at , where is the lattice constant. For the triangular lattice , the critical screening value in terms of the inter-grain spacing becomes 1.43.
As regards to the strongly coupled liquid phase, Molecular Dynamics simulations have confirmed that gives rise to an uneven spatial distribution (agglomeration) of dust particles [7].
2 Methods
In our numerical work, we use a standard Molecular Dynamics simulation method with Langevin dynamics [8, 9]. The system is two-dimensional and we use periodic boundary conditions. We carry out computations with both potentials, and . The simulations are initialized either by a spatially random particle configuration (in the studies of the liquid phase, with = 10,000 dust particles) or by a lattice configuration (in the studies of the crystallized phase, with = 9180 dust particles). The side lengths of the simulation box are chosen to accommodate a perfect triangular lattice. Initial dust particle velocities are sampled from a Maxwellian distribution of the temperature , corresponding to the specified value of the coupling parameter . The interaction between the dust particles is limited to distances smaller than a cutoff radius, , which is chosen to be large enough so that interparticle forces at become very small due to the exponential term in the interaction potential. The neighbors of the dust particles within are searched using the chaining mesh technique.
The equation of motion includes terms representing the frictional damping and random forces, which express random collisions of gas molecules with the charged dust particles. We have
| (5) |
where is the interaction potential between dust particles and , is the frictional damping, and is a random force, see e.g. [8, 9]. In all our simulations, we use a small friction value, , where is the nominal 2D dust plasma frequency, with being the dust particle mass. We introduce dimensionless distance as and the wave number as .
The pair correlation function and the static structure function are derived in the simulations in the standard manner. Information about the (thermally excited) collective modes and their dispersion is obtained from the Fourier analysis of the correlation spectra of the density fluctuations,
| (6) |
yielding the dynamical structure function as [10]:
| (7) |
where is the length of data recording period and is the Fourier transform of (6).
Similarly, the spectra of the longitudinal and transverse current fluctuations, and can be obtained from Fourier analysis of the microscopic quantities, respectively,
| (8) |
where and are the position and velocity of the -th particle. Here we assume that is directed along the axis (the system is isotropic) and accordingly omit the vector notation of the wave number. This calculation allows the derivation of the spectra for a series of wave numbers, which are multiples of , where is the edge length of the simulation box in the (or ) direction. The collective modes are identified as peaks in the fluctuation spectra.
The phonon dispersion in the lattice configuration is calculated in terms of the lattice dynamical matrix defined as
| (9) | |||
with a summation over all the lattice sites , keeping fixed . The lattice dynamical matrix reflects the symmetry of the underlying lattice. The diagonalization of is possible in the coordinate system of the eigenvectors, whose orientations, in general, do not coincide either with the direction of or with the crystallographic axes. To find the eigenmodes, we follow the traditional method of solving the secular equation
| (10) |
3 Results
In figure 1 we present an overview of the main static characteristics of our dusty plasma system: the four panels display the pair correlation function [] and the static structure function [] for the domain of the screening parameter, for both types of potentials. The coupling parameter is fixed at = 120; at this value the system is in the liquid phase for the whole range of values covered. Panels (a) and (b) correspond to , while (c) and (d) correspond to . At small screening values, viz. , the and functions are similar for both potentials, showing slightly less organized structures (indicated by smaller amplitude the peaks) in the case of . In the case of , we observe major changes in both static quantities in the vicinity of the screening value 1.3. In a strong peak develops at small separations, indicating particle agglomeration and suddenly increases at small wave numbers, indicating development of large-scale structures.
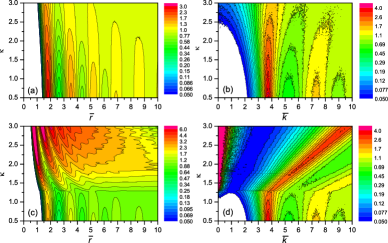
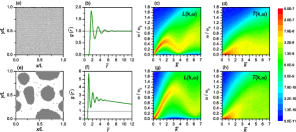
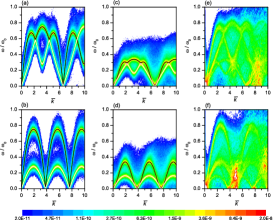
Figure 2 shows a comparison between systems characterized by and , at and . At this screening strength, the system with already exhibits agglomeration, as the particle snapshot and the corresponding pair correlation function (in panels (e) and (f) of figure 2) illustrate. A notable difference in the spectrum is the significant increase of the maximum mode frequency from (at ) to 1.1 (at ), and an increase of the wave number where this frequency is found, from 1.9 to 3.1. As the transverse mode is quite weak in the liquid phase, it is more difficult to characterize quantitatively the frequency of this mode, but an increase of the frequency is observable, too.
Next, we compare the results of our MD simulations with those obtained from lattice summation. To be able to do that, we have initialized the simulations with a lattice configuration and set a very high coupling value, . Figure 3 shows the results for three cases: (i) with , (ii) with , and (iii) with The lattice is stable in the first two of these three cases, while the third case belongs to the unstable domain with . The MD and lattice calculation results are in very good agreement for the stable cases. The figure exhibits that the L and T modes are superimposed, at propagation directions of (the direction of the nearest neighbor) and . In these propagation directions, the polarization of the modes becomes purely longitudinal and transverse, in other directions the polarizations mix. At complicated structures appear in the fluctuation spectra that are difficult to interpret.
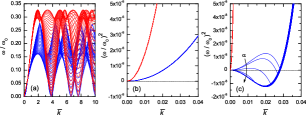
Figure 4 displays the results of lattice summations for the eigenfrequencies of the two modes, for , characterizing the interaction of dust particles with overlapping Debye spheres. Figure 4(a) shows the dispersion relation of the modes with different propagation directions, for , which belongs to the stable regime of the lattice at = 0. The two branches of the curves correspond to “quasi-longitudinal” and “quasi-transverse” modes. The polarization of the modes is usually mixed, except for the principal directions ( and ), where the polarization is purely longitudinal or transverse. Figure 4(b) exhibits values for small wave numbers at . In this domain, all dispersion curves for overlap. Figure 4(c) shows also a zoomed part of the mode dispersion relations, but for ; at this screening value negative values appear that correspond to an instability of the lattice.
The critical value of the screening parameter was found to be in our lattice calculations (that add contributions to the dynamical matrix up to the 126th neighbors of the particles). The theoretical calculations [6] taking into account the nearest neighbor interactions only resulted in 1.43. In our MD simulations carried out for we found that the lattice disintegrates between and , while in the fluid phase, as shown in Figure 1 for , an instability occurs at 1.3. These changes indicate the effect of the temperature on the development of the instability.
4 Summary
Summing up, we have investigated the effect of an attractive term of the interaction potential in addition to the DH potential, conventionally used to model dusty plasmas, on the static and dynamical characteristics of many-body dust-plasma systems. Molecular dynamics simulations (with a Langevin approach) carried out in the liquid phase showed that the onset of particle agglomeration at screening values exceeding a critical value. The particle agglomeration was accompanied with a significant increase of the frequencies of the longitudinal and transverse collective excitations. In the crystallized phase, the MD simulations revealed that the hexagonal lattice becomes unstable at high screening. These observations have been confirmed by harmonic lattice summations in the zero temperature limit, which showed the development of an instability in the (quasi-)transverse modes at the critical screening value of . In conclusion, we stress that the results of the present investigation are useful for understanding the origin of agglomaration/coagulation of charged dust particles and the formation of ordered dust structures in low-temparature laboratory and space dusty plasmas [2].
This work was supported by the Hungarian Fund for Scientific Research through grants K77653, K105476, NN103150, and by the HELIOS project (ELI 09-1-2010-0010).
References
- [1] P. K. Shukla and A. A. Mamun, Introduction to Dusty Plasma Physics (Institute of Physics, Bristol, 2002).
- [2] V. E. Fortov and G. E. Morfill (Eds), Complex and Dusty Plasmas: From Laboratory to Space (CRC Press, Taylor & Francis Group, 2010).
- [3] N. N. Rao, P. K. Shukla, and M. Y. Yu, Planet. Space Sci. 38, (1990) 543.
- [4] D. P. Resendes, J. T. Mendonça and P. K. Shukla, Phys. Lett. A 239 (1998) 181.
- [5] P. K. Shukla and B. Eliasson, Rev. Mod. Phys. 81 (2009) 25.
- [6] W. S. Chang, I. M. Jung and Y.D. Jung, Phys. Lett A 347 (2005) 248.
- [7] L. J. Hou, P. K. Shukla and A. Piel, Phys. Lett A 373 (2009) 458.
- [8] L. J. Hou and Z. L. Mišković, arXiv:0806.3912, “A Gear-like Predictor-Corrector method for Brownian Dynamics Simulation”
- [9] L. J. Hou, Z. L. Mišković, A. Piel, and P. K. Shukla, Phys. Plasmas 16 (2009) 053705.
- [10] J. P. Hansen, I. R. McDonald and E. L. Pollock, Phys. Rev. A 11 (1975) 1025.