Astrometric and photometric initial mass functions from the UKIDSS Galactic Clusters Survey: III Praesepe††thanks: Based on observations made with the United Kingdom Infrared Telescope, operatred by the Join Astronomy Centre on behalf of the U.K. Particle Physics and Astronomy Research Council.
Abstract
Over the past decades open clusters have been the subject of many studies. Such studies are crucial considering that the universality of the Initial Mass Function is still a subject of current investigations. Praesepe is an interesting open cluster for the study of the stellar and substellar mass function (MF), considering its intermediate age and its nearby distance. Here we present the results of a wide field, near–infrared study of Praesepe using the Data Release 9 (DR9) of the UKIRT Infrared Deep Sky Survey (UKIDSS) Galactic Clusters Survey (GCS). We obtained cluster candidates of Praesepe based on a 3 astrometric and 5 band photometric selection. We derived a binary frequency for Praesepe of 25.63.0% in the 0.2–0.45 M⊙ mass range, 19.63.0% for 0.1–0.2 M⊙, and 23.25.6% for 0.07–0.1 M⊙. We also studied the variability of the cluster candidates of Praesepe and we conclude that seven objects could be variable. We inferred the luminosity function of Praesepe in the and bands and derived its MF. We observe that our determination of the MF of Praesepe differs from previous studies: while previous MFs present an increase from 0.6 to 0.1 M⊙, our MF shows a decrease. We looked at the MF of Praesepe in two different regions of the cluster, i.e. within and beyond 1.25∘, and we observed that both regions present a MF which decrease to lower masses. We compared our results with the Hyades, the Pleiades and Per MF in the mass range of 0.072–0.6 M⊙ and showed that the Praesepe MF is more similar to Per although they are respectively aged 85 and 600 Myr. Even though of similar age, the Praesepe remains different than the Hyades, with a decrease in the MF of only 0.2 dex from 0.6 down to 0.1 , compared to 1 dex for the Hyades.
keywords:
Techniques: photometric – stars: low-mass, brown dwarfs; stars: luminosity function, mass function – galaxy: open cluster and associations: individual (Praesepe) – infrared: stars.1 INTRODUCTION
Over the past decades, open clusters have been the subject of many studies (e.g. Bastian et al., 2010, and references therein). Such studies have brought new insights into brown dwarf formation (e.g. Kumar & Schmeja, 2007; Boudreault & Bailer-Jones, 2009; Béjar et al., 2011), on the discovery of young L and T dwarf and free-floating planets (e.g. Bouvier et al., 2008; Lodieu et al., 2008; Zapatero Osorio et al., 2008; Bihain et al., 2009; Lucas et al., 2010; Quanz et al., 2010; Peña Ramírez et al., 2008), and on our understanding of the stellar/substellar mass function (MF) (see review by Bastian et al., 2010) and their populations in the Galactic field and in open clusters (see review by Chabrier, 2003). Such studies are crucial considering that the universality of the Initial Mass Function (IMF) is still a subject of current investigations (e.g. Kroupa, 2002; Covey et al., 2011; Myers et al., 2011; Leigh et al., 2012; Marks & Kroupa, 2012). Most works on the substellar MF have focused on young open clusters with ages less than 150 Myr. This is partly because brown dwarfs (BDs) are bright when they are young, thus aiding the detection of the least massive objects. However, the extension of MF studies to older clusters is vital as it allows us to study the intrinsic evolution of BDs and how the stellar and substellar population itself evolves.
Praesepe (M 44, NGC 2632, RA=8h40.4m, DEC=19∘41′) is an interesting open cluster to study the MF in the stellar and substellar regimes, considering its age ( Myr; Fossati et al., 2008) and its distance ( mag, pc; van Leeuwen, 2009), its known proper motion ( mas/yr and mas/yr; van Leeuwen, 2009), and the low extinction towards this cluster (; Taylor, 2006), while determinations of the metallicity of Praesepe go from solar-type with [Fe/H]0.039 dex (Friel & Boesgaard, 1992) to slightly metal rich with [Fe/H]0.10 dex (Pace et al., 2008). So far, several surveys for stellar and substellar objects in the open cluster Praesepe have been performed (e.g. Jones & Cudworth, 1983; Hodgkin et al., 1999; Baker et al., 2010). Some surveys have the advantage of covering a large area and using proper motions, but are rather shallow (e.g. Hambly et al., 1995; Kraus & Hillenbrand, 2007), while other surveys used deep photometry, but lacked wide areal coverage (e.g. González-García et al., 2006; Boudreault et al., 2010; Wang et al., 2011).
The UKIRT Infrared Deep Sky Survey (UKIDSS; Lawrence et al., 2007) is a deep large scale infrared survey conducted with the wide field camera WFCAM (Casali et al., 2007) on UKIRT (Mauna Kea, Hawai’i). The survey is subdivided into five components: the Large Area Survey, the Galactic Clusters Survey (hereafter GCS), the Galactic Plane Survey, the Deep Extragalactic Survey, and the Ultra-Deep Survey. The GCS aims at covering 1000 square degrees in 10 star forming regions and open clusters down to = 18.4 mag at two epochs. The main scientific driver of the survey is to study the IMF and its dependence with environment in the substellar regime using an homogeneous set of low-mass stars and brown dwarfs over large areas in several regions. The UKIDSS GCS is, therefore, a perfect tool to study the open cluster Praesepe, considering the large coverage from the UKIDSS Data Release 9 (DR9) with its relative deep photometry spanning from 10.9 mag (i.e. 0.7 M⊙) down to 19.3 mag (i.e. 55 MJup), combined with astrometric information.
Here we present the results of a wide–field near–infrared study of the Praesepe cluster using the DR9 of the UKIDSS GCS. The paper is structured as follows. First we present the dataset used in our analysis (Section 2), followed by a cross–match with previous surveys (Section 3). Then we extract the new stellar and substellar members in Praesepe based on our selection criteria (Section 4). We discuss the level of contamination (Section 5), the multiplicity of low-mass Praesepe members (Section 6), and the variability of our cluster candidates (Section 7). Finally we derive the luminosity function (LF) and MF of Praesepe (Section 8).
2 THE PHOTOMETRIC AND ASTROMETRIC SAMPLE
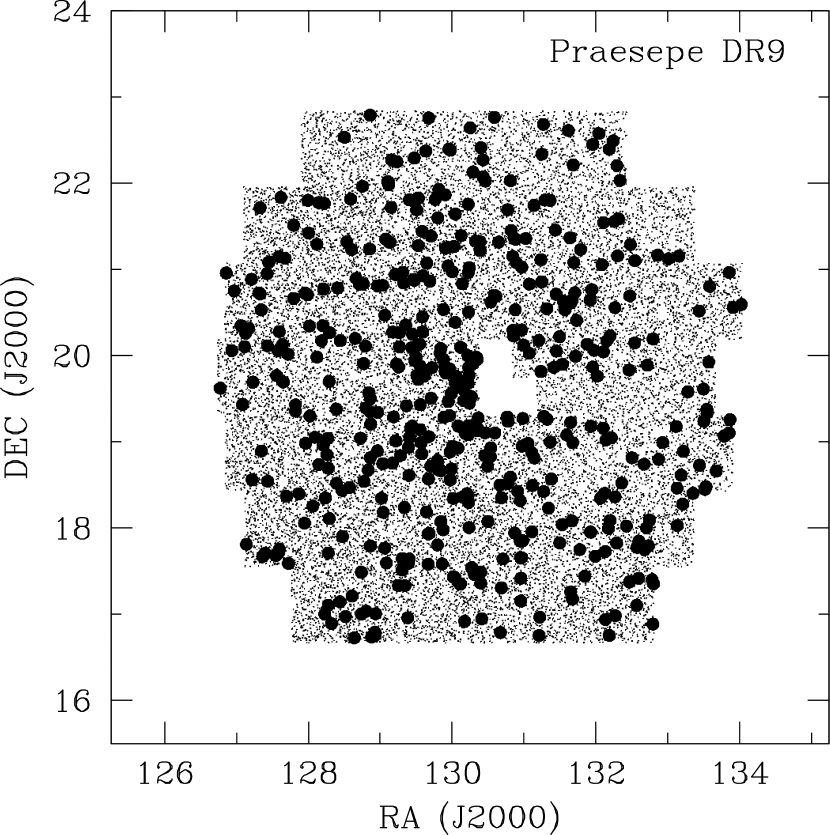
The UKIDSS GCS DR9 covers 36 square degrees observed in five passbands (; Hewett et al., 2006) in the Praesepe cluster over a region defined by RA=126–134 degrees and Dec=16.5–23.0 degrees. Unfortunately, we are missing a region of approximately 0.585 square degrees in the central region of Praesepe, delineated by (RA,DEC) from (130.37,19.3) to (131.2,19.75) and (130.37,19.75) to (130.84,20.2) degrees (Fig. 1).
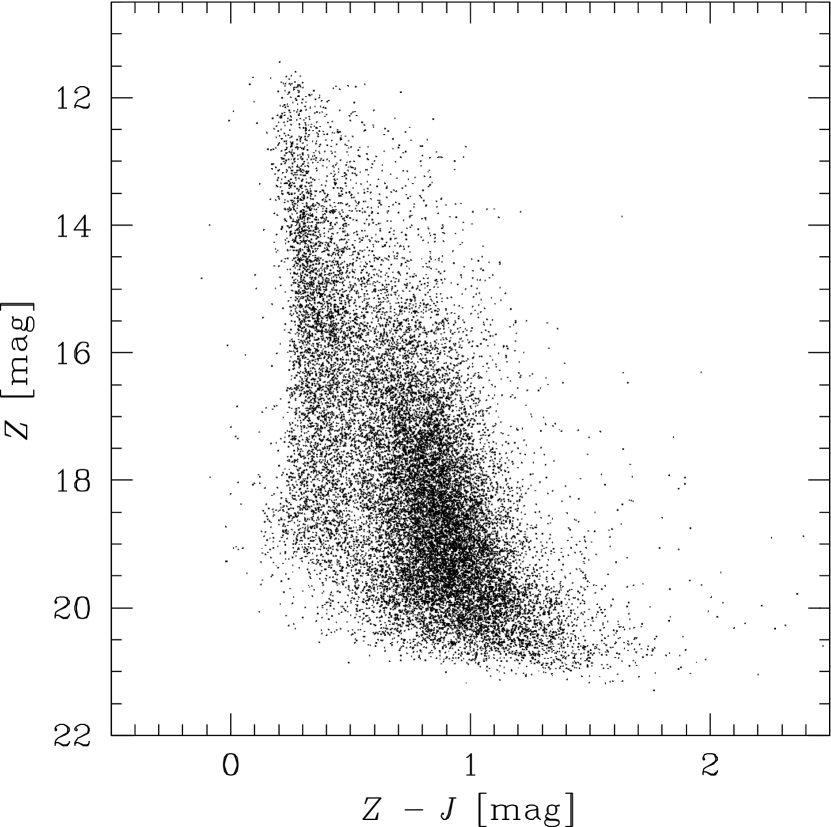
We selected all good quality point sources in Praesepe detected in with no constraint on detection in , , and 2 (second epoch K band). We imposed a selection on point sources only in and pushed the completeness towards the faint end by insisting on the ClassStat parameters which represent the roundness of an image (i.e. 3ClassStat3). The Structured Query Language (SQL) query used to select sources along the line of sight of the Praesepe is identical to the query used for the Pleiades (Lodieu et al., 2012a). The SQL query includes the cross–match with 2MASS (Cutri et al., 2003; Skrutskie et al., 2006) to compute proper motions for all sources brighter than the 2MASS 5 completeness limit at = 15.8 mag as well as the selection of proper motion information from that newly available in UKIDSS DR9. We used the GCS proper motion measurements in this work as they are more accurate due to the homogeneous coverage, completeness, and spatial resolution of the GCS. We limited our selection to sources fainter than = 11.7, = 11.8, = 10.9, = 11.4, 1 = 10.0 and 2 = 10.4 mag to avoid saturation. The completeness limits, taken as the magnitude where the straight line fitting the shape of the number of sources as a function of magnitudes falls off, are = 20.4, = 20.0, = 19.3, = 18.7, 1 = 17.9, and 2 = 18.4 mag. (The method for deriving the detection limit is presented in Lodieu et al., 2009.)
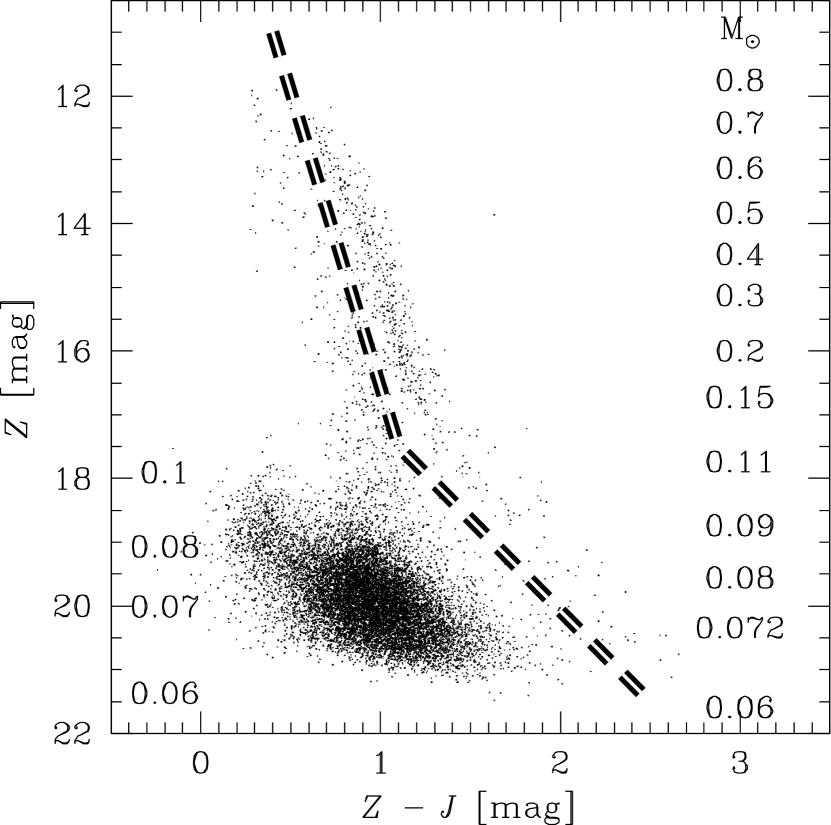
The query returned 218,141 sources with = 10.9–21.2 mag over 36 square degrees towards Praesepe. The full GCS DR9 coverage is displayed in Fig. 1. The resulting (,) colour–magnitude diagram (CMD) is shown in Fig. 2.
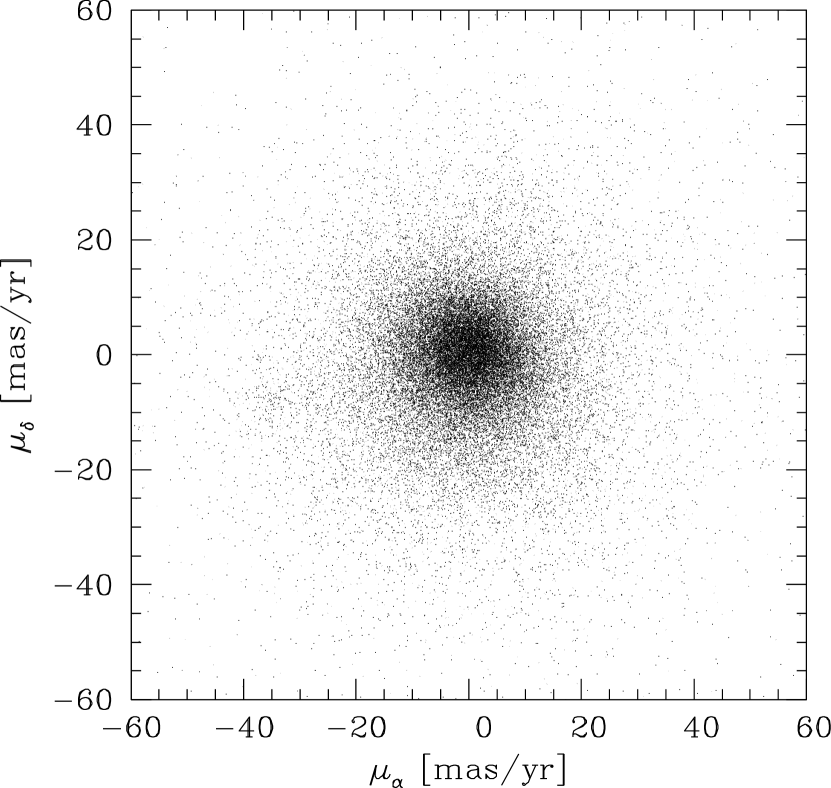
Proper motion measurements are available in the WFCAM Science Archive for UKIDSS data releases from the Data Release 9 (DR9) for all the wide/shallow survey with multiple epoch coverage in each field, including the GCS. The details of the procedure to derive the relative proper motions is described in detail in Collins & Hambly (2012) and a summary is given in Lodieu et al. (2012a). The proper motion vector point diagram for all sources detected towards Praesepe is presented in Fig. 3.
3 CROSS-MATCH WITH PREVIOUS SURVEYS
We compiled a list of member candidates of Preasepe published from previous studies in Jones & Cudworth (1983), Hambly et al. (1995), Hodgkin et al. (1999), González-García et al. (2006), Kraus & Hillenbrand (2007), Baker et al. (2010), Boudreault et al. (2010) and Wang et al. (2011). We matched these previously known members with the 218,141 sources from UKIDSS GCS DR9 towards Praesepe. Only those members with positions that are within 3 arcsec of the location of each object in these previous catalogues are included in our sample.
In Table 1 we present the numbers of cluster candidates published by each study (All) and the corresponding numbers of cluster candidates retrieved by the GCS (DR9). We also present in this table the number of objects recovered in our astrometric and photometric selections (see Section 4).
For some works (e.g. Jones & Cudworth, 1983; Hodgkin et al., 1999), the ratios of Praesepe member candidates published in the literature and recovered by the GCS DR9 are low (i.e. 51.5% and 58.8% respectively). These older works had shallow photometry and most of their candidates are saturated in the GCS DR9. Other works have large coverage beyond the area of the GCS DR9, with more than 30 and 300 square degrees for Hambly et al. (1995) and Kraus & Hillenbrand (2007), respectively. As for the cluster candidates from previous deep surveys (i.e. González-García et al., 2006; Boudreault et al., 2010; Wang et al., 2011), the objects not recovered are either too faint for UKIDSS GCS, or they are in the central area not covered (see Fig. 1). Finally, all but one (not detected in the second epoch of the –band observations) object from Baker et al. (2010) are recovered, since this work was based on an earlier release of the UKIDSS GCS.
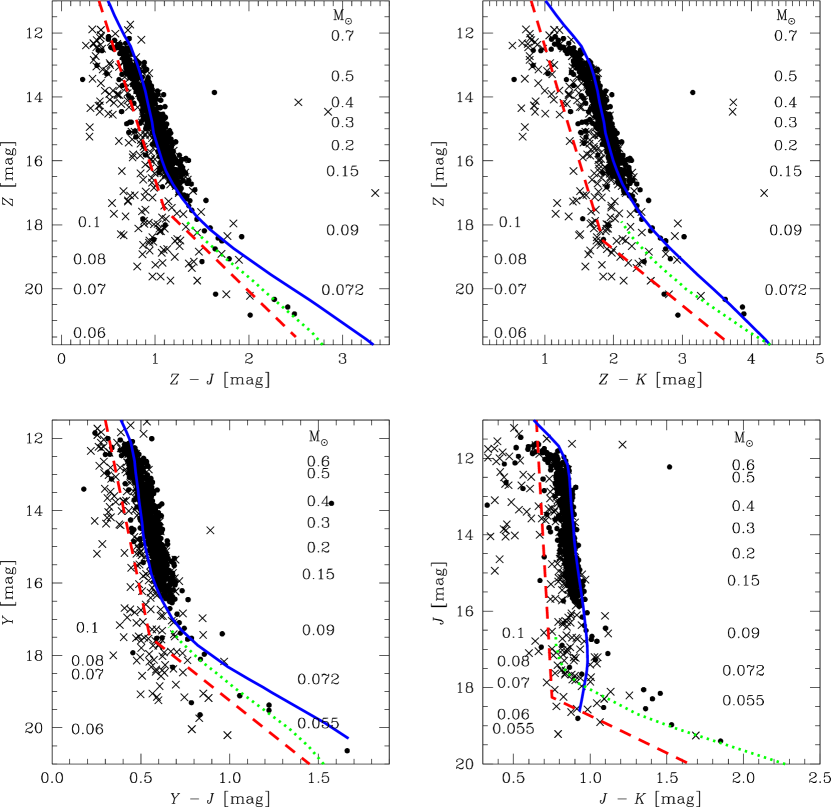
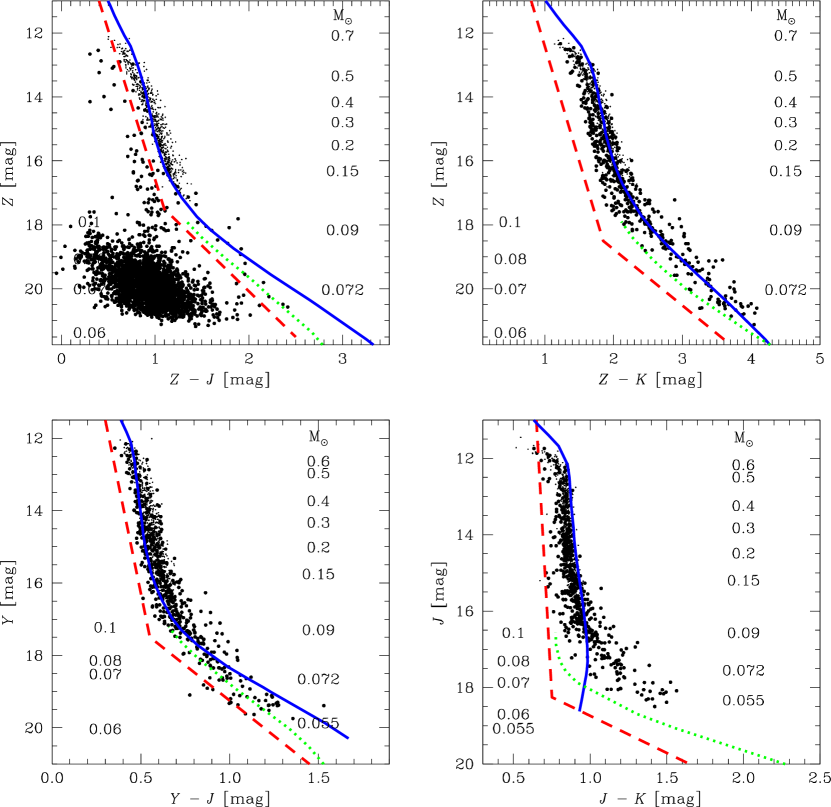
In Fig. 4 we present in four CMDs all Praesepe member candidates published in the literature and recovered by the GCS DR9. We use these previous cluster candidates with proper motions consistent with Praesepe membership (and those classified as proper motion non members) to define selection lines which will be used for our photometric selection (see Section 4).
| Survey | All | DR9 | % | Memb | NM |
|---|---|---|---|---|---|
| Jones & Cudworth (1983) | 206 | 106 | 66.5 | 49 | 57 |
| Hambly et al. (1995) | 515 | 383 | 74.4 | 323 | 60 |
| Hodgkin et al. (1999) | 17 | 10 | 58.8 | 6 | 4 |
| González-García et al. (2006) | 20 | 14 | 70.0 | 1 | 13 |
| Kraus & Hillenbrand (2007) | 1130 | 711 | 62.9 | 654 | 57 |
| Baker et al. (2010) | 147 | 146 | 99.3 | 125 | 21 |
| Boudreault et al. (2010) | 150 | 100 | 66.7 | 37 | 61 |
| Wang et al. (2011) | 59 | 29 | 49.2 | 7 | 22 |
4 NEW STELLAR AND SUBSTELLAR MEMBERS IN THE PRAESEPE
The selection used in this work and presented in Section 4.1 and 4.2 is identical to our studies of the Pleiades (Lodieu et al., 2012a) and Per (Lodieu et al., 2012b) clusters. The main scientific goals of these studies is to perform an homogeneous analysis of the LF and MF of the Pleiades, Per, and Praesepe.
4.1 Astrometric selection
First we performed a selection based on the proper motion of Praesepe. The proper motion values of van Leeuwen (2009) are the absolute proper motion measurements obtained with Hipparcos. Here, the proper motion values from UKIDSS are relative to a reference frame defined by the faintest, most numerous objects detected in each frame. The position of the cluster in the relative proper motion diagram of Fig. 3 is mas/yr and mas/yr111We simply used the median of the distribution in (between 40 and 30 mas/yr) and (between 15 and 2 mas/yr) for all objects within 17 mag.. We select all objects within 3 of and within 3 of , where and 3 are the error on the measurement of and of each source in the UKIDSS GCS DR9 respectively. All the objects selected astrometrically within 3 are presented in a CMD of vs. in Fig. 5. From 218,141 sources detected in the UKIDSS GCS DR9 towards Praesepe, 33,854 objects are retrieved from our 3 astrometric selection (15.5%).
4.2 Photometric selection
We used the selection lines plotted in the CMDs of Fig. 4 to perform the photometric selection of our cluster candidates. These lines were chosen based on the position of previously reported Praesepe members recovered in UKIDSS GCS DR9 and by our astrometric selection. These lines are 2.5 sigma bluer than the location of the cluster sequence, where the value of sigma is the distribution in colour of the cluster sequence in four different bins of magnitude. The photometric criteria were defined as follows:
Candidates should be detected in the –bands
Candidates should lie above the lines defined by (,) = (0.4,11) and (1.1,17.5), and by (,) = (1.1,17.5) and (2.5,21.5)
Candidates should lie above the lines defined by (,) = (0.8,11) and (1.85,18.5), and by (,) = (1.85,18.5) and (3.7,21.75)
Candidates should lie above the lines defined by (,) = (0.3,11.5) and (0.55,17.5), and by (,) = (0.55,17.5) and (1.45,21)
Candidates should lie above the lines defined by (,) = (0.65,11) and (0.75,18.25), and by (,) = (0.75,18.25) and (1.65,20)
This is presented in Fig. 6, where we show the same four CMDs in Fig. 4 and the objects recovered by our astrometric selection. We also present the previously reported members of Praesepe recovered in UKIDSS DR9 GCS.
From 33,854 objects from our astrometric selection, 1,116 are retrieved from our photometric selection (3.3%). This final selection gives us the objects which will be used for our following analysis. Our cluster candidates are listed in Table 2 and in Table 3.
| RA | DEC | cos | |||||||
|---|---|---|---|---|---|---|---|---|---|
| (h m s) | (∘ ’ ”) | [mag] | [mag] | [mag] | [mag] | [mag] | [mag] | [mas/yr] | [mas/yr] |
| 8:46:44.83 | +22:12:46.3 | 16.9140.011 | 16.4490.009 | 15.8650.009 | 15.3100.009 | 15.0240.012 | 15.0290.006 | –26.85 3.54 | –16.99 3.54 |
| 8:43:15.16 | +22:01:47.2 | 16.0050.006 | 15.5460.005 | 15.0240.005 | 14.4270.005 | 14.1430.005 | 14.1620.003 | –29.28 3.55 | –3.86 3.55 |
| … | … | … | … | … | … | … | … | … | … |
| 8:34:04.31 | +16:58:24.7 | 15.3940.005 | 14.8890.004 | 14.3210.004 | 13.7570.003 | 13.4550.003 | 13.4540.002 | –31.56 3.45 | 2.76 3.45 |
| 8:37:31.99 | +16:57:35.7 | 14.9780.004 | 14.5220.003 | 13.9050.003 | 13.3560.002 | 13.0520.002 | 13.0510.002 | –34.85 3.45 | –3.12 3.45 |
| RA | DEC | Mass | |
|---|---|---|---|
| (h m s) | (∘ ’ ”) | [M⊙] | [K] |
| 8:46:44.83 | +22:12:46.3 | 0.1320.005 | 3062125 |
| 8:43:15.16 | +22:01:47.2 | 0.1980.013 | 3286217 |
| … | … | … | … |
| 8:34:04.31 | +16:58:24.7 | 0.2690.006 | 3397 74 |
| 8:37:31.99 | +16:57:35.7 | 0.3360.013 | 3465138 |
4.3 Search for lower mass members
Here we search for fainter and cool substellar members of the Praesepe by trawling our selection first for stars having no –band detection, and secondly for stars having no and –band detections.
4.3.1 Search for lower mass members detected in
To extend the cluster sequence to fainter objects, we searched for
Praesepe candidate members undetected in . We imposed similar
photometric and astrometric criteria as in Section
4.1 and 4.2 but without
detection in :
Candidates should not be detected in the –band
Candidates should have a proper motion within 3 of the cluster’s mean proper motion
Candidates should have 18 and 18.8 mag
Candidates should lie above the lines defined by (,) = (0.3,11.5) and (0.55,17.5), and by (,) = (0.55,17.5) and (1.45,21)
Candidates should lie above the lines defined by (,) = (0.65,11) and (0.75,18.25), and by (,) = (0.75,18.25) and (1.65,20)
Out of 17 objects selected based on astrometry and without detections in , 16 are selected based on the colour cut above (94.2 %). All 16 objects have an existing image in the –band in the UKIDSS GCS DR9 database. A list of these 16 objects is presented in Table 4.
| RA | DEC | cos | |||||||
|---|---|---|---|---|---|---|---|---|---|
| (h m s) | (∘ ’ ”) | [mag] | [mag] | [mag] | [mag] | [mag] | [mag] | [mas/yr] | [mas/yr] |
| 8:43:22.72 | +22:26:46.6 | – | 19.7340.123 | 18.1540.049 | 17.3770.062 | 16.6300.049 | 16.6410.029 | –34.55 5.91 | –16.26 5.91 |
| 8:45:07.82 | +21:17:29.2 | – | 19.6650.146 | 18.3580.082 | 17.7700.063 | 17.0410.058 | 17.0410.041 | –11.85 7.63 | –1.27 7.63 |
| 8:40:20.81 | +20:05:21.4 | – | 19.3100.076 | 18.2410.049 | 17.6370.072 | 16.9660.072 | 16.8980.033 | –43.70 5.78 | –9.07 5.78 |
| 8:37:15.19 | +20:09:51.2 | – | 19.3140.076 | 18.0970.047 | 17.2930.039 | 16.5530.049 | 16.5600.025 | –34.20 5.97 | 1.55 5.97 |
| 8:36:36.89 | +20:07:00.7 | – | 19.2690.072 | 18.2250.053 | 17.4330.044 | 16.7170.054 | 16.7270.029 | –29.03 6.38 | –8.23 6.38 |
| 8:38:03.30 | +19:47:15.0 | – | 19.8810.147 | 18.3330.068 | 17.4030.043 | 16.7200.049 | 16.7250.031 | –31.72 8.39 | 7.77 8.39 |
| 8:45:47.32 | +20:05:25.8 | – | 19.6860.117 | 18.5040.076 | 17.8480.069 | 17.5340.110 | 17.5700.068 | –13.04 8.35 | –27.58 8.35 |
| 8:34:22.13 | +19:54:38.7 | – | 20.0110.161 | 18.6230.087 | 18.1040.094 | 17.5600.124 | 17.5360.068 | –28.7710.31 | –34.8710.31 |
| 8:39:22.81 | +19:40:37.1 | – | 19.7430.113 | 18.4720.066 | 17.7510.071 | 17.0500.068 | 17.1230.039 | –42.70 6.02 | –2.48 6.02 |
| 8:39:01.37 | +20:35:04.1 | – | 19.7350.111 | 18.5460.053 | 17.8820.071 | 17.2860.070 | 17.2800.051 | –38.44 6.47 | –4.31 6.47 |
| 8:38:05.45 | +19:23:27.7 | – | 19.4840.095 | 18.2460.057 | 17.5100.045 | 16.9930.057 | 16.8820.032 | –39.10 8.34 | –14.61 8.34 |
| 8:47:35.00 | +17:49:53.0 | – | 19.9250.149 | 18.6020.099 | 17.8540.065 | 17.4090.085 | 17.5230.060 | –21.5911.13 | –14.8511.13 |
| 8:44:25.06 | +17:50:52.9 | – | 19.7430.124 | 18.4180.085 | 17.7990.063 | 16.8830.052 | 16.9300.035 | –28.17 6.92 | 8.40 6.92 |
| 8:54:12.81 | +18:26:11.7 | – | 19.8250.146 | 18.5670.075 | 17.9430.072 | 17.3770.099 | 17.3000.050 | –30.57 8.63 | –2.17 8.63 |
| 8:35:32.57 | +17:06:30.9 | – | 19.5620.105 | 18.4360.064 | 17.8520.073 | 17.1930.071 | 17.1600.047 | –14.73 6.72 | –18.78 6.72 |
| 8:33:42.21 | +18:47:10.3 | – | 19.7840.110 | 18.4270.066 | 17.6150.061 | 17.0150.064 | 17.0290.039 | –33.11 6.29 | –9.67 6.29 |
| 8:47:13.71 | +18:16:38.3 | – | – | 18.6930.119 | 17.6750.060 | 16.9540.064 | 16.9670.041 | –40.67 9.93 | 6.83 9.93 |
| 8:43:52.01a | +17:39:20.7a | – | – | 18.5520.091 | 17.8940.066 | 17.1780.063 | 17.2030.044 | –19.91 9.48 | –17.76 9.48 |
-
a
A visual inspection of the images suggests a possible companion.
4.3.2 Search for lower mass members detected in
We repeated the procedure described above looking for and non
detections. We applied the following criteria:
Candidates should not be detected in and –bands.
Candidates should have a proper motion within 3 of the cluster’s mean proper motion
Candidates should have 18 and 18.8 mag.
Candidates should lie above the lines defined by (,) = (0.65,11) and (0.75,18.25), and by (,) = (0.75,18.25) and (1.65,20).
Out of 71 objects selected based on astrometry and without detections in and , 17 are selected based on the colour cut above (23.9 %), but only 2 objects have an existing image in the and –band in the UKIDSS GCS DR9 database and remain undetected. These 2 objects are listed in Table 4.
4.4 Formal Membership probabilities
As a check on our photometric and astrometric selection, we calculate formal membership probabilities based on the analysis of Deacon & Hambly (2004). This uses a method similar to Sanders (1971) who first proposed calculating membership probabilities from proper motions and to Hambly et al. (1995) who built on this method. In this method the proper motion vector point diagram is rotated so that the cluster lies on the axis,
| (1) | |||
| (2) |
and the distribution of proper motions in this vector point diagram is defined as
| (4) |
where is the field star distribution defined as
| (5) |
Put simply the field population is modelled as an exponential in the y direction with scale length , a gaussian in the direction with mean and standard deviation and has normalisation . is the cluster distribution
| (6) |
The cluster is fitted with a bivariant gaussian with a single standard deviation () centred on and . The membership probability is defined as,
| (7) |
In Deacon & Hambly (2004) and Lodieu et al. (2007b) we allowed all our parameters to be freely fitted by a maximum likelihood method. However here we take the approach taken in Lodieu et al. (2012a) where the standard deviation of the cluster proper motions is fixed to be the proper motion measurement errors calculated in the appropriate magnitude bin.
The input list for the fitting procedure had the same source quality parameter cuts as listed in Section 2 with a single colour cut being applied,
&
&
The fitted parameters for each brightness range are shown in Table 5. Note that the cluster position appears to migrate in the last fitted bin. This is likely not due to any real variation in the cluster proper motion but to the fitting procedure becoming unreliable for the faintest objects.
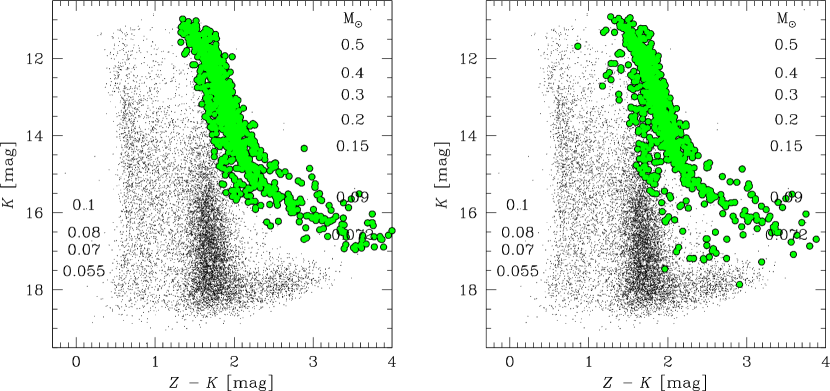
Table 6 contains a truncated list of high priority (0.5) candidates, the full list is available in electronic form. Using the probabilistic analysis, we obtained a total of 1,015 candidates with a membership probability higher than 50%, comparable to the 1,116 cluster candidates based on a photometric and astrometric selection. These objects are shown in Fig. 8 (right panel) in the CMD of vs. with all GCS point sources towards Praesepe.
| 12-13 | 272 | 0.821 | 3.42 | 2.03 | 35.63 | 13.97 | 17.01 | 4.60 |
|---|---|---|---|---|---|---|---|---|
| 13-14 | 537 | 0.743 | 3.40 | 2.55 | 35.24 | 16.67 | 16.95 | 7.73 |
| 14-15 | 866 | 0.778 | 3.41 | 2.31 | 35.04 | 14.89 | 16.64 | 6.41 |
| 15-16 | 1146 | 0.823 | 3.40 | 2.31 | 35.00 | 13.78 | 16.66 | 6.69 |
| 16-17 | 1251 | 0.844 | 3.48 | 2.79 | 35.02 | 11.46 | 15.42 | 6.81 |
| 17-18 | 906 | 0.936 | 3.67 | 2.34 | 35.08 | 11.24 | 14.11 | 6.50 |
| 18-19 | 587 | 0.936 | 4.37 | 3.75 | 34.93 | 11.44 | 14.33 | 5.96 |
| 19-20 | 316 | 0.850 | 6.04 | 2.51 | 34.16 | 11.88 | 16.05 | 6.19 |
| 20-21 | 241 | 0.863 | 9.02 | 3.17 | 32.83 | 16.02 | 18.09 | 4.58 |
| Name | Membership | |||||
|---|---|---|---|---|---|---|
| probability | ||||||
| UGCS J084344.72+211234.2 | 0.85 | 12.9960.001 | 12.7100.001 | 12.2030.001 | 11.6150.001 | 11.3600.001 |
| UGCS J084037.87+202017.9 | 0.92 | 12.8650.001 | 12.6140.001 | 12.1690.001 | 11.6070.001 | 11.3790.001 |
| … | … | … | … | … | … | … |
| UGCS J083814.20+194723.4 | 0.83 | 12.4640.002 | 12.1890.001 | 11.7440.001 | 11.5000.001 | 10.9420.001 |
| UGCS J083829.61+195145.0 | 0.82 | 12.1950.001 | 12.0100.001 | 11.6950.001 | 11.6170.001 | 10.9180.001 |
5 ESTIMATION OF CONTAMINATION
The number density of field objects in our final list of candidates as a function of mass was obtained in a similar way as in Jeffries et al. (2004). We obtained the radial profile of our cluster candidates in three mass ranges: above 0.4 M⊙, between 0.15 and 0.4 M⊙, and below 0.15 M⊙ (Fig. 7).
However, we must consider the first and last two datapoints with caution, as we are not complete in coverage within 1∘ and beyond 3∘. Therefore, we are not complete at the tidal radius of Praesepe at 3.5∘0.1∘ (11.50.3 pc; Kraus & Hillenbrand, 2007) and not within its core radius at 1.1∘0.1∘ (3.50.3 pc; Adams et al., 2002).
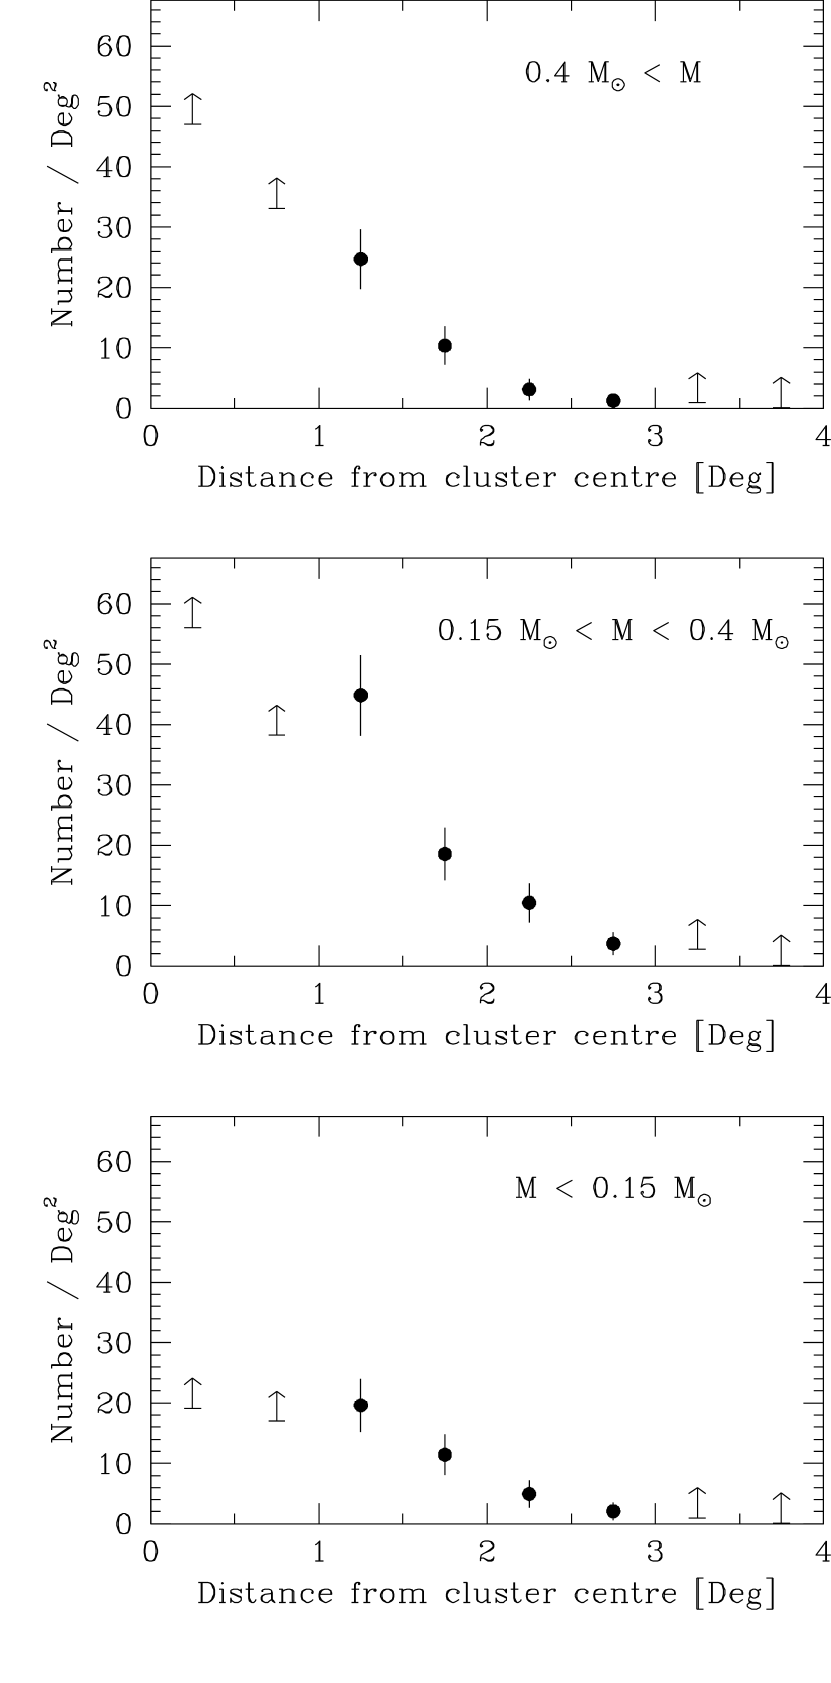
Therefore, we only use the bins between 2.5 and 3 deg. at each mass range to obtain an upper limit of contamination. This gives 1.27 objects per square degree for candidates with masses above 0.4 M⊙, 3.70 between 0.15 and 0.4 M⊙, and 2.08 objects per square degree for candidates with masses below 0.15 M⊙. Within 3 deg. from the cluster centre, this gives a contamination of 11.9 %, 9.8 % and 23.8,% for the same mass range respectively, or 18.7 % for the whole Praesepe sample.
These numbers appear quite large. We stress again that these are upper limits, since the coverage is not complete at the tidal radius of Praesepe and beyond. However, we can claim completeness in our cluster candidate list, and MF determination, better than 90 %. This is justified by the fact that our astrometric selection includes all objects within 3 of the cluster’s mean proper motion (completeness of 99%) and that the lines used in our photometric selection go at least 2 bluer from the cluster main sequence in all the CMD used for the photometric selection (completeness of 95.4%).
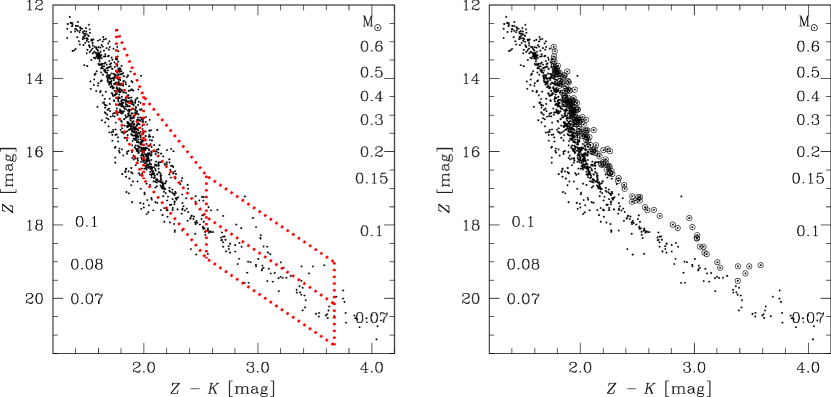
In Fig. 8 (left panel) we present the vs. CMD of all GCS point sources towards Praesepe (small dots) and the cluster candidates based on our astrometric and photometric selections (larger dots). We observe three structures in this diagram. The structure at 0.6 mag contains predominantly Galactic disk turn-off stars and the structure at 1.7 mag represents Galactic disk late-type and giant stars, while the structure at 2.5 mag is mostly composed of galaxies. This indicates that most of the contaminants of our cluster candidates with masses above 0.15 M⊙ would be Galactic disk late-type and giant stars, while most of the contaminants of candidates less massive than 0.15 M⊙ would include Galactic disk late-type and giant stars, but also unresolved galaxies.
6 DISCUSSION ON THE BINARY FREQUENCY
Here we investigate the multiplicity of low-mass and very low-mass Praesepe members using the photometry and colours from the GCS.
We selected binary candidates in the following way. We used the vs. CMD (Fig. 9) to define three mass ranges: between 0.45 and 0.2 M⊙, between 0.2 and 0.1 M⊙, and between 0.1 and 0.07 M⊙. These mass cuts were chosen as they can be compared directly with the binary fraction obtained from the hydrodynamical simulation by Bate (2012) (with the mass intervals of 0.5–0.2 M⊙, 0.2–0.1 M⊙ and 0.1–0.07 M⊙). At each transition of these mass ranges, we defined an area starting from 0.376 mag brighter to 1.13 mag fainter than the cluster sequences (single objects), and an area starting from 0.376 mag brighter to 1.5 mag brighter than the cluster main sequence (binary candidates). The binary fraction is the ratio between the number of objects in the brighter area, with the sum of both areas, for each mass range. Because of our 3 selection in astrometry and 2.5 bluer in photometry, we expect to be complete up to 97% in our selection between the saturation and detection limit, bracketing the mass intervals used for the binary fraction estimation.
Our binary candidates are presented in a vs. CMD shown in Fig. 9. The binary fraction we obtain is 25.83.7% in the mass range 0.07 to 0.1 M⊙, 19.63.8% in 0.1 to 0.2 M⊙, and 23.37.3% in 0.2 to 0.5 M⊙. We present these binary fractions in Table 7 and we compare them directly with those obtained from the hydrodynamical simulation by Bate (2012)222Table 2 from (Bate, 2012) presents the number of single objects, and also the number of binary, triple and quadruple systems per each mass range obtained from their hydrodynamical simulation. In our analysis, we only consider the binary system., and also the photometric determination by Pinfield et al. (2003).
We observe a similar binary fraction to Bate (2012) between 0.07–0.1 M⊙ (within 1, where is the error on our measurements), a disagreement of only 1.5 for the binary fraction in the mass range 0.2–0.45 M⊙, but a significantly lower binary fraction by more than 3 for the mass range 0.1–0.2 M⊙. However, we note that the binary fraction in Fig. 7 of Bate (2012) is also higher compared to previous observations of the binary fraction for field dwarfs below 0.2 M⊙ (Basri & Reiners, 2006; Close et al., 2003).
Our binary fraction is lower by 1.8 than the value of Pinfield et al. (2003) for masses in the range of 0.35 to 0.6 M⊙ (0.2 to 0.45 M⊙ for our work). On the other hand, their binary fraction for lower masses is significantly higher by a factor of two than our values (more than 4 for the mass range 0.07 to 0.1 M⊙, and more than 8 for the mass range 0.1 to 0.2 M⊙) and are also significantly higher than those of Bate (2012) (considering the error bars of Pinfield et al., 2003). We attribute this overestimation of binary frequency to the selection method used by Pinfield et al. (2003). These authors used a method similar to the one used here, i.e. by defining an area above the cluster sequences corresponding to the binary population. However, they used a cluster sequence constructed both from isochrones and empirical data. The resulting assumed cluster sequence appears bluer than the observed cluster sequence by about 0.2 mag at 14 mag (see Fig. 3 of Pinfield et al., 2003). This would give a fainter equal–mass binary sequence, and therefore, overestimate the number of binaries and the binary fraction.
Using the probabilistic analysis presented in Section 4.4, we obtain similar binary fractions using objects with a membership probability higher than 50%, i.e. 27.9% in the mass range 0.07 to 0.1 M⊙, 18.0% in 0.1 to 0.2 M⊙, 26.6% in 0.2 to 0.5 M⊙, and 23.7% in the whole mass range from 0.07 to 0.5 M⊙.
| Mass range (M⊙) | Single | Binary | % | Bate |
|---|---|---|---|---|
| 0.07 – 0.1 | 73(44) | 22(17) | 23.25.6(27.9) | 27.311.6 |
| 0.1 – 0.2 | 225(201) | 55(44) | 19.63.0(18.0) | 29.25.3 |
| 0.2 – 0.45 | 279(256) | 96(91) | 25.63.0(26.2) | 32.14.7a |
| 0.07 – 0.45 | 588(538) | 176(167) | 23.12.0(23.3) | 29.22.0 |
| Pinfield et al. | ||||
| 0.09 – 0.11 | – | – | 47 | – |
| 0.2 – 0.35 | – | – | 446 | – |
| 0.35 – 0.6 | – | – | 31 | – |
-
a
Bate (2012) used the interval 0.2 to 0.5 M⊙, but the values presented here are for the interval 0.2 to 0.45 M⊙ (Bate 2012, private communication).
7 VARIABILITY AT 600 MYR
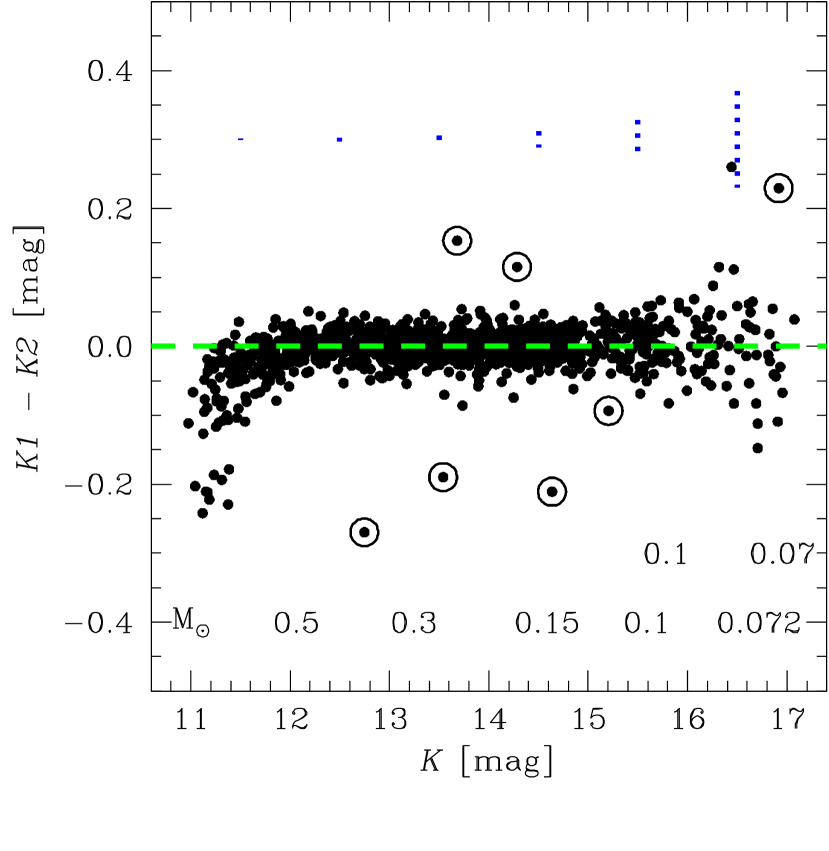
Here we discuss the variability of the Praesepe member candidates using the two epochs provided by the GCS in the –band ( being the first epoch, the second).
In Fig. 10 we present the difference in the magnitudes (i.e. –) as a function of the magnitude (average of and ) for all the photometric and astrometric candidates. The brightening observed at 12 mag is due to the difference in depth between the first and second epoch, which causes a decrease of 0.5 mag in the completeness limit, but also in the saturation limit333The exposure times have been doubled for the second epoch with relaxed constraints on the seeing requirement and weather conditions.. Therefore, objects with 12 mag are excluded from our variability analysis.
We selected as variable all objects with – larger than 3, where is the standard deviation of – around the magnitude of the object. Nine objects are identified as variable candidates. We looked at the UKIDSS GCS DR9 images and give our comments in Table 8. One source has its photometry affected by the presence of a nearby object, while one other might show spurious variability due to poorer image quality in one of the –band images. There are seven remaining objects which are likely to be variable objects in Praesepe, which is 0.63% of our member candidates (black circles with dots in Fig. 10). One of the variable candidates, UGCS J084353.41+210126.3, is in the substellar regime with an estimated mass of 0.0640.013 M⊙.
Using the probabilistic analysis, we also obtain 6 objects with – larger than 3 (0.59% of the cluster candidate having a membership probability higher than 50%, including 3 from the variable candidates sample from the astrometric and photometric selection).
| RA | DEC | Comments | ||
|---|---|---|---|---|
| (h m s) | (∘ ’ ”) | [mag] | [mag] | |
| 8:48:45.42 | +22:23:37.2 | 14.6360.012 | -0.211 | – |
| 8:49:10.96 | +22:12:13.2 | 13.6810.006 | 0.153 | – |
| 8:38:07.18 | +21:16:36.8 | 14.2840.006 | 0.115 | – |
| 8:43:53.41 | +21:01:26.3 | 16.9180.066 | 0.229 | – |
| 8:36:45.00 | +20:08:45.8 | 13.7340.005 | -0.086 | Faint object observed nearby. Possible companion. |
| 8:50:49.83 | +19:48:36.5 | 12.7470.002 | -0.270 | – |
| 8:41:24.84 | +19:57:27.0 | 15.2050.018 | -0.093 | – |
| 8:35:13.24 | +17:02:06.5 | 13.5400.004 | -0.190 | – |
| 8:41:50.08 | +19:06:18.3 | 16.4430.052 | 0.260 | White dots on the object is images (i.e. bad pixels or cosmics). |
8 LUMINOSITY AND MASS FUNCTION
8.1 Isochrone of Praesepe
We derived a NextGen isochrone using a grainless atmosphere and evolutionary tracks (Baraffe et al., 1998; Hauschildt et al., 1999) and a DUSTY isochrone using a dusty atmosphere and evolutionary tracks (Chabrier et al., 2000; Allard et al., 2001). We used the known astrophysical parameters of Praesepe (age, distance) presented in Section 1 (and assumed solar metallicity as well as negligible reddening).
The models and assumptions provide us with a prediction of , the spectral energy distribution (SED) received at the Earth (in erg cm-2 s-1 Å-1) from the source. We need to convert these spectra to magnitudes in the WFCAM filters . Denoting as the (known) total transmission function of filter (including the CCD quantum efficiency and assuming telescope and instrumental throughput is flat), then the flux measured in the filter is
| (8) |
The corresponding magnitude in the Johnson photometric system is given by
| (9) |
where is a constant (zero point) that remains to be determined in order to put the model-predicted magnitude onto the Johnson system. We determine this constant for each of the UKIDSS –bands in the standard way, namely by requiring that the spectrum of Vega produce a magnitude, , of 0.03 mag in and zero for all colours in all bands. Using the Vega spectrum from Colina et al. (1996), the zero-point constants we obtain for the UKIDSS –bands are 22.6587 mag, 23.1075 mag, 23.8080 mag, 24.8365 mag and 26.0014 mag. Applying the two equations above to the model spectra produces a theoretical isochrone in color-magnitude space.
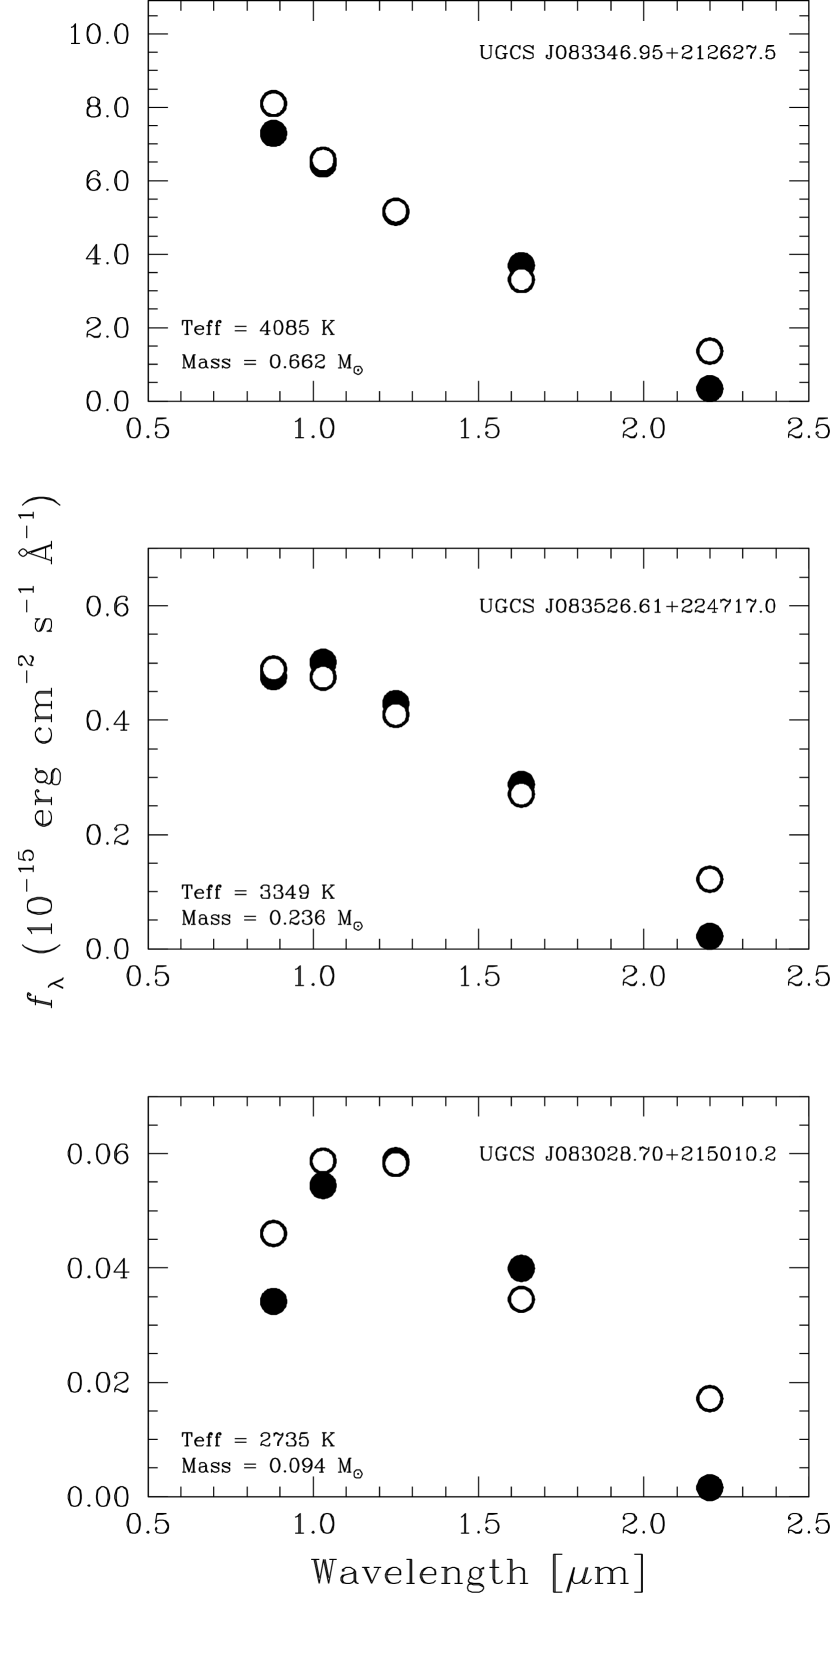
Unlike most of the open cluster surveys that use one magnitude or one colour to estimate masses and effective temperatures (), here we take full advantages of the five bands available (i.e. ) by determining the masses and for each object from its SED as in Boudreault & Bailer-Jones (2009) (using a least squares fit between the measured SED and the model SED from the isochrone) with normalisation at 444We looked at the minimized sum of the square of the residuals as a function of the effective temperature, and there is no general trend for a better fit to higher or lower temperature.. See Fig. 11 for an illustrative example of the resulting fitting for three cluster candidates at three different masses.
The errors on the derived physical parameters (i.e. on mass and ) take into account the errors on the derived age of the cluster and the errors on the fitting.
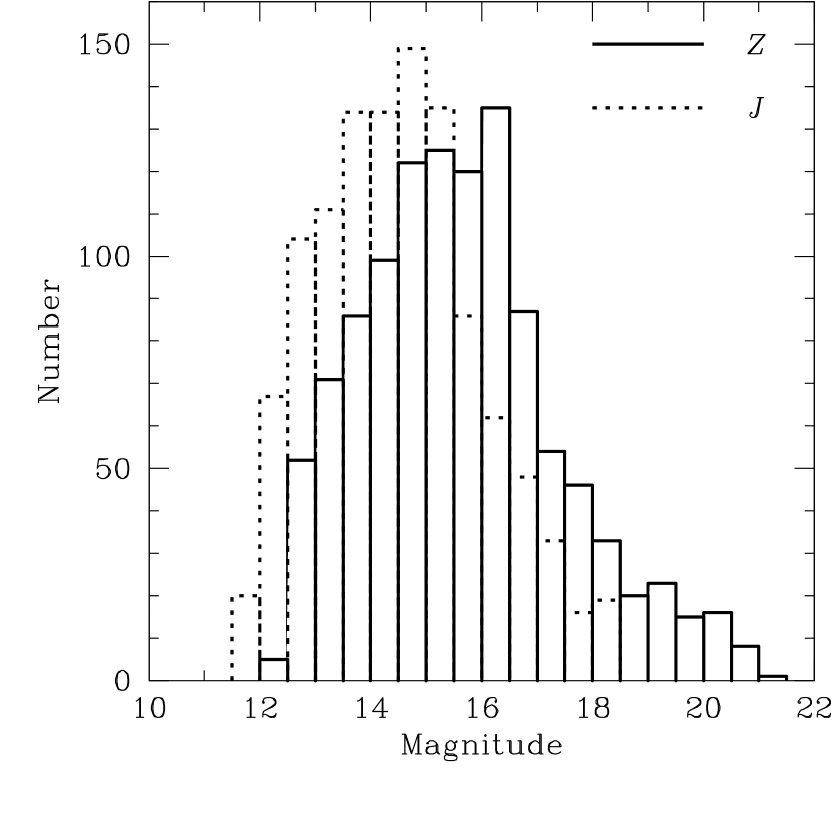
8.2 The cluster luminosity function
In Fig. 12 we present the LF of Praesepe using the and –band photometry of our final list of candidates presented in Section 4. Magnitude bins are 0.5 mag wide for both LFs. We observe a rise in the LF, a turnover (at 16 mag and 15 mag), followed by a decrease to lower magnitudes. The turnover in the –band LF is at one magnitude brighter than observed with the cluster candidates from Boudreault et al. (2010), based on their NextGen pure photometric selection.
The overall shape of the LF, including the position of the turnover, remain unchanged with the binning (binning moved by 0.25 mag, bin size increased or decreased by a factor of 2).
8.3 The cluster mass function
The MF, (), is generally defined as the number of stars per cubic parsec in the logarithmic mass interval to (Salpeter, 1955). Here, we define the MF as the total number of objects in each bin per square degree. Since we do not make any corrections for binaries we compute here a system MF. This decision was taken considering that the binary fraction we have estimated in Section 6 does not cover the whole mass range of the MF (and therefore, only a few mass bins could be corrected), and also considering that all other MFs used in our analysis in Section 8.3 are also system MFs. However, a MF with the mass interval 0.45–0.07 corrected for binarity is presented at the end of this section.
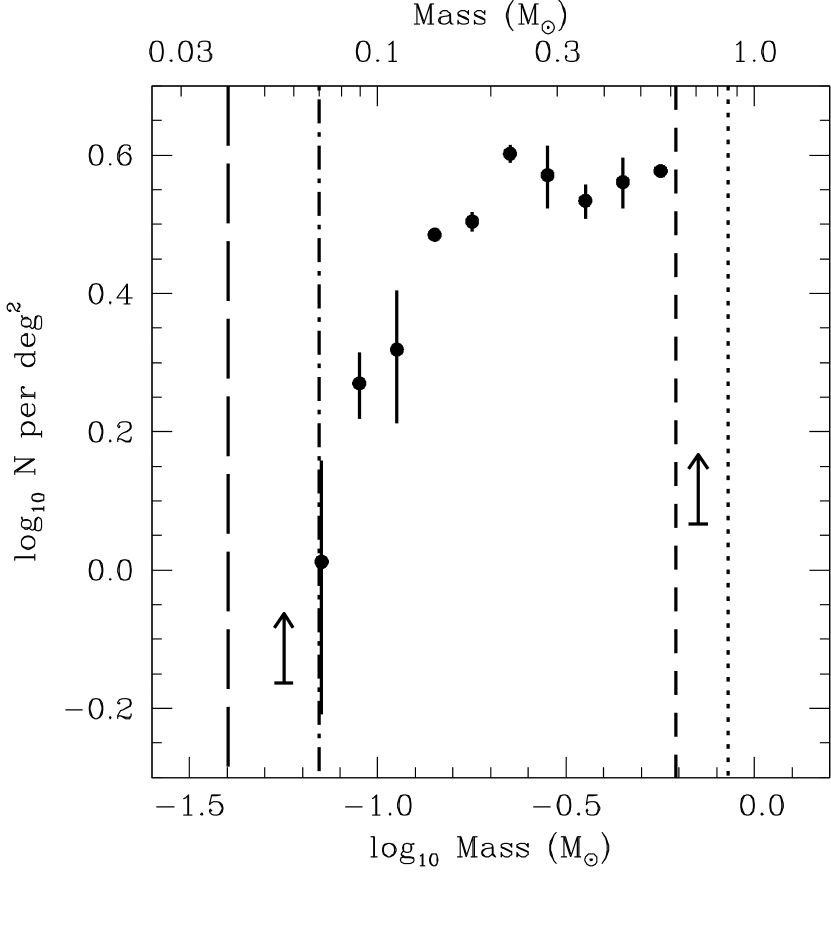
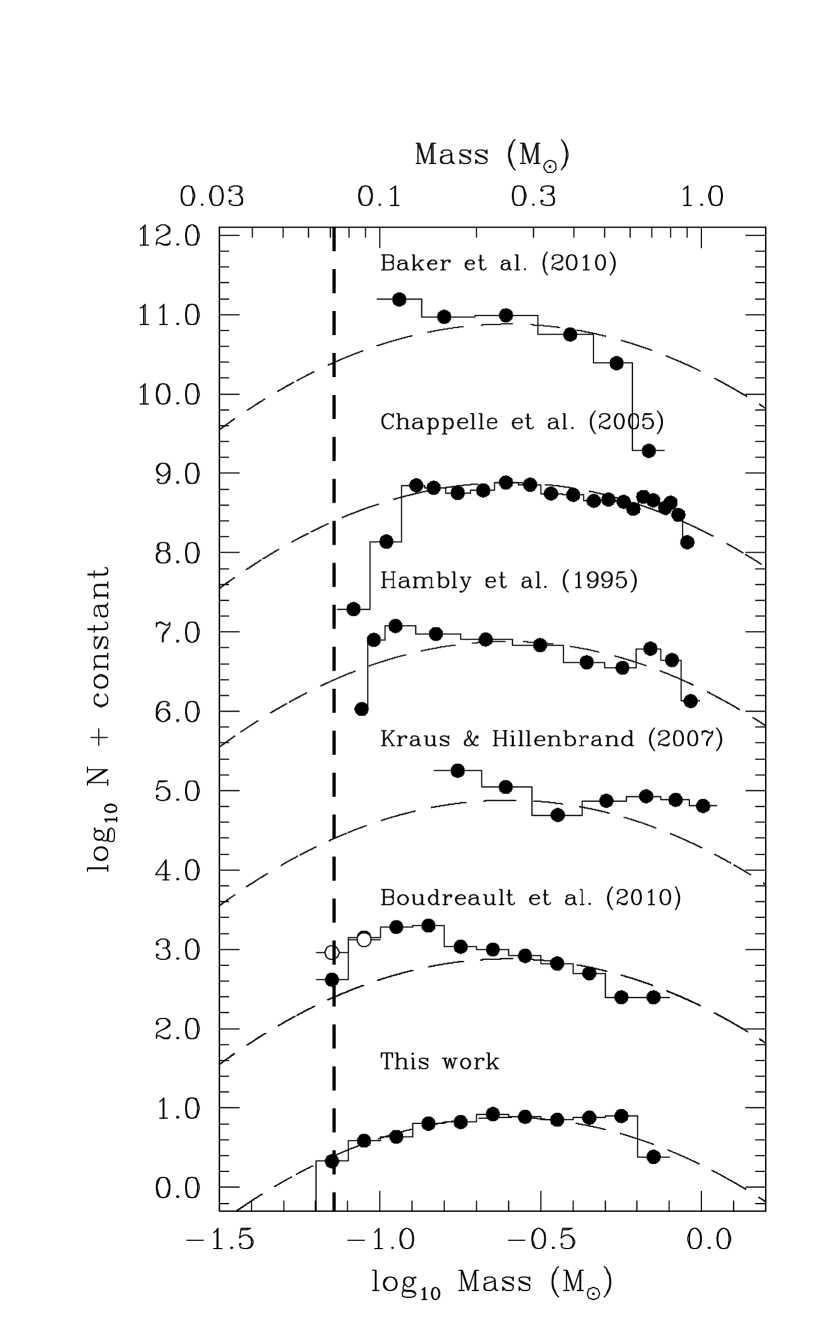
We present the MF of Praesepe in Fig. 13, and the number of objects in each mass bin in Tab. 9. We observe that the MF has a maximum at 0.6 and then decreases to lower masses. We note also that our determination of the MF is unique in the sense that all previous determinations of the MF of Praesepe show an increase from 1 to 0.1 (Fig.14). Previous studies include surveys based on photometry (e.g. Chappelle et al., 2005; Boudreault et al., 2010) and astrometry (e.g. Hambly et al., 1995; Kraus & Hillenbrand, 2007).
| N | N | ||
|---|---|---|---|
| (M⊙) | (M⊙) | (pc-3) | (pc-3) |
| 0.056 | -1.25 | 2a | -0.163a |
| 0.071 | -1.15 | 3715 | 0.012 |
| 0.089 | -1.05 | 677 | 0.270 |
| 0.112 | -0.95 | 7516 | 0.319 |
| 0.142 | -0.85 | 1102 | 0.4850.010 |
| 0.178 | -0.75 | 1154 | 0.5040.014 |
| 0.224 | -0.65 | 1444 | 0.6020.013 |
| 0.282 | -0.55 | 13414 | 0.571 |
| 0.356 | -0.45 | 1237 | 0.534 |
| 0.448 | -0.35 | 13111 | 0.561 |
| 0.564 | -0.25 | 1361 | 0.577 |
| 0.710 | -0.15 | 42a | 0.067a |
-
a
Lower limits.
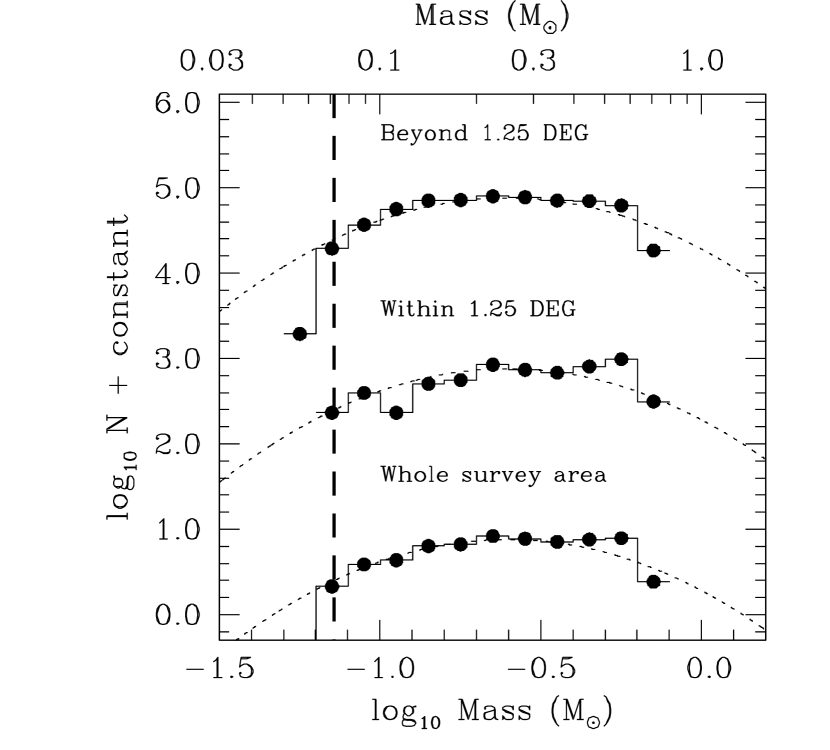
One possible explanation is the coverage of our survey, i.e. the lack of completeness in the core (i.e. within 1.1∘ from the cluster centre). However, considering that the most massive objects should be in the cluster’s core, a full coverage would rather increase the observed slope in our MF of Praesepe. To rule out this possibility, we compared the MF of Praesepe within 1.25∘, and beyond 1.25∘ (Fig. 15), where 1.25∘ corresponds to the half-mass radius of Praesepe (Adams et al., 2002). We can see that in both regions of the cluster, the MF decreases towards lower masses.
Incompleteness can also be ruled out as an explanation for the discrepancy observed. As it can be seen in Fig. 13, the completeness limit and the saturation limit are affecting the lowest mass bin and the highest mass bin only. The incompleteness, alone, cannot explain the overall shape of the MF.
One could question the mass determination or the selection methods as a possible source of discrepancy. However, considering that we use the same mass determination method as from Boudreault et al. (2010), and we use a similar filter set and a similar selection method as in Baker et al. (2010)555(Baker et al., 2010) combined the UKIDSS DR6 with 2MASS and the Sloan Digital Sky Survey., such an explanation seems unlikely.
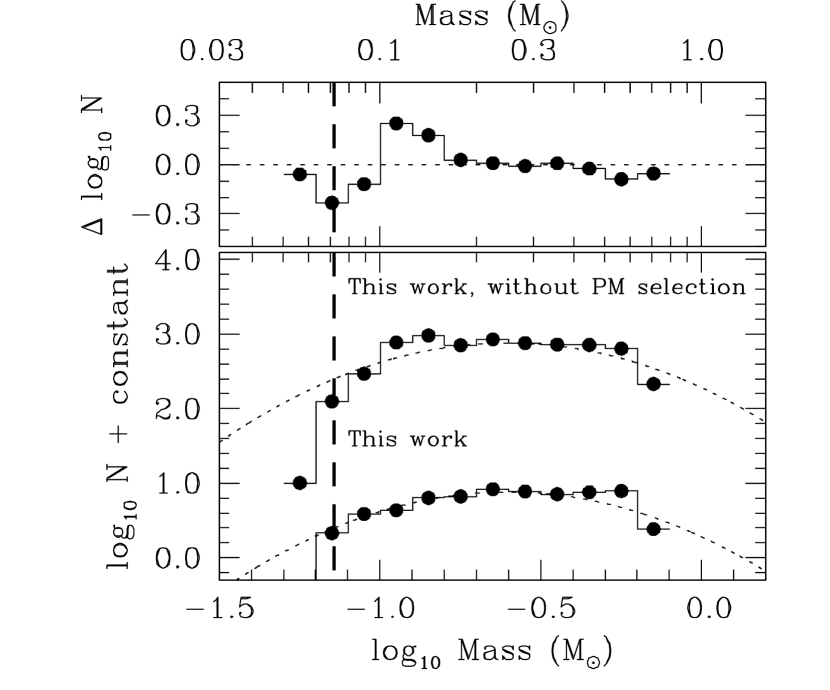
However, we emphasis that we can reproduce the shape of previous determinations of the MF if we remove the selection based on astrometry. This is presented in Fig. 16, where we show both our determination of the MF of the Praesepe, with and without the astrometric selection. We can see that the difference between the two MFs goes from 0.1 dex at 0.5 to 0.3 dex at 0.1 . The MF we obtain for the Praesepe without astrometric selection is also very similar to the one obtained by Chappelle et al. (2005), with an increase of the MF of 0.2 dex from 0.5 down to 0.1 .
We therefore conclude that our determination of the Praesepe MF is different to previous work due to our selection based on astrometry and photometry, which includes five filters covering the SED from 0.85 to 2.3 m. Surveys based only on photometry would appear to suffer from contamination by field M dwarfs and background red giants (e.g. Chappelle et al., 2005; Boudreault et al., 2010).
As for the work of Kraus & Hillenbrand (2007), the overall shape of the MF presents a rise of 0.4 dex from 1 down to 0.2 . However, one needs to be careful with the lowest bin because this survey is 70% complete at M5 dwarfs (corresponding to 0.15–0.2 in Praesepe).
It could be suggested that a larger spatial coverage should in principle detect a larger fraction of low-mass stars due to mass segregation. However, our spatial coverage is larger than the survey of Baker et al. (2010) and Hambly et al. (1995), and we obtain a larger ratio of the number of intermediate-mass stars to lower-mass stars. Mass segregation does not appear to be the cause of the discrepancy in the MF in the low-mass star regime.
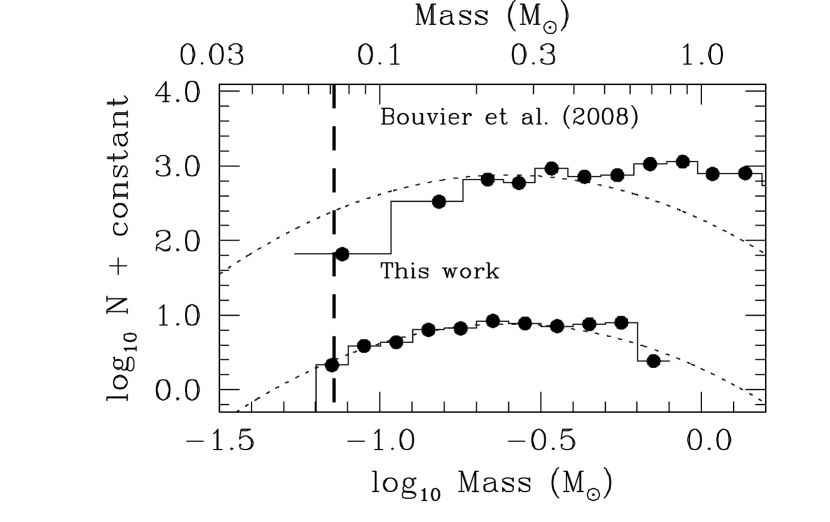
We compare our determination of the MF of Praesepe with the Hyades open cluster in Fig. 17, which has a similar age of 600 Myr (Bouvier et al., 2008). We see now that both clusters present a decreasing MF to lower masses, unlike what was previously reported (Boudreault et al., 2010). However, the Praesepe remains different to the Hyades MF, with a decreasing MF of only 0.2 dex from 0.6 down to 0.1 , compared to 1 dex for the Hyades.
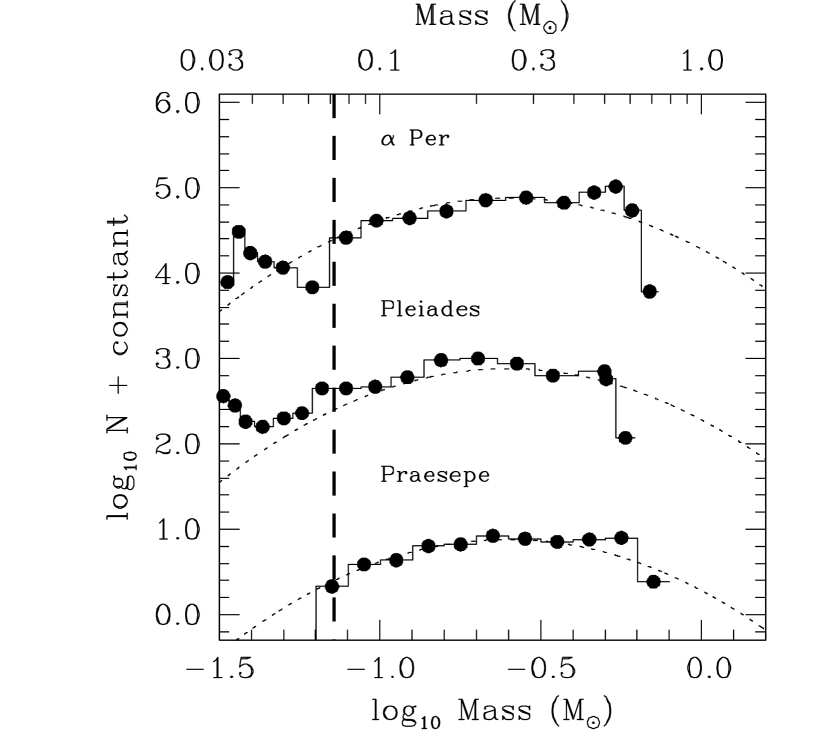
In Fig. 18, we present the MF of Per (855 Myr, Lodieu et al., 2012b) and the Pleiades (1258 Myr, Lodieu et al., 2012a) open clusters, compared with the MF of Praesepe. The Per and Pleiades MFs are obtained using the sames survey and selection procedure as our current work on the Praesepe, i.e. using the photometry and astrometric data from UKIDSS GCS DR9. We observe that the MF of Praesepe in the mass range of 0.072–0.6 is more similar to the MF of Per than the MF of the Pleiades. This is surprising as dynamical evolution would give a MF with a shape more similar or in between to the shape of the MF of the Pleiades and the Hyades, which are clusters with respectively ages of 125 (Stauffer et al., 1998) and 600 Myr. These values are closer to the age of Praesepe ( Myr; Fossati et al., 2008), compared to Per (855 Myr, Barrado y Navascués et al., 2004).
Finally, we present in Fig. 19 the MF of Praesepe from this work corrected for binarity (i.e. between 0.45 and 0.07 ). For this, we assume that all binary candidates in Fig. 9 have a mass ratio of 1.0 for each object. (With the photometry alone, it is not possible to make a reliable estimation of what would be the binary mass ratio.) The shape of the MF obtained is similar to the system MF, i.e. a decrease from 0.6 down to 0.1 . However, we stress that this single star MF should be used with caution, considering our assumption about the binary mass ratio and the fact that binary candidates are not known for the whole mass range of our system MF.

9 SUMMARY AND CONCLUSIONS
In this paper we presented the results of a wide field, near–infrared study of the Praesepe cluster using the DR9 of the UKIRT Infrared Deep Sky Survey Galactic Clusters Survey. We performed an astrometric and photometric selection of 1,116 cluster candidates out of the 218,141 point sources detected towards Praesepe.
Possible sources of contamination include Galactic disk late-type and giant stars and unresolved galaxies. We estimate a contamination of 11.9 % above 0.4 M⊙, 9.8 % in the mass range 0.15–0.4 M⊙, and 23.8 % below 0.15 M⊙.
We investigated the binary frequency of Praesepe using the photometry and colours from our cluster candidates. We observe a binary fraction similar to the simulation of Bate (2012) between 0.07–0.1 M⊙, 1.5 difference in the 0.2–0.45 M⊙ mass interval, and significantly lower by more than 3 for the mass range 0.1–0.2 M⊙. On the other hand, the binary fraction from Pinfield et al. (2003) are higher than our values and those of Bate (2012). However, we note that two other works focusing on field low-mass stars have also derived binary fractions lower than Bate (2012).
We also studied the variability of the Praesepe candidates using the two –band epochs provided by the GCS. We identified seven candidate variables, including one in the substellar regime.
We derived the luminosity function of Praesepe in and –band here. We observed that the peak of the –band luminosity function is one magnitude brighter than the one reported by Boudreault et al. (2010).
Finally, we determined the mass function of Praesepe, which differs from previous studies: while previous MFs showed an increase from 0.6 to 0.1 M⊙, our MF shows a decrease. We looked at the MF of Praesepe at two different regions of the cluster, i.e. within and beyond 1.25∘, and we observed that both regions show an MF which decreases to lower masses. We compared our MF of Praesepe in the mass range 0.072–0.6 M⊙ with the ones of the Hyades, the Pleiades and Per. We concluded that our MF of Praesepe is most similar to the MF of Per although they are respectively of 85 and 600 Myr. Even though of similar age, the Praesepe appears different to the Hyades, with a decrease in the MF of only 0.2 dex from 0.6 down to 0.1 , compared to 1 dex for the Hyades.
ACKNOWLEDGMENTS
SB and NL are funded by national program AYA2010-19136 (Principal Investigator is NL) funded by the Spanish ministry of science and innovation. NL is a Ramón y Cajal fellow at the IAC (program number 08-303-01-02). This work is based in part on data obtained as part of the UKIRT Infrared Deep Sky Survey (UKIDSS). The UKIDSS project is defined in Lawrence et al. (2007). UKIDSS uses the UKIRT Wide Field Camera (WFCAM; Casali et al., 2007). The photometric system is described in Hewett et al. (2006), and the calibration is described in Hodgkin et al. (2009). The pipeline processing and science archive are described in Irwin et al. (in prep) and Hambly et al. (2008), respectively. We thank our colleagues at the UK Astronomy Technology Centre, the Joint Astronomy Centre in Hawaii, the Cambridge Astronomical Survey and Edinburgh Wide Field Astronomy Units for building and operating WFCAM and its associated data flow system. This research has made use of the Simbad database, operated at the Centre de Données Astronomiques de Strasbourg (CDS), and of NASA’s Astrophysics Data System Bibliographic Services (ADS).
References
- Adams et al. (2002) Adams, J. D., Stauffer, J. R., Skrutskie, M. F., Monet, D. G., Portegies Zwart, S. F.; Janes, K. A. & Beichman, Charles A. 2002, AJ, 124, 1570
- Allard et al. (2001) Allard, F., Hauschildt, P. H., Alexander, D. R., Tamanai, A. & Schweitzer, A., 2001, ApJ, 556, 357
- Baker et al. (2010) Baker, D. E. A., Jameson, R. F., Casewell, S. L., Lodieu, N. & Hambly, N., 2010, MNRAS, 408, 2457
- Baraffe et al. (1998) Baraffe, I., Chabrier, G., Allard, F. & Hauschildt, P. H., 1998, A&A, 337, 403
- Barrado y Navascués et al. (2004) Barrado y Navascués, D., Stauffer, J. R. & Jayawardhana, R., 2004, ApJ, 614, 386
- Basri & Reiners (2006) Basri, G. & Reiners, A., 2006, AJ, 132, 663
- Bastian et al. (2010) Bastian, N., Covey, K. R.; Meyer, M. R., 2010, ARA&A, 48, 339
- Bate (2012) Bate, M. R., 2011, MNRAS, 419, 3115
- Béjar et al. (2011) Béjar, V. J. S., Zapatero Osorio, M. R., Rebolo, R. Caballero, J. A., Barrado, D., Martín, E. L., Mundt, R & Bailer-Jones, C. A. L., 2011, ApJ, 743, 64
- Bihain et al. (2009) Bihain, G., et al., 2009, A&A, 506, 1169
- Boudreault et al. (2010) Boudreault, S., Bailer-Jones, C. A. L., Goldman, B., Henning, T. & Caballero, J. A., 2010, A&A, 510, 27
- Boudreault & Bailer-Jones (2009) Boudreault, S. & Bailer-Jones, C. A. L., 2009, ApJ, 706, 1484
- Bouvier et al. (2008) Bouvier, J., et al., 2008, A&A, 481, 661
- Casali et al. (2007) Casali, M., et al., 2007, A&A, 467, 777
- Casewell et al. (2007) Casewell, S. L., Dobbie, P. D., Hodgkin, S. T., Moraux, E., Jameson, R. F., Hambly, N. C., Irwin, J. & Lodieu, N., 2007, MNRAS, 378, 1131
- Close et al. (2003) Close, L. M., Siegler, N., Freed, M. & Biller, B., 2003, ApJ, 587, 407
- Chabrier et al. (2000) Chabrier, G., Baraffe, I., Allard, F. & Hauschildt, P., 2000, ApJ, 542, 464
- Chabrier (2003) Chabrier, G., 2003, PASP, 115, 763
- Chabrier et al. (2005) Chabrier, G., 2005, ASSL, 327, 41
- Chappelle et al. (2005) Chappelle, R. J., Pinfield, D. J., Steele, I. A., Dobbie, P. D. & Magazzù, A., 2005, MNRAS, 361, 1323
- Colina et al. (1996) Colina, L., Bohlin, R., & Castelli, F. 1996, Instrument Science Report CAL/SCS, 8, 1
- Collins & Hambly (2012) Collins, R. S. & Hambly, N. C., 2012, In: Astronomical Data Analysis Software and Systems XXI, Ballester, P. and Egret, D. (eds.), Astronomical Society of the Pacific Conference Series, in press
- Covey et al. (2011) Covey, K. R., Bastian, N. & Meyer, M. R., 2011, to appear in the proceedings of Stellar Clusters & Associations Gaia Workshop ( preprint arXiv:1107.4571 )
- Cutri et al. (2003) Cutri, R. M., et al., 2003, 2MASS All Sky Catalog of point sources., The IRSA 2MASS All-Sky Point Source Catalog, NASA/IPAC Infrared Science Archive. http://irsa.ipac.caltech.edu/applications/Gator/
- Deacon & Hambly (2004) Deacon, N.R. & Hambly, N.C., 2004, A&A, 416, 125
- Dobbie et al. (2010) Dobbie, P. D., Lodieu, N. & Sharp, R. G., 2010, MNRAS, 409, 1002
- Fossati et al. (2008) Fossati, L., Bagnulo, S., Landstreet, J., Wade, G., Kochukhov, O., Monier, R., Weiss, W. & Gebran, M., 2008, A&A, 483, 891
- Friel & Boesgaard (1992) Friel, E. D. & Boesgaard, A. M., 1992, ApJ, 387, 170
- González-García et al. (2006) González-García, B. M., Zapatero Osorio, M. R., Béjar, V. J. S., Bihain, G., Barrado Y Navascués, D., Caballero, J. A., Morales-Calderón, M., 2006, A&A, 460, 799
- Hambly et al. (2008) Hambly, N. C., et al., 2008, MNRAS, 384, 637
- Hambly et al. (1995) Hambly, N. C., Steele, I. A., Hawkins, M. R. S. & Jameson, R. F., 1995, A&AS, 109, 29
- Hauschildt et al. (1999) Hauschildt, P. H., Allard, F. & Baron, E., 1999, ApJ, 512, 377
- Hewett et al. (2006) Hewett, P. C., Warren, S. J., Leggett, S. K. & Hodgkin, S. T., 2006, MNRAS, 367, 454
- Hodgkin et al. (2009) Hodgkin, S. T., Irwin, M. J., Hewett, P. C. & Warren, S. J., 2009, MNRAS, 394, 675
- Hodgkin et al. (1999) Hodgkin, S. T., Pinfield, D. J., Jameson, R. F., Steele, I. A., Cossburn, M. R. & Hambly, N. C., 1999, MNRAS, 310, 87
- Jeffries et al. (2004) Jeffries, R. D., Naylor, T., Devey, C. R. & Totten, E. J., 2004, MNRAS, 351, 1401
- Jones & Cudworth (1983) Jones, B. F. & Cudworth, K., 1983, AJ, 88, 215
- Kraus & Hillenbrand (2007) Kraus, A. L. & Hillenbrand, L. A., 2007, AJ, 134, 2340
- Kroupa (2002) Kroupa, P., 2002, Science, 295, 82
- Kumar & Schmeja (2007) Kumar, M. S. N. & Schmeja, S., 2007, A&A, 471, 33
- Lawrence et al. (2007) Lawrence, A., et al., 2007, MNRAS, 379, 1599
- van Leeuwen (2009) van Leeuwen, F. 2009, A&A, 497, 209
- Leigh et al. (2012) Leigh, N., Umbreit, S., Sills, A., Knigge, C., de Marchi, G., Glebbeek, E. & Sarajedini, A., 2012, MNRAS, 422, 1592
- Lodieu et al. (2012a) Lodieu, N., Deacon, N. R. & Hambly, N. C., 2012a, MNRAS in press - preprint arXiv:1204.2659v1
- Lodieu et al. (2012b) Lodieu, N., Deacon, N. R., Hambly, N. C. & Boudreault, S., 2012b in prep
- Lodieu et al. (2009.) Lodieu, N., Dobbie, P. D., Deacon, N. R., Venemans, B. P. & Durant, M., 2009, MNRAS, 395, 1631
- Lodieu et al. (2008) Lodieu, N., Hambly, N. C., Jameson, R. F. & Hodgkin, S. T., 2008, MNRAS, 383, 1385
- Lodieu et al. (2007a) Lodieu, N., Hambly, N. C., Jameson, R. F., Hodgkin, S. T., Carraro, G. & Kendall, T. R., 2007, MNRAS, 374, 372
- Lodieu et al. (2007b) Lodieu, N., Dobbie, P.D., Deacon, N.R., Hodgkin, S.T., Hambly, N.C., Jameson, R.F., MNRAS, 380, 2, 712
- Lucas et al. (2010) Lucas, P. W., et al., 2010, MNRAS, 408, 56
- Luhman et al. (2003) Luhman, K. L., Stauffer, J. R., Muench, A. A., Rieke, G. H., Lada, E. A., Bouvier, J. & Lada, C. J., 2003, ApJL, 593, 1093
- Marks & Kroupa (2012) Marks, M & Kroupa, P., 2012, MNRAS, in press - preprint arXiv:1205.1508v1
- Moraux et al. (2007) Moraux, E., Bouvier, J., Stauffer, J. R., Barrado y Navascués, D. & Cuillandre, J.-C., 2007, A&A, 471, 499
- Myers et al. (2011) Myers, A. T., Krumholz, M. R., Klein, R. I. & McKee, C. F., 2011, ApJ, 735, 49
- Pace et al. (2008) Pace, G., Pasquini, L. & Fran ois, P., 2008, A&A, 489, 403
- Peña Ramírez et al. (2008) Pace, Peña Ramírez, K., Zapatero Osorio, M. R., Béjar, V. J. S., Rebolo, R. & Bihain, G., 2011, A&A, 532, 42
- Pinfield et al. (2003) Pinfield, D. J., Dobbie, P. D., Jameson, R. F., Steele, I. A., Jones, H. R. A. & Katsiyannis, A. C., 2003, MNRAS, 342, 1241
- Platais et al. (2007) Platais, I., et al., 2007, A&A, 461, 509
- Quanz et al. (2010) Quanz, S. P., Goldman, B., Henning, T., Brandner, W., Burrows, A. & Hofstetter, L. W., 2010, ApJ, 708, 770
- Salpeter (1955) Salpeter, E. E. 1955, ApJ, 121, 161
- Sanders (1971) Sanders, W.L., 1971, A&A, 14, 226
- Scholz & Eislöffel (2004) Scholz, A. & Eislöffel, J., 2004, A&A, 419, 249
- Skrutskie et al. (2006) Skrutskie, M. F., et al., 2006, AJ, 131, 1163
- Stauffer et al. (1998) Stauffer, J. R., Schultz, G. & Kirkpatrick, J. D., 1998, ApJ, 499L, 199
- Taylor (2006) Taylor, B. J. 2006, AJ, 132, 2453
- Wang et al. (2011) Wang, W., Boudreault, S., Goldman, B., Henning, Th., Caballero, J. A. & Bailer-Jones, C. A. L., 2011, A&A, 531, 164
- de Wit, et al. (2006) de Wit, W. J., et al., 2006, A&A, 448, 189
- White & Basri (2003) White, R. J. & Basri, G., 2003, ApJ, 582, 1109
- Zapatero Osorio et al. (2008) Zapatero Osorio, M. R., et al., 2008, A&A, 477, 895