Contracting and Erupting Components of Sigmoidal Active Regions
Abstract
It is recently noted that solar eruptions can be associated with the contraction of coronal loops that are not involved in magnetic reconnection processes. In this paper, we investigate five coronal eruptions originating from four sigmoidal active regions, using high-cadence, high-resolution narrowband EUV images obtained by the Solar Dynamic Observatory (SDO). The magnitudes of the flares associated with the eruptions range from the GOES-class B to X. Owing to the high-sensitivity and broad temperature coverage of the Atmospheric Imaging Assembly (AIA) onboard SDO, we are able to identify both the contracting and erupting components of the eruptions: the former is observed in cold AIA channels as the contracting coronal loops overlying the elbows of the sigmoid, and the latter is preferentially observed in warm/hot AIA channels as an expanding bubble originating from the center of the sigmoid. The initiation of eruption always precedes the contraction, and in the energetically mild events (B and C flares), it also precedes the increase in GOES soft X-ray fluxes. In the more energetic events, the eruption is simultaneous with the impulsive phase of the nonthermal hard X-ray emission. These observations confirm the loop contraction as an integrated process in eruptions with partially opened arcades. The consequence of contraction is a new equilibrium with reduced magnetic energy, as the contracting loops never regain their original positions. The contracting process is a direct consequence of flare energy release, as evidenced by the strong correlation of the maximal contracting speed, and strong anti-correlation of the time delay of contraction relative to expansion, with the peak soft X-ray flux. This is also implied by the relationship between contraction and expansion, i.e., their timing and speed.
1 Introduction
It is generally regarded that solar eruptions are due to a disruption of the force balance between the upward magnetic pressure force and the downward magnetic tension force. Since the eruption can only derive its energy from the free energy stored in the coronal magnetic field (Forbes, 2000), “the coronal field lines must contract in such a way as to reduce the magnetic energy ” (Hudson, 2000). The contraction must be associated with the reduction of the magnetic tension force for each individual loop-like field line undergoing contraction, as its footpoints are effectively anchored in the photosphere. Eventually a new force balance would be achieved between the magnetic pressure and tension force after the energy release. From an alternative viewpoint, the average magnetic pressure must decrease over the relevant volume across the time duration of the eruption. can be roughly regarded as the flaring region, primarily in which magnetic energy is converted into other forms of energies. The contraction process, termed as “magnetic implosion” by Hudson (2000), is very similar to the shrinkage of post-flare loops (Forbes & Acton, 1996), except that loop shrinkage is driven by temporarily enhanced magnetic tension force at the cusp of the newly reconnected field lines, whereas loop contraction by reduced magnetic pressure in the flaring region. Additionally, with newly reconnected loops piling up above older ones, the post-flare arcade as a whole often expands rather than shrinks with time.
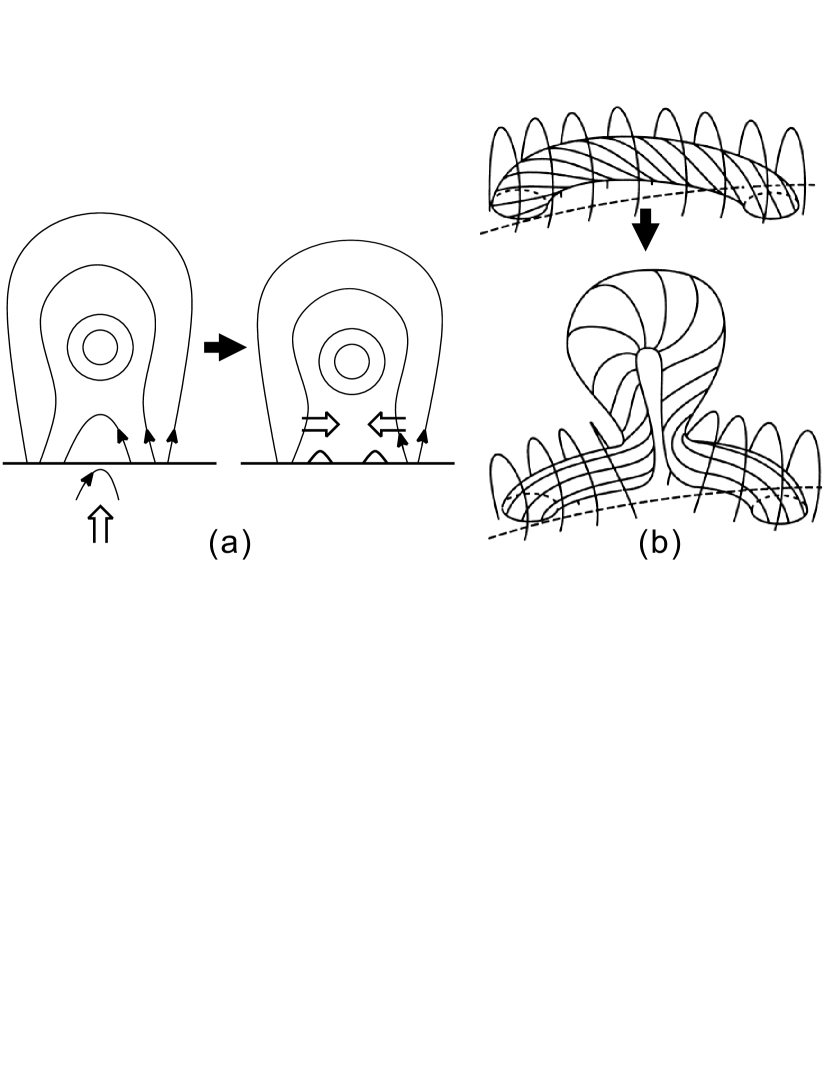
Hudson (2000) concluded that “a magnetic implosion must occur simultaneously with the energy release” , based on no assumption about the energy release process itself. However, the detailed timing and location of loop contraction might provide diagnostic information on the eruption mechanism. For example, when the reconnection-favorable flux emerges inside a filament channel (Figure 1(a); adapted from Chen & Shibata, 2000), it cancels the small magnetic loops below the flux rope, which results in a decrease of the local magnetic pressure. The whole dipolar magnetic structure must contract correspondingly. Meanwhile, plasmas on both sides of the polarity-inversion line (PIL) would move inward to form a current sheet below the flux rope and the subsequent evolution could follow the paradigm of the standard flare model (e.g., Kopp & Pneuman, 1976). In that case, overlying coronal loops could be observed to initially contract and then erupt. In a different scenario, a twisted flux rope confined by potential-like magnetic fields is found to be energetically favorable to “rupture” through the overlying arcade via ideal-MHD processes (Figure 1(b); adapted from Sturrock et al., 2001). This is clearly demonstrated in MHD simulations by Gibson & Fan (2006) and Rachmeler et al. (2009), in which overlying loops can be seen to be pushed upward and aside as the flux rope kinks and expands, and after the rope ruptures through the arcade, overlying loops on both sides quickly contract toward the core region, due to the reduction of the magnetic pressure in the core field with the escape of the flux rope. In particular for this scenario (1(b)), one would expect to see both the expanding flux rope and the contracting overlying loops during the eruption as long as the arcade is only partially opened. Although both scenarios involve a pre-existent flux rope, supposedly they can also accommodate those models in which the flux rope forms immediately prior to (e.g., Moore et al., 2001), or during the course of (e.g., Antiochos et al., 1999), the eruption.
Corresponding to the aforementioned models (1), our previous observational studies also suggest two different scenarios, i.e., 1) the bunch of coronal loops undergoing contraction later becomes the front of the eruptive structure (Liu et al., 2009b); and 2) the contracting loops are distinct from the eruptive structure (Liu & Wang, 2009, 2010). The role of contraction in the eruption, however, has been unclear in both scenarios. For Scenario 1, the event reported by Liu et al. (2009b) remains unique in the literature; as for Scenario 2, the eruptive structure is not easy to detect before its appearance as a CME in coronagraph, unless there is dense filament material serving as the tracer (Liu & Wang, 2009). In some cases its slow ascension and expansion during the early stage might manifest as the gradual inflation of overlying coronal loops (Liu et al., 2010b). Only with the advent of the Solar Dynamic Observatory (SDO; Pesnell et al., 2012) which provides a continuous and wide temperature coverage, is the eruptive structure itself more frequently identified beneath the coronagraph height as a hot, diffuse plasmoid (e.g., Liu et al., 2010c; Cheng et al., 2011).
Here in a further investigation of Scenario 2, we identify both the erupting and contracting components using SDO data, hence for the first time we are able to study in detail their relationship as well as the implication for the eruption mechanism and the associated energy release process. In the rest of the paper, we present in Section 2 the results of the investigation on five flares (Table 1) observed by the Atmospheric Imaging Assembly (AIA; Lemen et al., 2012) onboard SDO, and we make concluding statements in Section 3.
2 Observation
2.1 Overview
| Date | AR | Location | Hale | GOES | (km s-1)aaMaximum contracting speed | (km s-1)bbMaximum expanding speed | (min)ccTime delay of contraction relative to expansion |
|---|---|---|---|---|---|---|---|
| 2010-08-01 | 11092 | N13E21 | C3.2 | -51 | 83 | 9.0 | |
| 2010-09-03 | 11105 | N19W23 | B2.8 | -12 | 94 | 34.6 | |
| 2011-02-13 | 11158 | S19W03 | M6.6 | -195 | 538 | 1.8 | |
| 2011-02-15 | 11158 | S21W21 | X2.2 | -320 | 401 | 2.4 | |
| 2011-06-21 | 11236 | N17W19 | C7.7 | -57 | 90 | 12.4 |
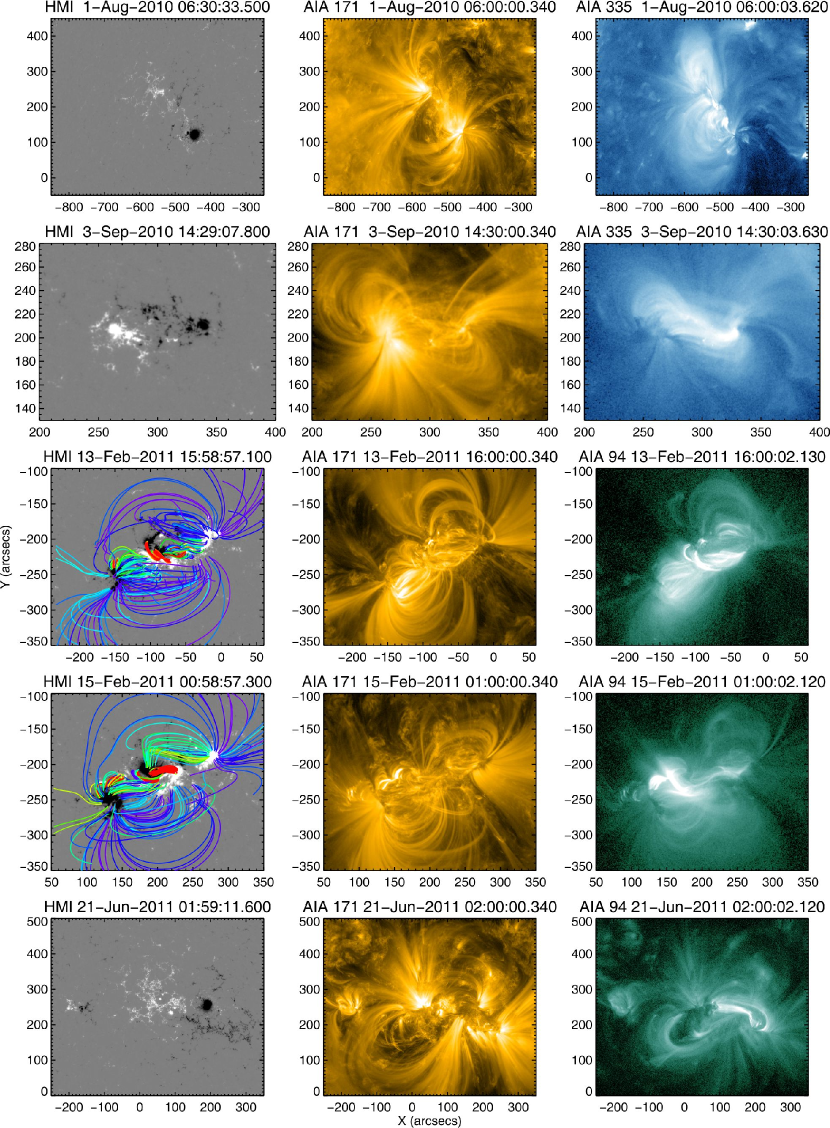
In addition to the symbiosis of the erupting and contracting component, the five flares studied here all occurred in sigmoidal active regions (2), which took a sinusoidal shape in the warm AIA channels such as 211 Å (dominated by Fe XIV, ) and 335 Å (dominated by Fe XVII, ) or hot channels like 94 Å (dominated by Fe XVIII, ). By close inspection, one can see that two groups of J-shaped loops which are oppositely oriented with respect to each other collectively make the sinusoidal appearance (2). In cold channels such as 171 Å (dominated by Fe IX and Fe X, ) and 193 Å (dominated by Fe XII, ), these regions were dominated by large-scale loops arched over the elbows of the hot sigmoid, suggesting that the highly sheared core field is restrained by the potential-like overlying field. Since nonpotential (sheared or twisted) fields are reservoir for magnetic free energy, it is not surprising that sigmoidal regions are significantly more likely to be eruptive than non-sigmoidal regions (Hudson et al., 1998; Canfield et al., 1999; Glover et al., 2000), and are deemed as one of the most important precursor structures for solar eruptions.
Of the five flares, both the M6.6 flare on 2011 February 13 and the X2.2 flare two days later on February 15 occurred in the same active region 11158. One can see that on February 13 when it was still classified as a -region, AR 11158 was only a “rudimentary” sigmoid compared with its status on February 15. The hot loops in AIA 94 Å in the center of the active region, however, were already highly sheared, taking the similar east-west orientation as the major PIL along which the two bipolar regions interacted and major flares took place (see Beauregard et al., 2012, for details).
Utilizing the newly released vector magnetograms with the pixel size for AR 11158 (Hoeksema et al., 2011) obtained by the Helioseismic and Magnetic Imager (HMI; Scherrer et al., 2012) onboard SDO, we constructed the nonlinear force-free field (NLFFF) model using the “weighted optimization” method (Wiegelmann, 2004) after preprocessing the photospheric boundary to best suit the force-free condition (Wiegelmann et al., 2006). NLFFF extrapolation using the vector magnetogram at about 16:00 UT on 2011 February 13 indeed shows highly sheared field lines near the flaring PIL and potential-like field lines overlying it, similar in morphology to the hot and cold coronal loops, respectively (2). NLFFF result using the vector magnetogram at about 01:00 UT on February 15 gives a similar result. The extrapolated field lines are color-coded according to the intensity of vertical currents on the surface. Field lines whose footpoints are associated with strong current densities ( A m-2) are in red colors. The footpoints of these red field lines are co-spatial with the four footpoint-like flare brightenings in AIA 94 Å images (Liu et al., 2012; Wang et al., 2012).
2.2 2010 August 1 Event
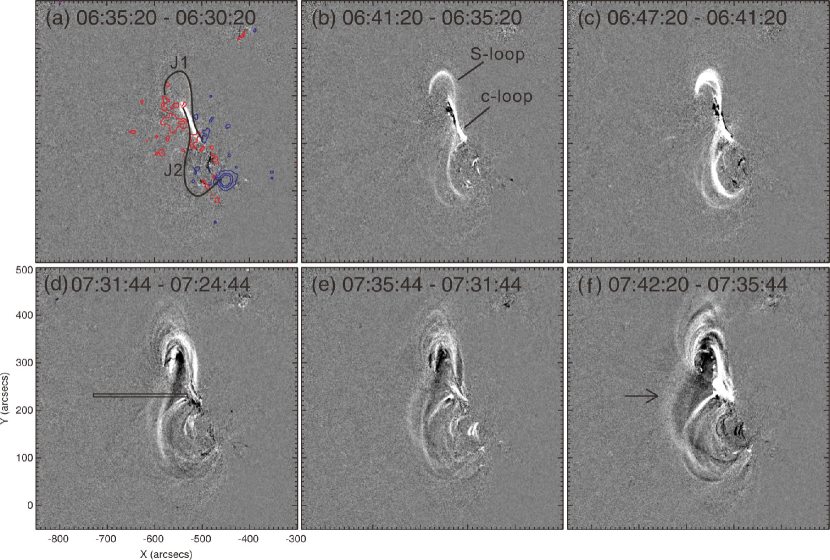
The eruption in the sigmoidal region NOAA AR 11093 on 2010 August 1 conformed to the classical “sigmoid-to-arcade” transformation (e.g. Moore et al., 2001), i.e., prior to the eruption, the sigmoidal structure was consisted of two opposite bundles of J-shaped loops, and after the eruption, it appeared as a conventional post-flare arcade. The evolution in between the two states was revealed in detail for the first time by AIA observations (Liu et al., 2010c). In the AIA 94 Å difference images (3), one can see that an S-shaped loop started to glow at about 06:40 UT, about 1 hr before the flare onset. As its glowing was preceded by a heating episode in the core region (3(a)), the topological reconfiguration resulting in the formation of the continuous S-shaped loop was very likely due to the tether-cutting reconnection (Moore et al., 2001). The S-shaped loop remained in quasi-equilibrium in the lower corona for about 50 minutes, with the central dipped portion rising quasi-statically. During this interval, there was a weak enhancement in GOES soft X-rays (SXRs), whose source, however, was located at the southeast limb according to RHESSI observations (see Figure 3 in Liu et al., 2010c). At about 07:30 UT, about 10 minutes prior to the onset of the C3.2 flare, the speed increased to tens of kilometers per second, as the S-shaped loop sped up its transformation into an arch-shaped loop, which eventually led to a CME.
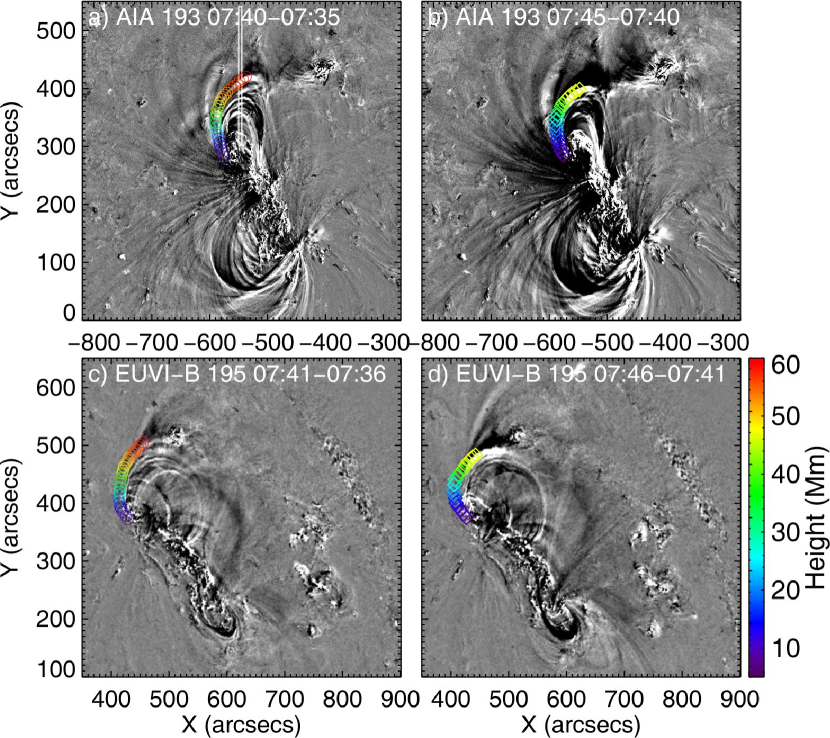
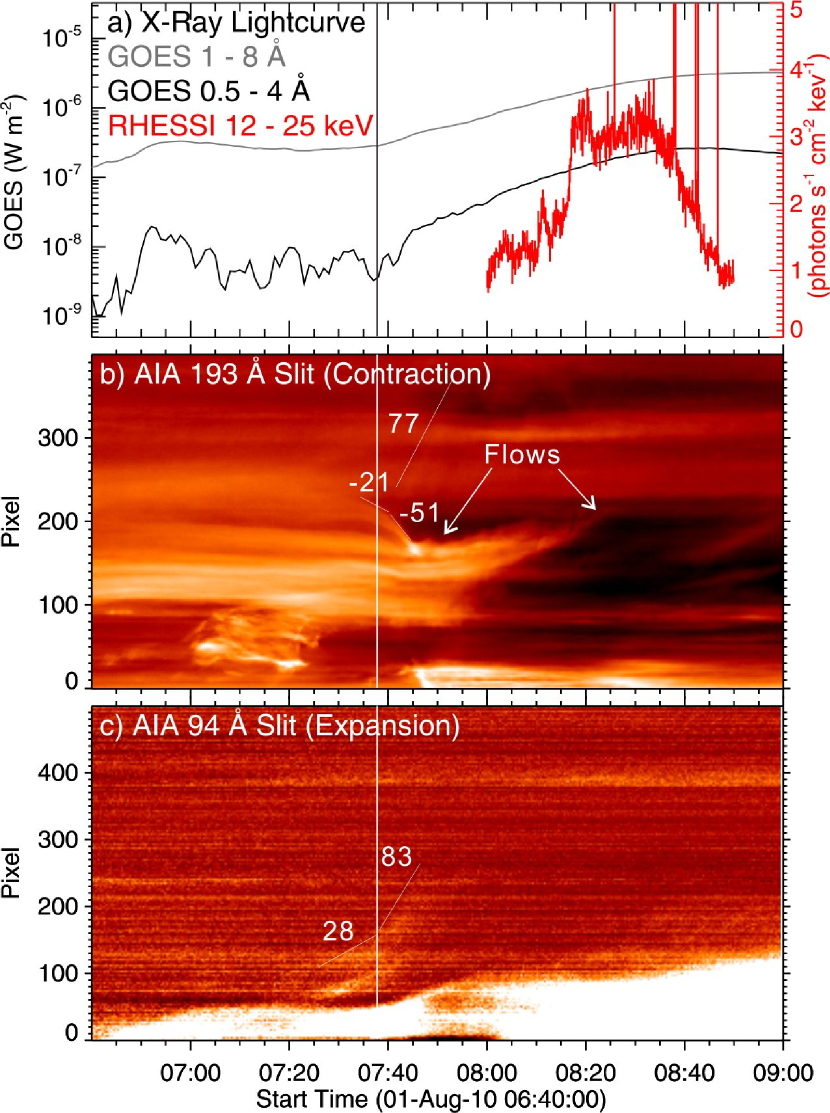
During the eruption, a group of coronal loops overlying the northern elbow of the sigmoid was observed to contract in cold AIA channels such as 171 and 193 Å. The contraction was also visible in EUV images taken by the Extreme-UltraViolet Imager (EUVI; Wuelser et al. 2004) onboard the “Behind” satellite of the Solar Terrestrial Relations Observatory (STEREO-B). The viewing angle was separated by about between SDO and STEREO-B. By pairing EUVI with AIA images, we are able to derive the three-dimensional location of the loop undergoing contraction via a triangulation technique called tie point (Inhester, 2006), which is implemented in an SSW routine, SCC_MEASURE, by W. Thompson. From the difference images (4) one can see both the contracting loop, whose height is color-coded, and the expanding bubble, which is associated with coronal dimming in AIA 193 Å. With stereoscopic views, it becomes clear that the contraction is not simply a projection effect due to the loops being pushed aside by the expanding bubble.
We place slits across both the contracting loops (4(a)) and the expanding bubble (3(d)). By stacking the resultant image cut over time, we obtain space-time diagrams for a series of AIA 193 and 94 Å images at 12-s cadence (5(b) and (c)). Note that to increase the signal-to-noise ratio, we integrate over the width of the slit (10 pixels), and that to reveal the diffuse, expanding bubble, we carry out base difference to make the 94 Å space-time diagram, whereas original 193 Å images are used for the contracting loops which are more clearly defined in EUV. From 5(c), one can see that the bubble initially rose slowly by 30 km s-1, and then transitioned into a phase of fast rise by 80 km s-1 at about 07:38 UT. The height-time profile is piecewise-linear fitted although the transition is smooth and there seems to be a continuous acceleration. The transition time is approximately coincident with the flare onset in terms of the GOES 1–8 Å flux. A very diffuse erupting feature can also be marginally seen in the 193 Å space-time diagram, whose speed is similar as the bubble in 94 Å. The contraction of the overlying loops slightly lagged behind the rising of the bubble, and there was a similar transition from slow to fast contraction, slightly lagging behind the speed transition of the bubble by less than 3 min. It is worth noting that the apparently upward-moving feature in the wake of contraction was due to flows along the northern elbow of the sigmoid, not to the recovery of the contracting loops.
2.3 2010 September 3 Event
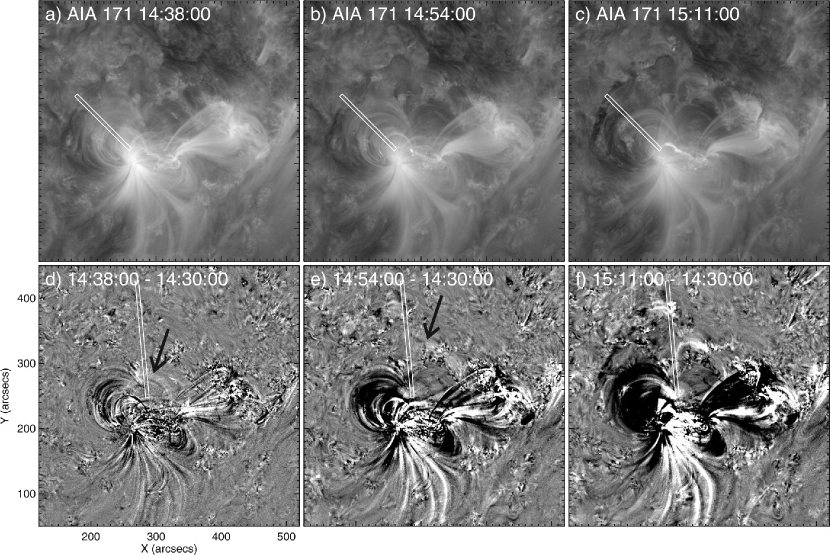
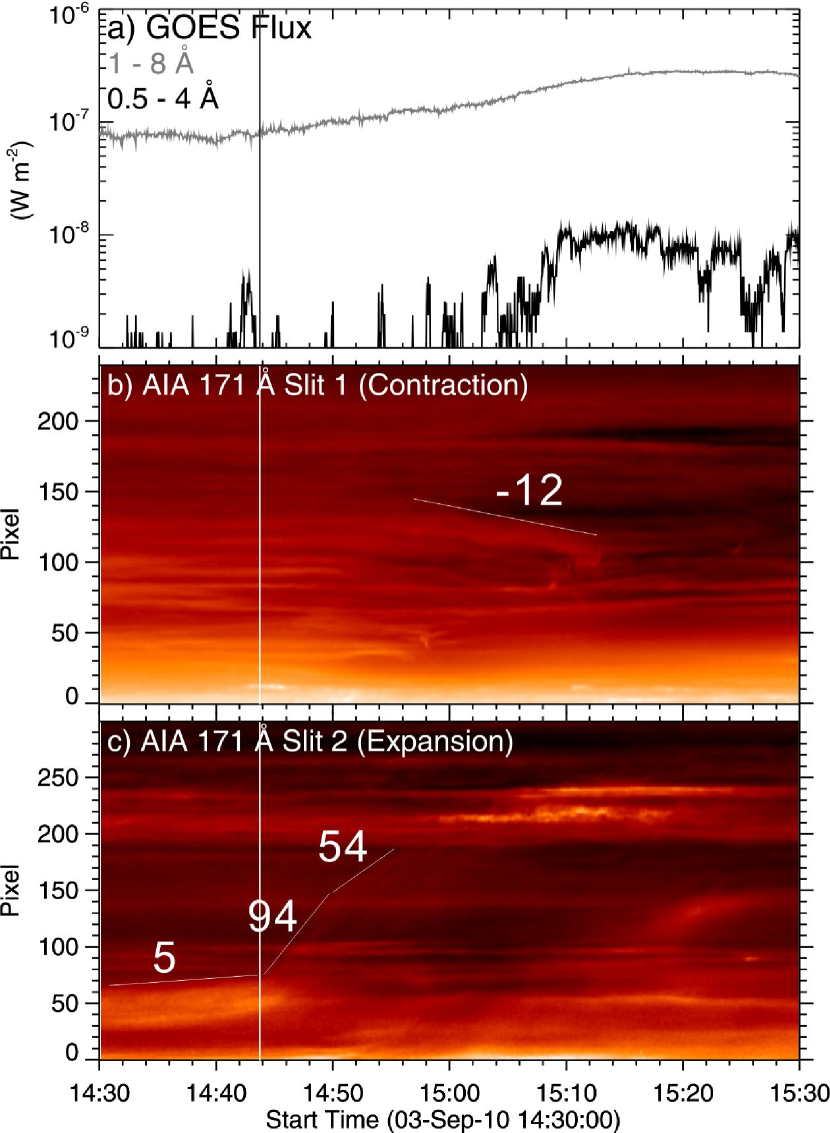
In the 2010 September 3 event, both the contracting loops and expanding bubble were visible in the 171 Å channel. But the diffuse bubble can only be seen in difference images (bottom panels in 6, marked by arrows). The contracting loops were located to the east of the bubble, overlying the eastern elbow of the sigmoid (top panels in 6). Similar to the 2010 August 1 event, in the wake of the bubble erupting, obvious coronal dimming can be seen in the cold AIA channels such as 171 and 193 Å. The dynamics of the bubble can also be characterized by a slow-rise followed by a fast-rise phase, the transition of which coincided with the gradual increase of the GOES 1–8 Å flux (7). The bubble shows signature of deceleration after 14:48 UT. The loop contraction lagged behind the transition time at about 14:44 UT by about 10 minutes.
2.4 2011 February 13 Event
The 2011 February 13 M6.6 flare was associated with irreversible changes of the photospheric magnetic field (Liu et al., 2012). Using high-resolution and high-precision Hinode vector magnetograms and line-of-sight HMI magnetograms, Liu et al. (2012) found that the field change mainly took place in a compact region lying in the center of the sigmoid, where the strength of the horizontal field increased significantly across the time duration of the flare. Moreover, the near-surface field became more stressed and inclined toward the surface while the coronal field became more potential. An intriguing observation is that the current system derived from the extrapolated coronal field above the region with enhanced horizontal field underwent an apparent downward collapse in the wake of the sigmoid eruption. Liu et al. (2012) concluded that these results are a superimposed effect of both the tether-cutting reconnection producing the flare and the magnetic implosion resulting from the energy release.
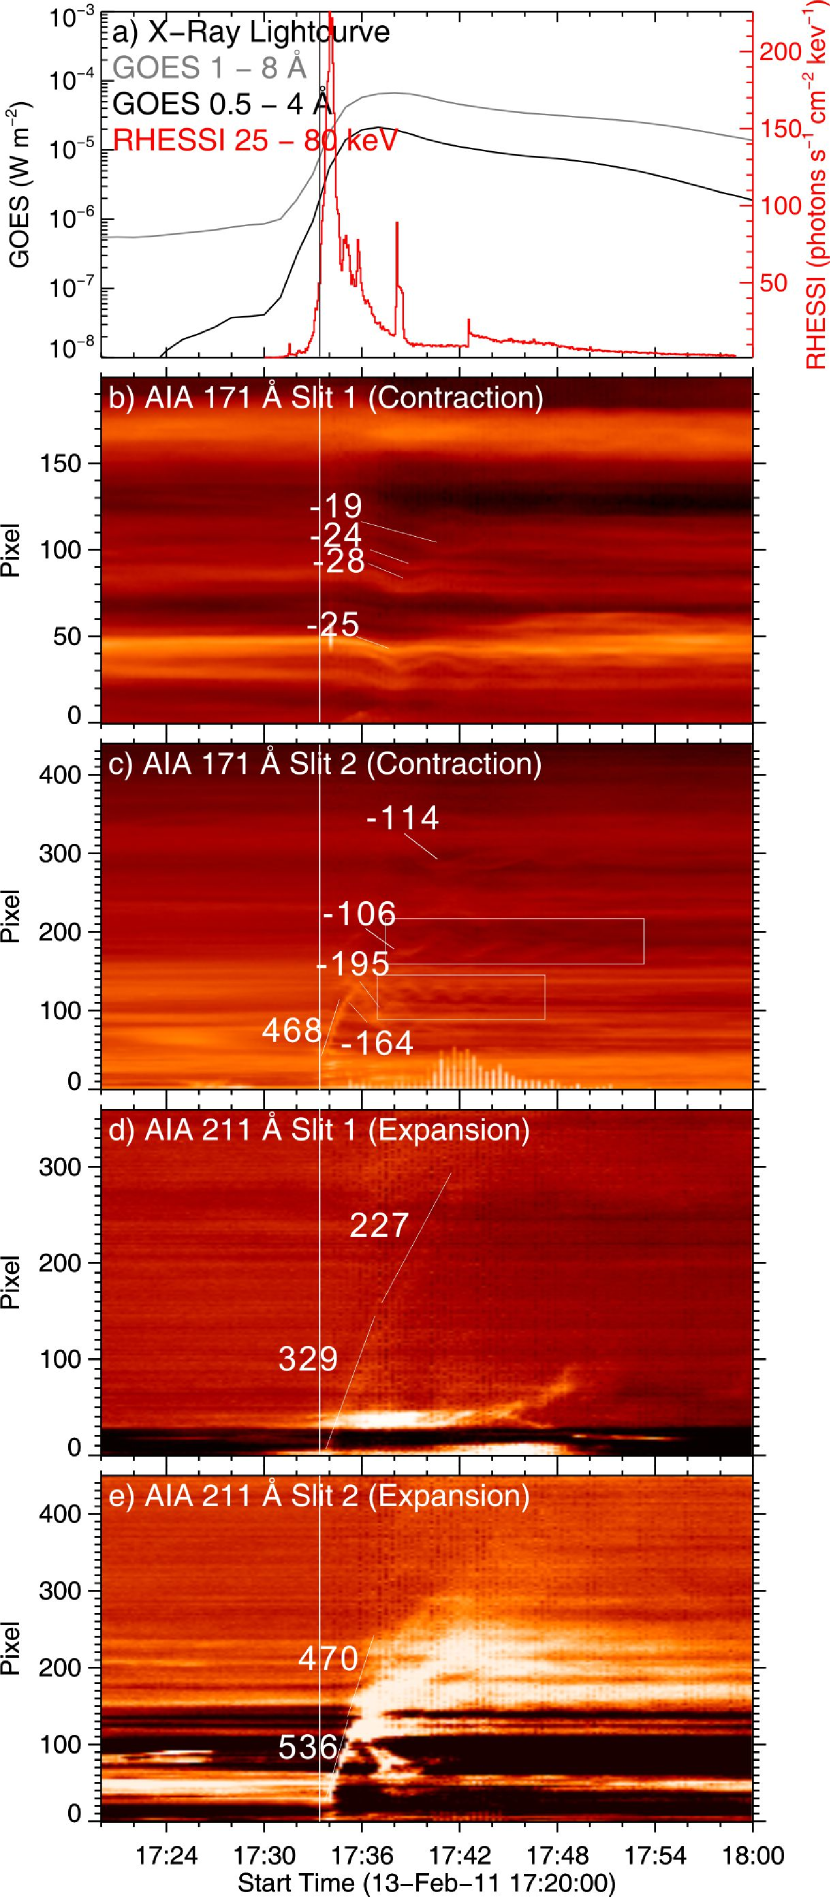
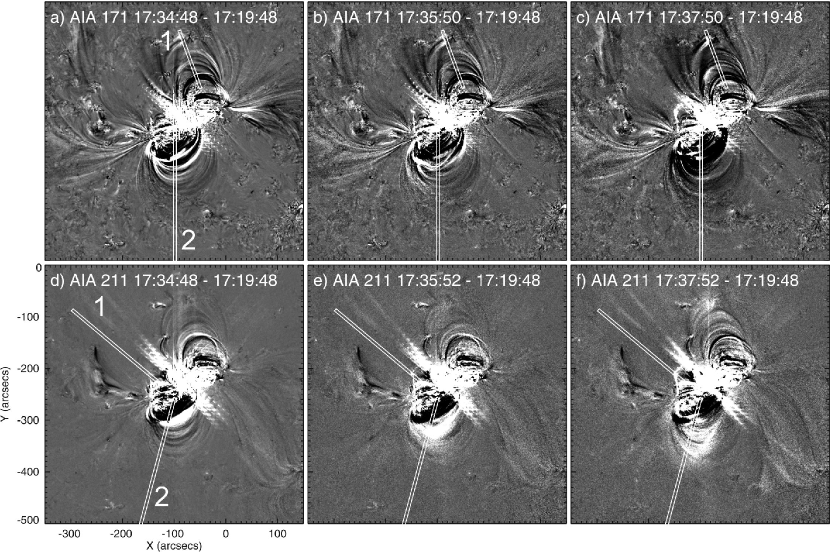
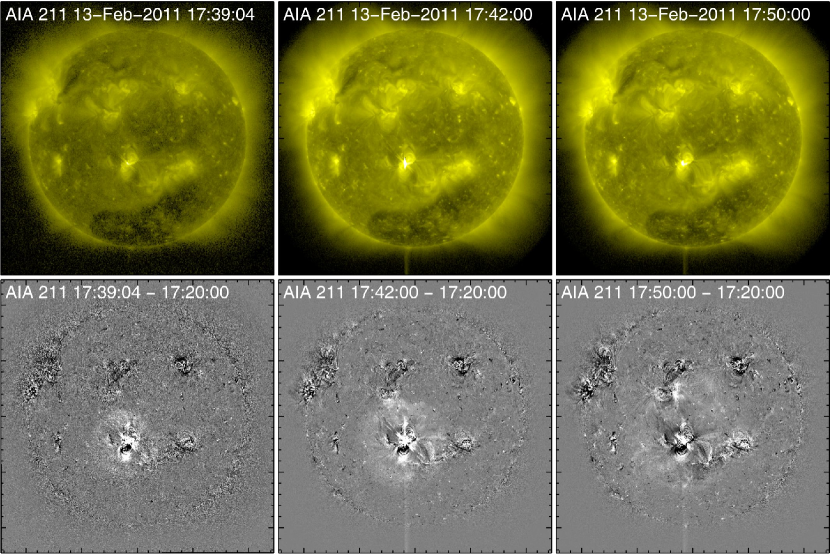
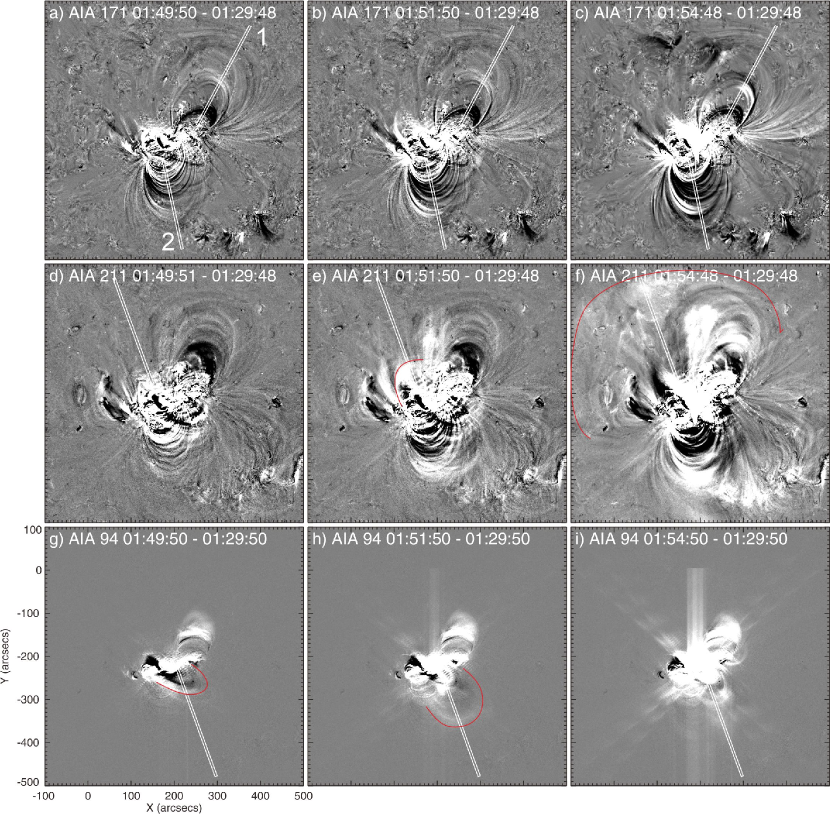
Coronal EUV observations agree with the above conclusion drawn from photospheric field measurements regarding magnetic implosion. At the onset of the impulsive phase, two arch-shaped loops originating from the center of the sigmoid were observed to expand outward in 211 Å in different directions (bottom panels of 8) but at similar projected speeds (9(d) and (e)), while coronal loops overlying both elbows of the sigmoid were observed to contract (top panels of 8), with the loops overlying the eastern elbow contracting much faster (9(b) and (c)). For this relatively energetic event, the eruption only preceded the contraction by tens of seconds, and the contracting speed reaches as fast as 200 km s-1. In the wake of the contraction, loops overlying the eastern elbow underwent oscillation for several cycles (marked by rectangles in 9), similar to the events studied by Liu & Wang (2010), Gosain (2012), and Kallunki & Pohjolainen (2012). Beyond the expanding loops, one can also see in the animation of AIA 211 Å difference images (accompanying 8) a diffuse oval front with enhanced intensity propagating outward, well separated from the expanding loops. This oval structure has been identified in MHD simulations as a shell of return currents surrounding the flux rope (Aulanier et al., 2010; Schrijver et al., 2011). From 10 one can see that the front was propagating anisotropically, apparently restrained by nearby active regions and the coronal hole in the southern polar region.
2.5 2011 February 15 Event
The 2011 February 15 X2.2 flare in AR 11158 is the first X-class flare of the current solar cycle, hence it raises a lot of interests and has been intensively studied. Kosovichev (2011) reported that the flare produced a powerful “sunquake” event with its impact on the photosphere. Wang et al. (2012) reported a rapid, irreversible change of the photospheric magnetic field associated with the flare. Beauregard et al. (2012) studied the shear flows along the polarity-inversion line as well as the white-light flare emission. Schrijver et al. (2011) investigated the coronal transients associated with the flare. In particular, Schrijver et al. (2011) observed “expanding loops from a flux-rope-like structure over the shearing polarity-inversion line between the central -spot groups of AR 11158, developing a propagating coronal front (‘EIT wave’), and eventually forming the coronal mass ejection moving into the inner heliosphere”. Here the expanding loops are identified as the erupting component of the eruption.
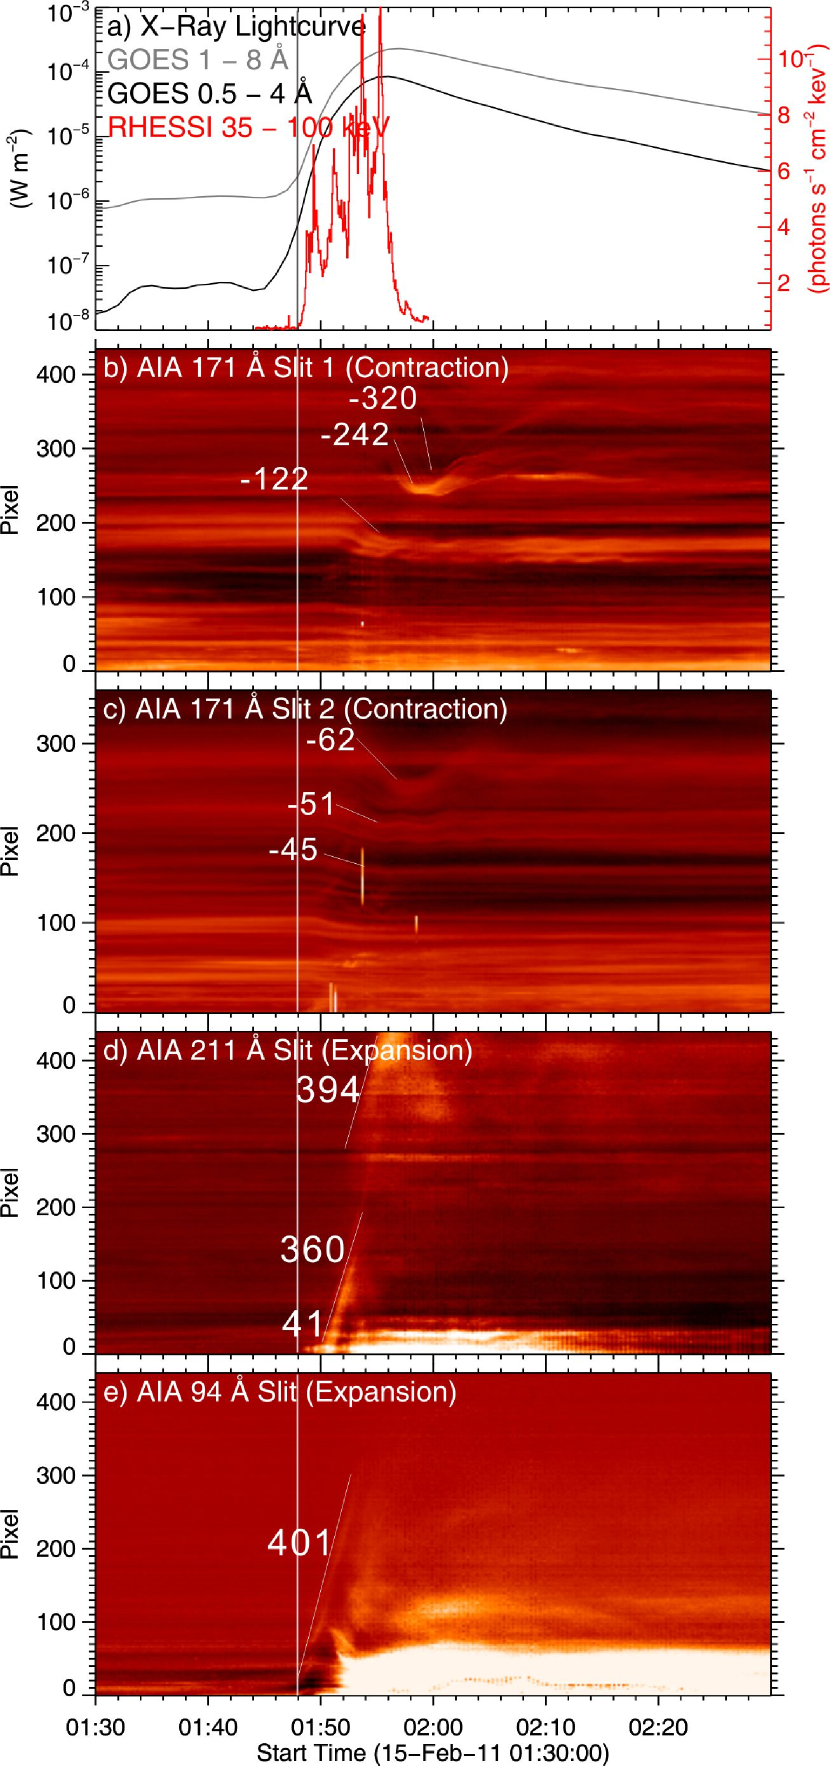
The active region as seen in the AIA 171 Å channel were dominated by two groups of potential-like loops overlying the elbows of the forward S-shaped sigmoid as seen in the hot AIA channels (2). Both groups of potential-like loops were observed to contract during the X2.2 flare. In each group, loops underwent contraction in a successive fashion with those located at lower altitudes starting to contract first, due presumably to the limited propagation speed of the Alfv̀en wave (see also Liu & Wang, 2010; Gosain, 2012), whereas loops at higher altitudes had a faster contraction speed (12(b) and (c)). These contracting/collapsing features are also independently noticed by Schrijver et al. (2011); Gosain (2012); Sun et al. (2012) with different approaches but a similar interpretation in agreement with Liu & Wang (2009). Similar to the February 13 event, in the wake of the contraction, loops overlying both elbows underwent oscillation (see 12, also see Liu & Wang, 2010; Gosain, 2012; Kallunki & Pohjolainen, 2012).
Immediately prior to the loop contraction, a bubble (marked by red arcs in the middle panels of 11) can be best seen to originate from the core of the sigmoid and to expand northeastward in the 211 Å channel and southwestward in the 94 Å channel (bottom panels of 11; marked by red arcs). A transition from a slow- to fast-rise phase can still be marginally seen in the 211 Å channel. But the duration of the slow-rise phase was very short, lasting for only about 2 minutes. The transition time at about 01:50 UT still preceded the loop contraction by about 3 minutes. The commencement of the bubble expansion at about 01:48 UT was concurrent with the onset of the nonthermal HXR emission at 35–100 keV. This expanding bubble was also closely associated with “an expanding intensity front propagating away from the flaring region seen on the disk, and the leading edge of the intensity signature of the CME propagating outward from the Sun into the heliosphere” as identified by Schrijver et al. (2011). These three distinct features are suggested as different observational aspects of the eruption of a flux rope (Schrijver et al., 2011).
2.6 2011 June 21 Event
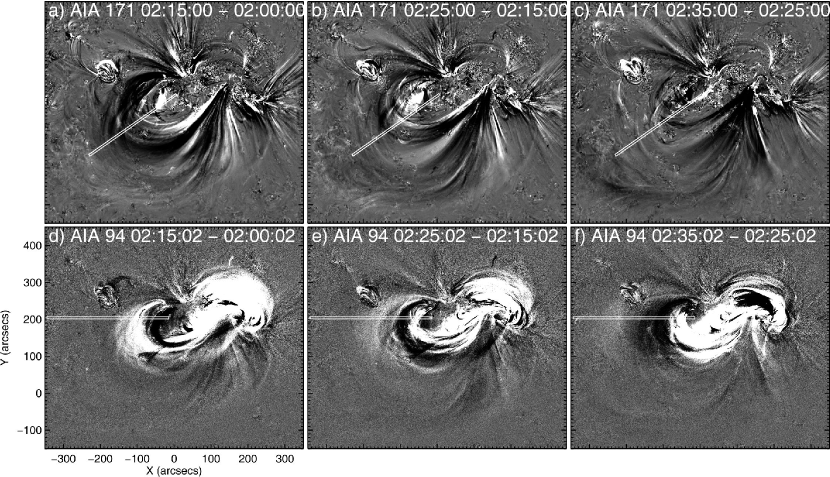
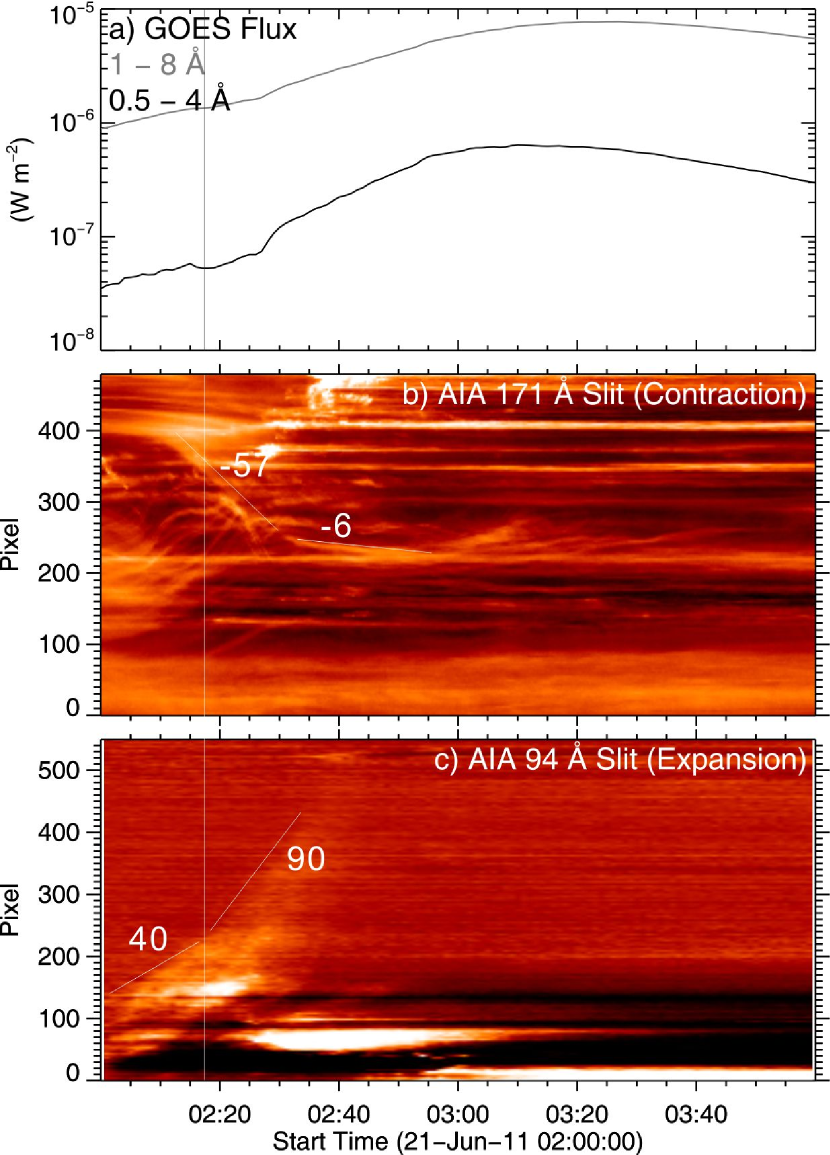
In the 2011 June 21 event, the group of coronal loops overlying the eastern elbow of the sigmoid was observed to contract in the 171 Å channel (top panels in 13). At the same time, a bubble originating from the center of the sigmoid was observed to expand eastward in the 94 Å channel (bottom panels in 13). Both the contraction and the expansion occurred prior to the C7.7 flare. The transition time of the bubble from a relatively slow- to a fast-rise phase was roughly coincident with the onset of the flare (14).
3 Discussion & Conclusion
We have investigated four sigmoidal active regions, in which five eruptions with signatures of magnetic implosion occurred. The magnitudes of the flares associated with the eruptions span almost the whole flare “spectrum”, from the GOES-class B to X. In all of the flares studied, there are both a contracting and an erupting component: the former is only observed in cold EUV channels and the latter is preferentially visible in warm/hot EUV channels. This is because the contracting component is composed of large-scale, potential-like coronal loops overlying the elbows of the sigmoid, while the erupting component is associated with newly reconnected flux tubes originating from the center of the sigmoid (c.f., Liu et al., 2010c; Aulanier et al., 2010; Schrijver et al., 2011). Several important aspects of these observations are discussed as follows.
-
•
Consequence of loop contraction: the overlying loops undergoing contraction never regain their pre-flare positions, which implies a new equilibrium with reduced magnetic energy as the eruption is powered by magnetic energy. One may argue that the apparent contraction of coronal loops could be a projection effect, i.e., the loop plane tilts due to the flare impulse. But in that case, one would expect the restoration of the loops once the flare impulse has passed away. In observation, however, the contracting loops may oscillate about a lower height (e.g., 9; see also Liu & Wang, 2010), but never reach the original heights after the eruption. Thus, the contraction within the loop plane must make a significant contribution.
-
•
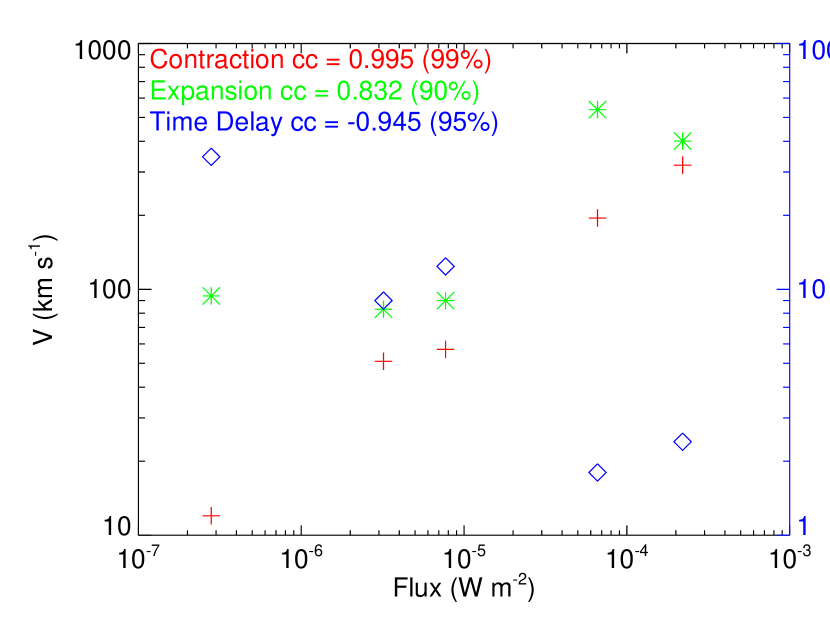
Correlation between contraction and eruption: the contraction speed seems to depend on the intensity/magnitude of the eruption. From 15, one can see that despite this very small sample size, the peak GOES SXR flux as a proxy of the flare magnitude is linearly correlated very well with the measured maximal contracting speed in the log-log plot, although not so well with the maximal erupting speed. Unlike contracting loops which are clearly defined, however, the measurement of the erupting speed involves larger uncertainties as the front of the expanding bubble tend to get more and more diluted and eventually overwhelmed by the background during propagation, thereby leading to underestimation of its speed. One more caveat to keep in mind is that these speeds are not necessarily measured at the time of the peak SXR flux.
-
•
Timing: the eruption precedes the contraction in all of the flares studied, which establishes loop contraction as a consequence of eruption. There is also a trend that the more energetic the eruption, the smaller the time delay of the loop contraction relative to the onset of the expansion of the erupting component, which is demonstrated in 15 as a strong anti-correlation between the time delay and the peak GOES SXR flux in the log-log plot. This time delay is presumably determined by the expansion speed of the erupting component. In addition, in the relatively weak B- and C-flares, the initiation of the erupting component precedes the increase in GOES SXR fluxes; but in the stronger M- and X-flares, it is concurrent with the increase in nonthermal HXR fluxes. This may lend support to Lin (2004), who concluded that CMEs are better correlated with flares if there is more free energy available to drive the eruption. On the other hand, since the CME progenitor, i.e., the expanding bubble, forms before the flare onset as the weak events clearly demonstrate, the CME must be independent of the conventionally defined flare, or, the flare is only a byproduct of the CME, unless the eruption mechanism for the weak events is different from that for the energetic ones.
-
•
Asymmetry of contraction: the two groups of coronal loops overlying the elbows of the sigmoid often contract asymmetrically, i.e., not only they contract at different speeds but either group could show little sign of contraction, dependent on the detailed interaction between the core field and the arcade field, including, presumably, their relative strength and the spatial distribution of the decay index of the restraining field (Kliem & Török, 2006; Liu et al., 2009a, 2010a). For the 2010 August 1 event in particular, Liu et al. (2010c) concluded that the majority of the flare loops were formed by reconnection of the stretched legs of the less sheared loops overlying the southern elbow and the center of the sigmoid, based on the reconnection rate inferred from the H ribbon motion. The eruption therefore left most loops overlying the northern elbow unopened. This explains why only these loops underwent obvious contraction. The intensity/magnitude of the eruption could be another relevant factor as among the events studied only those greater than M-class show contraction of loops overlying both elbows of the sigmoid.
-
•
Implication for eruption mechanism: as the contracting component is distinct from the erupting component, we conclude that these eruptions conform to the “rupture model” in which the arcade field is partially opened (Sturrock et al., 2001, 1(b)). We can further exclude the breakout model because the coronal loops undergoing contraction are arched over, rather than located to the side of, the sheared core field. The loop contraction in the latter occasion results from reconnection at the magnetic null above the central lobe in the breakout model.
In conclusion, these observations substantiate the loop contraction as an integrated process in eruptions of sigmoidal active regions in which the restraining arcade field is only partially opened, consistent with theoretical expectations. The consequence of loop contraction is a new equilibrium of the coronal field with reduced magnetic energy, and the process itself is a result of the flare energy release, as evidenced by the strong correlation of the maximal contracting speed, and strong anti-correlation of the time delay of contraction relative to expansion, with the peak SXR flux.
References
- Antiochos et al. (1999) Antiochos, S. K., DeVore, C. R., & Klimchuk, J. A. 1999, ApJ, 510, 485
- Aulanier et al. (2010) Aulanier, G., Török, T., Démoulin, P., & DeLuca, E. E. 2010, ApJ, 708, 314
- Beauregard et al. (2012) Beauregard, L., Verma, M., & Denker, C. 2012, Astronomische Nachrichten, 333, 125
- Canfield et al. (1999) Canfield, R. C., Hudson, H. S., & McKenzie, D. E. 1999, Geophys. Res. Lett., 26, 627
- Chen & Shibata (2000) Chen, P. F. & Shibata, K. 2000, ApJ, 545, 524
- Cheng et al. (2011) Cheng, X., Zhang, J., Liu, Y., & Ding, M. D. 2011, ApJ, 732, L25+
- Forbes (2000) Forbes, T. G. 2000, J. Geophys. Res., 105, 23153
- Forbes & Acton (1996) Forbes, T. G. & Acton, L. W. 1996, ApJ, 459, 330
- Gibson & Fan (2006) Gibson, S. E. & Fan, Y. 2006, ApJ, 637, L65
- Glover et al. (2000) Glover, A., Ranns, N. D. R., Harra, L. K., & Culhane, J. L. 2000, Geophys. Res. Lett., 27, 2161
- Gosain (2012) Gosain, S. 2012, ApJ, 749, 85
- Hoeksema et al. (2011) Hoeksema et al. 2011, Sol. Phys., to be submitted
- Hudson (2000) Hudson, H. S. 2000, ApJ, 531, L75
- Hudson et al. (1998) Hudson, H. S., Lemen, J. R., St. Cyr, O. C., Sterling, A. C., & Webb, D. F. 1998, Geophys. Res. Lett., 25, 2481
- Inhester (2006) Inhester, B. 2006, ArXiv e-print: astro-ph/0612649
- Kallunki & Pohjolainen (2012) Kallunki, J. & Pohjolainen, S. 2012, Sol. Phys., 122
- Kliem & Török (2006) Kliem, B. & Török, T. 2006, Phys. Rev. Lett., 96, 255002
- Kopp & Pneuman (1976) Kopp, R. A. & Pneuman, G. W. 1976, Sol. Phys., 50, 85
- Kosovichev (2011) Kosovichev, A. G. 2011, ApJ, 734, L15+
- Lemen et al. (2012) Lemen, J. R., Title, A. M., Akin, D. J., et al. 2012, Sol. Phys., 275, 17
- Lin (2004) Lin, J. 2004, Sol. Phys., 219, 169
- Liu et al. (2012) Liu, C., Deng, N., Liu, R., Lee, J., Wiegelmann, T., Jing, J., Xu, Y., Wang, S., & Wang, H. 2012, ApJ, 745, L4
- Liu et al. (2010a) Liu, C., Lee, J., Jing, J., Liu, R., Deng, N., & Wang, H. 2010a, ApJ, 721, L193
- Liu et al. (2009a) Liu, R., Alexander, D., & Gilbert, H. R. 2009a, ApJ, 691, 1079
- Liu et al. (2010b) Liu, R., Liu, C., Park, S.-H., & Wang, H. 2010b, ApJ, 723, 229
- Liu et al. (2010c) Liu, R., Liu, C., Wang, S., Deng, N., & Wang, H. 2010c, ApJ, 725, L84
- Liu & Wang (2009) Liu, R. & Wang, H. 2009, ApJ, 703, L23
- Liu & Wang (2010) —. 2010, ApJ, 714, L41
- Liu et al. (2009b) Liu, R., Wang, H., & Alexander, D. 2009b, ApJ, 696, 121
- Moore et al. (2001) Moore, R. L., Sterling, A. C., Hudson, H. S., & Lemen, J. R. 2001, ApJ, 552, 833
- Pesnell et al. (2012) Pesnell, W. D., Thompson, B. J., & Chamberlin, P. C. 2012, Sol. Phys., 275, 3
- Rachmeler et al. (2009) Rachmeler, L. A., DeForest, C. E., & Kankelborg, C. C. 2009, ApJ, 693, 1431
- Scherrer et al. (2012) Scherrer, P. H., Schou, J., Bush, R. I., Kosovichev, A. G., Bogart, R. S., Hoeksema, J. T., Liu, Y., Duvall, T. L., Zhao, J., Title, A. M., Schrijver, C. J., Tarbell, T. D., & Tomczyk, S. 2012, Sol. Phys., 275, 207
- Schrijver et al. (2011) Schrijver, C. J., Aulanier, G., Title, A. M., Pariat, E., & Delannée, C. 2011, ApJ, 738, 167
- Sturrock et al. (2001) Sturrock, P. A., Weber, M., Wheatland, M. S., & Wolfson, R. 2001, ApJ, 548, 492
- Sun et al. (2012) Sun, X., Hoeksema, J. T., Liu, Y., Wiegelmann, T., Hayashi, K., Chen, Q., & Thalmann, J. 2012, ApJ, 748, 77
- Wang et al. (2012) Wang, S., Liu, C., Liu, R., Deng, N., Liu, Y., & Wang, H. 2012, ApJ, 745, L17
- Wiegelmann (2004) Wiegelmann, T. 2004, Sol. Phys., 219, 87
- Wiegelmann et al. (2006) Wiegelmann, T., Inhester, B., & Sakurai, T. 2006, Sol. Phys., 233, 215
- Wuelser et al. (2004) Wuelser, J.-P., Lemen, J. R., Tarbell, T. D., et al. 2004, in Society of Photo-Optical Instrumentation Engineers (SPIE) Conference Series, Vol. 5171, Telescopes and Instrumentation for Solar Astrophysics, ed. S. Fineschi & M. A. Gummin, 111–122