The role of stellar mass and environment for cluster blue fraction, AGN fraction and star-formation indicators from a targeted analysis of Abell 1691
Abstract
We present an analysis of the galaxy population of the intermediate X-ray luminosity galaxy cluster, Abell 1691, from SDSS and Galaxy Zoo data to elucidate the relationships between environment and galaxy stellar mass for a variety of observationally important cluster populations that include the Butcher-Oemler blue fraction, the active galactic nucleus (AGN) fraction and other spectroscopic classifications of galaxies. From 342 cluster members, we determine a cluster recession velocity of kms-1 and velocity dispersion of kms-1 and show that although the cluster is fed by multiple filaments of galaxies it does not possess significant sub-structure in its core. We identify the AGN population of the cluster from a BPT diagram and show that there is a mild increase in the AGN fraction with radius from the cluster centre that appears mainly driven by high mass galaxies (log(stellar mass)). Although the cluster blue fraction follows the same radial trend, it is caused primarily by lower mass galaxies (log(stellar mass)). Significantly, the galaxies that have undergone recent star-bursts or are presently star-bursting but dust-shrouded (spectroscopic e(a) class galaxies) are also nearly exclusively driven by low mass galaxies. We therefore suggest that the Butcher-Oemler effect may be a mass-dependant effect. We also examine red and passive spiral galaxies and show that the majority are massive galaxies, much like the rest of the red and spectroscopically passive cluster population. We further demonstrate that the velocity dispersion profiles of low and high mass cluster galaxies are different. Taken together, we infer that the duty cycle of high and low mass cluster galaxies are markedly different, with a significant departure in star formation and specific star formation rates observed beyond and we discuss these findings.
keywords:
galaxies: clusters: individual: Abell 1691 — galaxies: evolution — galaxies: active — galaxies: stellar content1 Introduction
Arguably the most important, emergent conclusion about galaxy evolution during the past decade is that the two main driving forces behind it are the stellar mass of a galaxy and its large-scale environment. Although stellar mass may be the more important of the pair, the environmental effects are also non-negligible and the two variables likely exhibit a significant covariance (Baldry et al. 2006; see also von der Linden et al. 2010).

For example, in the extreme (and hostile) environment of the dense cores of massive galaxy clusters galaxy colour is preferentially red and galaxy morphology elliptical – a systematic difference to non-cluster galaxies (e.g. Dressler 1980; Dressler et al. 1997; Lewis et al. 2002; Gómez et al. 2003; Balogh et al. 2004a; 2004b; Kauffmann et al. 2004; Christlein & Zabludoff 2005; Baldry et al. 2006; Cooper et al. 2006 Sato & Martin 2006; Pimbblet et al. 2006; Bamford et al. 2009; Skibba et al. 2009; Deng et al. 2010; Peng et al. 2010; Ma & Ebeling 2011; Patel et al. 2011; Calvi et al. 2012; Jensen & Pimbblet 2012).
The mass function of cluster galaxies shows that the more massive galaxies are also redder and more frequently elliptical (e.g. Baldry et al. 2006; di Serego et al. 2006; Clemens et al. 2006; van der Wel 2007; van den Bosch et al. 2008; Bamford et al. 2009; Deng et al. 2010; Pasquali et al. 2010; Peng et al. 2010; Nair & Abraham 2010; Thomas et al. 2010; Grützbauch et al. 2011; Giodini et al. 2012; Wilman & Erwin 2012; see also Vulcani et al. 2012).
Early investigations in to galaxy evolution inside clusters of galaxies by Butcher & Oemler (1978; 1984) suggested that the fraction of blue galaxies decreases rapidly with decreasing redshift. They hypothesized that the cause of this dramatic change in blue fraction to be due to spiral galaxies undergoing ram-pressure stripping caused by interaction with the intra-cluster environment (e.g. Gunn & Gott 1972). Such sprials morphologically transform in to lenticular (S0) galaxies and fade as they are no longer able to replenish their gas supplies. Later works confirmed the existence of the Butcher-Oemler effect (Couch et al. 1994; Rakos & Schombert 1995; Lubin 1996; Dressler et al. 1997; Smail et al. 1998; Ellingson et al. 2001; Kodama & Bower 2001; Margoniner et al. 2001; Goto et al. 2003; Tran et al. 2003; De Propris et al. 2004; Urquhart et al. 2010). Yet observational follow-up by Dressler & Gunn (1983) demonstrated that the blue galaxies measured by the Butcher-Oemler effect are actually undergoing star-bursts rather than gently fading away, indicating that instead of gas being stripped in a galaxy, in could be used up in a spectacular, albeit terminal, starburst phase. Couch & Sharples (1987) made an independent spectroscopic study of clusters and came to the same conclusion: the blue galaxies are being driven by galaxies that have undergone a recent (explicitly: within 0.5 Gyr) starburst. This observational conclusion has been re-enforced by later studies (e.g. Lavery & Henry 1988; Fabricant et al. 1994; Couch et al. 1994; 1998; Abraham et al. 1996; Fisher et al. 1998; Poggianti et al. 1999; Dressler et al. 2004). Moreover, some of the other cluster galaxies also exhibited the rare signatures of a post-starburst phase (E+A galaxies; e.g. Zabludoff et al. 1996) suggesting a duty cycle for these blue galaxies (see also Mahajan et al. 2011). The cause of the blue Butcher-Oemler galaxies has subsequently been argued to be due to a number of different physical mechanisms including, but not limited to, galaxy-galaxy interaction (Lavery & Henry 1988; Couch et al. 1994; Moore et al. 1996; Quilis et al. 2000); galaxy-cluster interaction (Henriksen & Byrd 1996; Bekki et al. 2001); galaxy mergers (van Dokkum et al. 1999; Dressler et al. 1999); or a slow starvation of star-forming gas (Larson, Tinsley & Caldwell 1980; Balogh & Morris 2000; Bekki, Couch & Shioya 2002). These mechanisms operate most efficiently in different environs which would lead to differentiable observational signatures (e.g. ram pressure induced starbursts should cause more blue galaxies close to the cluster core, whereas mergers would not do so).
We caution here, however, that there are certainly observational biases affecting some studies (as indicated by Andreon & Ettori 1999; De Propris et al. 2003; Andreon et al. 2006; Holden et al. 2007), claims of a lack of Butcher-Oemler effect (e.g. Haines et al. 2009; Andreon et al. 2006), or at the very least a dampened effect when some of these selection biases are taken in to account (cf. Margoniner & de Carvalho 2000). For example, if galaxies are mass-selected, then bluer galaxies are seldom found in more massive regimes ( solar masses; see Raichoor & Andreon 2012a,b).
Taking the above results together, it is suggestive that a starbursting phase is very important in the evolution (or duty-cycle) of cluster galaxies (Oemler et al. 2009) – especially at lower masses (Mahajan et al. 2011). As galaxies accrete on to the cluster potential, some may experience a starburst due to one or more of the above mechanisms (see also Porter et al. 2008; Fadda et al. 2008). Whilst galaxies outside a cluster tend to revert to their long-term star-formation rates after a starburst, cluster galaxies do not (cf. Poggianti et al. 1999; Dressler et al. 2004; Oemler et al. 2009; see also Dressler et al. 2009). The duty cycle of cluster galaxies therefore merits further investigation at all redshifts – particularly if we are to elucidate the connections between mass, environment, colour and morphology that we have summarized above. We can also tie these relationships to incidence of active galactic nuclei (AGN). From a simplistic observational viewpoint, powerful AGN are found in massive galaxies with current, on-going star-formation (e.g. Magorrian et al. 1998; Kauffmann et al. 2003; Heckman et al. 2005; von der Linden et al. 2010; Xue et al. 2010; see also Aird et al. 2012). Since AGN require a fuel source (i.e. gas), any physical mechanism that disturbs the morphology of (spiral) galaxies may also directly enhance AGN activity. Alexander & Hickox (2012; and references therein) give a review of how the AGN central engines can grow, such as via direct galaxy mergers. For a mechanism such as galaxy-galaxy harassment (Moore et al. 2006), AGN may trace galaxy interactions and constitute a smoking-gun for galaxy evolution (see also Lake et al. 1998). The establishment of a link between AGN incidence and environment is still in the balance, however. Whilst some researchers contend that AGN incidence is affected by environment (Kauffmann et al. 2004; Ruderman & Ebeling 2005; Popesso & Biviano 2006; Gilmour et al. 2007; Constantin et al. 2008; Sivakoff et al. 2008; Montero-Dorta et al. 2009; Gavazzi et al. 2011) and there may be a ‘Butcher-Oemler AGN effect’ (Eastman et al. 2007; Aird et al. 2012), others come to the opposite conclusion (Miller et al. 2003; Martini et al. 2007; Georgakakis et al. 2008; Sivakoff et al. 2008; Pasquali et al. 2009; Haggard et al. 2010; von der Linden et al. 2010; Atlee et al. 2011).
It is under these considerations that we herein present an analysis of the galaxy population of Abell 1691 based on Sloan Digital Sky Survey data (Abazajian et al. 2009). Abell 1691 is an intermediate X-ray luminosity cluster ( ergs-1; Ebeling et al. 2000; see Jensen & Pimbblet 2012 for an introduction to our intermediate studies) and as such, may not constitute as extreme an environment as higher X-ray luminosity clusters that have been studied in detail and extensively elsewhere (Pimbblet et al. 2006). For example, Jensen & Pimbblet (2012) find that the modal colour of red sequence galaxies in intermediate X-ray luminosity clusters at is less than for higher X-ray luminosity (i.e. higher mass) galaxy clusters (Pimbblet et al. 2006). The reason for selecting Abell 1691 for a single-case study is that it contains a large number of spectroscopically confirmed redshifts within (see Section 3 below, and Jensen & Pimbblet 2012) and is a relatively under-studied cluster in the literature but representative of the intermediate ranges investigated in our previous work (Jensen & Pimbblet 2012).
The datasets that we use in this work are described in Section 2. We begin our analysis of Abell 1691 in Section 3 by determining cluster membership from a gapping approach and searching for any large-scale sub-structuring. In Section 4, we examine how the cluster environment affects active galactic nuclei cluster members. We complement this with an analysis of the colour-magnitude relation of the cluster in Section 5. In Section 6 we apply a spectroscopic classification scheme to the cluster members to examine the duty cycle of the cluster’s galaxies. This is complemented with an investigation of the environment of red and passive spiral galaxies. In Section 7 we determine how mass drives AGN fraction, blue fraction and spectroscopic duty cycle before summarizing our main conclusions in Section 8.
Throughout this work, we adopt a standard, flat cosmology with , and km s-1 Mpc-1 (Spergel et al. 2007).
2 Dataset
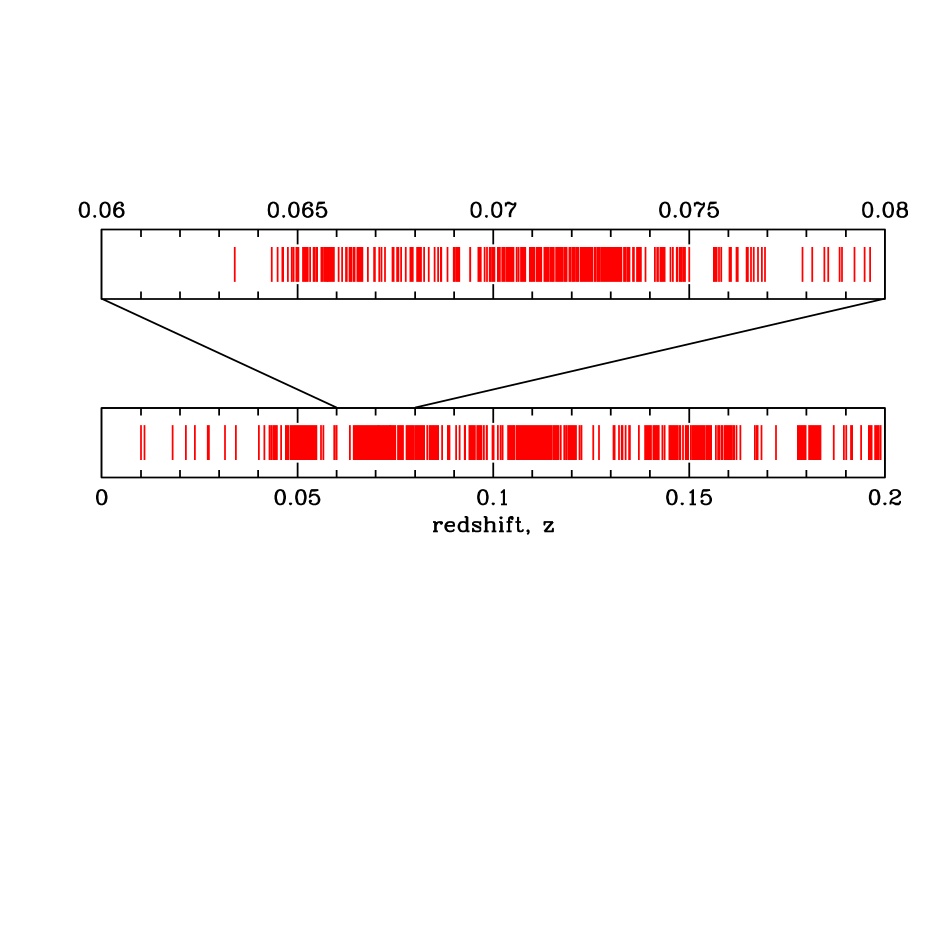
In this work, we make use of SDSS Data Release 7 (Abazajian et al. 2009). We download all galaxies that have had spectroscopic observations taken within 2 degrees of the nominal cluster centre of Abell 1691 (as specified by the NASA Extra-galactic Database; NED). We note that the SDSS spectroscopy aims to be 100 per cent complete down to a magnitude limit of for all sky areas (Strauss et al. 2002). This magnitude limit corresponds to at the redshift of the cluster. In reality, the target selection may not be 100 per cent spectroscopically complete due to the limitations of how close pairs of spectra can be observed (Blanton et al. 2003). The interlacing of latter spectroscopic observations may recover some of these collision limitations, but the final completeness requires investigation (Fig. 1).
At various points in the subsequent analysis we restrict ourselves to to maximize the number of redshifts we work with and probe down to a mass of log(stellar mass) (where stellar mass has units of solar masses throughout this work). We evaluate how complete we are at these magnitudes by determining the fraction of spectroscopic targets that are observed by SDSS and generate a successful redshift compared to how many are potentially available for spectroscopic observation in Fig. 1. We find that at , we are per cent complete. To evaluate how complete we are in stellar mass for this sample, we construct histograms of stellar mass and fit a log-linear relation to the range 11log(stellar mass)10.5 (where we anticipate being per cent complete) and extrapolate to lower masses. We find that our catalogue is per cent complete at log(stellar mass). We contend that these limits in apparent band magnitude and stellar mass are more than satisfactory for the purposes of the present work.
In addition, we marry the dataset up with line measurements derived by Tremonti et al. (2004) to provide equivalent width values for important spectral lines that we use in this work and star formation rates from Brinchmann et al. (2004). This is supplemented by morphological data from the Galaxy Zoo project (Lintott et al. 2008; 2011). In brief, Galaxy Zoo is an online ‘citizen science’ undertaking that invites members of the public to morphologically classify SDSS galaxies in to several categories. The classifications agree with professional astronomers to an accuracy of better than 90 per cent (Lintott et al. 2008). That said, we caution that the resolution of Galaxy Zoo may cause a blending of some classes (particularly at the Sa/S0 borderline; cf. Andreon & Davoust 1997). Given these caveats and the fact that the Galaxy Zoo morphologies compare well with various external datasets (Lintott et al. 2008), we limit ourselves in this work to dividing our galaxies in to three categories: spiral, elliptical and uncertain from Galaxy Zoo.
3 Cluster Membership
Cluster membership for Abell 1691 is determined from the SDSS spectroscopy (Fig. 2). There are a number of techniques for defining cluster membership from such data, but one of the most widely used and simplest is a sigma-clipping (or ‘gapping’) approach (Yahil & Vidal 1977; Zabludoff, Huchra & Geller 1990; see also Pimbblet et al. 2006). This approach takes the redshift distribution and applies a sensibly-chosen upper and lower bound to the region of interest (upper panel of Fig. 2). The mean and standard deviation of these galaxies is then computed. Any galaxy found to be beyond of the mean is then eliminated from the sample. The process is then iterated.

At and there appear gaps in the redshift distribution which we use as our first estimate of the upper and lower bounds for the cluster. Applying the clipping technique, we find that kms-1 with kms-1 where the errors are obtained from the method of Danese, De Zotti & di Tullio (1980).
However, a closer examination of the redshift distribution (Fig. 2) suggests that there may be a foreground structure at which may not be part of the cluster proper. Consequentially, if we choose a new lower bound of , we obtain kms-1 with kms-1. These two approaches clearly result in significantly different values of mean cluster redshift and velocity dispersion. To resolve which value we should adopt, we consider two factors: firstly, whether the foreground structure is coherent (e.g. an infalling group or sub-cluster) and secondly, an examination of cluster scaling relationships (Popesso et al. 2005).
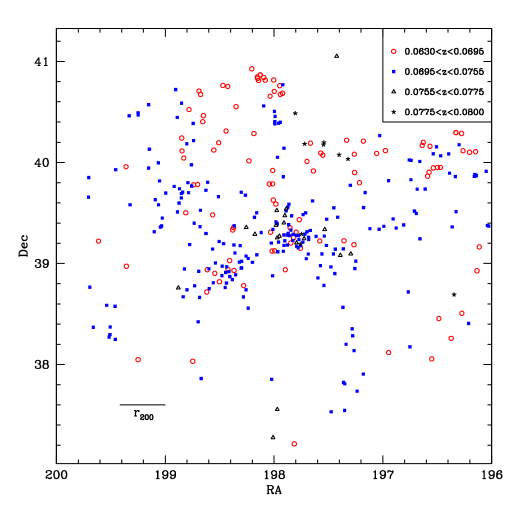
For the first consideration, we create a map of RA versus Dec (Fig. 3) and examine it for any structure in redshift bands suggested to us by Fig. 2. This suggests that the foreground redshift peak is smeared over the sky and does not represent a group or cluster in its own right (in contrast with Abell 1691 itself which is revealed as a strong over-density in the centre of this plot, with a significant secondary peak Eastward of the centre and filaments radiating outward).
For the second consideration, we note that the X-ray luminosity of A1691 is ergs-1 in the ROSAT 0.1–2.4 keV band (Ebeling et al. 2000). Popesso et al. (2005) notes that for all galaxies in a given cluster (i.e. not just red early-types). When we plug in our two values for in to the above equation, it yields ergs-1 for kms-1, and ergs-1 for kms-1. Interestingly, the measured value for lies between these two values. To resolve this, we note that Popesso et al. (2005) quotes the 95% confidence level on the scatter of the intercept of this relationship as 0.80. This generates a 95% confidence interval of ergs-1 for kms-1 and ergs-1 for kms-1. This, coupled with Fig. 3, suggests to us that the better redshift interval to derive the cluster parameters from is and therefore we adopt kms-1 and kms-1 for Abell 1691.
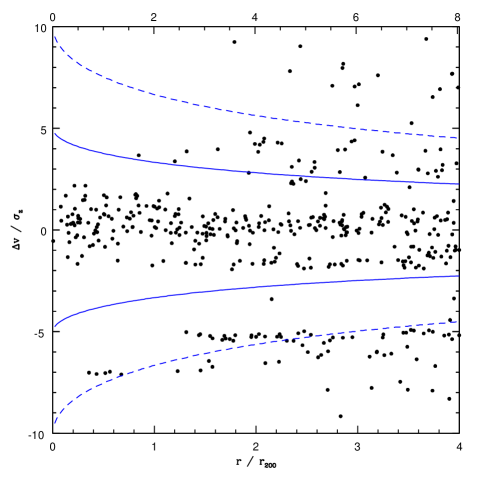
To check these findings, we finally construct a phase-space diagram (Fig. 4) of velocity versus distance from the centre of the cluster for all galaxies in our magnitude-limited sample using the cluster mass model of Carlberg, Yee and Ellingson (1997). In this, we see that the foreground structure noted above () mixes with the higher redshift range () at most radii from the cluster centre and, moreover, is well contained within the caustic contour from the Carlberg et al. (1997) mass model. We therefore adopt our final definition of cluster members as being those galaxies contained within these limits. This yields a total of 342 galaxies for our study.
3.1 Sub-structure
Although the cluster appears moderately smooth (with a moderate secondary overdensity eastward of the centre; Fig. 3), we aim to ascertain if there is bona-fide sub-structure contained within it. We firstly turn to ROSAT X-ray imaging of the galaxy cluster (Fig 5) to check if the cluster is experiencing any overt signs of recent interactions (cf. Owers et al. 2009; Oemler et al. 2009). The lack of substructure, coupled with regular (i.e. roughly circular), contours indicates that Abell 1691 is a virialized system that hasn’t had any recent perturbation from (e.g.) an infalling system of comparable mass. But would we be able to detect sub-structure in this X-ray image? Firstly, we note that spatial resolution of ROSAT PSPC is at 0.93 keV which translates to kpc at the redshift of A1691. This is approximately the diameter of a single galaxy, hence we believe that ROSAT has sufficient spatial resolution to resolve sub-structures at the redshift of A1691. Secondly, although there is scatter in the -mass relationship (Popesso et al. 2005), we note from Fig. 1 of Jensen & Pimbblet (2012) that we would be able to detect clusters down to ergs-1 from ROSAT. We explicitly note that that does not preclude a cluster of equal mass being present in our sample, but we regard it as unlikely.
To address this question of substructure further, we apply the Dressler & Shectman (1988; DS) sub-structure test to our dataset. This test is the most sensitive available to detect sub-structure in the literature (Pinkney et al. 1996). It works by calculating the mean local velocity () and local velocity standard deviation () of a given galaxies nearest neighbours (where is chosen to be the 10 nearest neighbours). To determine if there exists significant sub-clustering, these values are compared to the parent cluster’s mean velocity and such that:
| (1) |
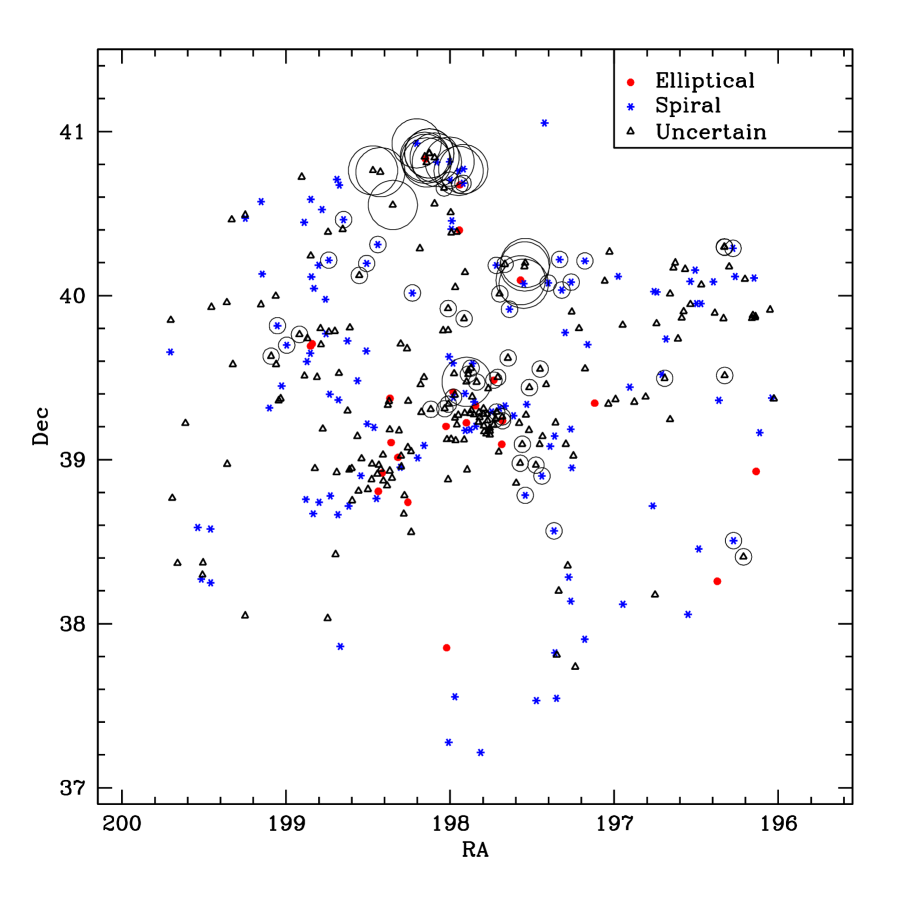
where is a measure of the deviation of the individual galaxy. The parameter of merit, , is then the summation of all terms in the cluster. This is compared to a Monte Carlo re-simulation of the cluster wherein the velocities are randomly re-assigned to each galaxy to generate and thereby estimate the confidence level that the cluster contains sub-structure. For Abell 1691, we find that suggesting it has significant sub-structuring. This can be seen in Fig. 6 where we plot circles on the basis of a galaxies’ value – overlapping large circles in close proximity are therefore logically interpreted as sub-structure (see DS).
Although the cluster core (deg) is largely free of sub-clustering, we see that there is a significant grouping to the North of the main cluster overdensity (RA, Dec40.8). We perform a search of the NASA Extra-Galactic Database (NED) to attempt to identify this. The best match is cluster entry number 632 from Yoon et al. (2008; redshift , at from the mean redshift of Abell 1691). This group is therefore probably a minor infalling group to Abell 1691 that has been picked up by the DS algorithm.
Also apparent from Fig. 6 and Fig. 3 are several (arguably 3 or 4) filaments that link to the core of Abell 1691 – particularly the eastern extension of the cluster core. Given the velocity dispersion of the cluster, it is not unexpected to see this many filaments connecting to it (Pimbblet et al. 2004).
4 AGN
We now turn to the active galaxy population. To determine which cluster members are AGN, we make use of a BPT diagram (Baldwin, Phillips & Terlevich 1981). By plotting flux ratio [OIII]/H against [NII]/H, Baldwin et al. (1981) are able to effectively separate AGN from star-forming galaxies. Implicitly, the use of the BPT diagram means that we are identifying type 2 AGN (those AGN that are obscured by a dusty circumstellar medium and give rise to strong narrow emission lines) rather than type 1 AGN (a direct view of the broad line region). We check this is true by confirming that all galaxies classed as AGN by the BPT diagram have an SDSS spectroscopic classification of ‘galaxy’ (as opposed to ‘qso’).
In Fig. 7 we show the BPT diagram for our cluster members that have S/N in the requisite lines. To split the AGN from star-forming galaxies, we use the Kauffmann et al. (2003; see also Stasińska et al. 2006; Brinchmann et al. 2004; Kewley et al. 2001; Veilleux & Osterbrock 1987) relation for AGN: . Although we could extend our analysis to weaker AGN classes and ‘retired’ AGN (Cid Fernandes et al. 2010), we elect to stick with the Kauffmann et al. approach due to its wider adoption in the literature. We also draw on the definitions of Seyferts and LINERs (see Kauffmann et al. 2003; Ho, Filippenko & Sargent 1997). Our BPT diagram is typical of the general galaxy population, including a LINER galaxy with an elliptical morphology (cf. Heckman 1980). A visual check of the SDSS imaging confirms the Galaxy Zoo morphology class: this galaxy is indeed an early-type (possibly S0).

Is the number of AGN that we find in Abell 1691 typical? To address this question, we note that Popesso & Biviano (2006) make a study of several hundred galaxy clusters and find that the fraction of AGN anti-correlates with . Explicitly, they report that (Popesso & Biviano 2006). This equation predicts an AGN fraction of 0.07 for A1691 using kms-1, and 0.22 using kms-1 (see above for the derivation of these two values of ). We note their definition of the fraction of AGN contained in a cluster is the number of AGN divided by the total galaxy population within and brighter than . We compute from Girardi et al. (1998): Mpc. At the mean redshift of Abell 1691, this radius corresponds to 25 arcmin. For convenience (and to be in-line with the calculation of , below) we stick to our magnitude limit of . We obtain (where the quoted error is simply a Poissonian error). This fraction is consistent with the (anti-correlation) equation reported by Popesso & Biviano (2006; above) that predicts for our cluster if we adopt kms-1, and is more than away from the AGN fraction predicted for kms-1. Therefore this firms our above argument that kms-1 is the correct velocity dispersion for the cluster.
5 Colour-magnitude relation
On a colour-magnitude plane, a galaxy cluster exhibits a strong correlation for its early-type members: the so-called red sequence (e.g. Visvanathan & Sandage 1977; Bower, Lucey & Ellis 1992). Fig. 8 displays the r vs. (g-r) colour-magnitude diagram for cluster members within of the cluster centre. We fit the red sequence as per Jensen & Pimbblet (2012), using the Lorentzian merit function minimized using the Nelder-Mead down-hill simplex algorithm (Press et al. 1992). The scatter in the intercept of the red sequence fit is displayed as parallel lines around the red sequence fit in Fig. 8, along with the Galaxy Zoo morphology classifications and identified AGN.

We use Fig. 8 to define the blue fraction () of galaxy cluster members in an analogous way to Butcher & Oemler (1984). Formally, Butcher & Oemler defined to be the fraction of galaxies that are brighter than and have a rest-frame colour that is 0.2 in (B-V) bluer than the fitted colour-magnitude relation. However, since we are only interested in comparing relative values (rather than comparing to external works), we simplify this definition for our convenience by defining to be those galaxies 0.2 in (g-r) bluer than the fitted red sequence as our definition of blue. For the magnitude limit, we convert to -band using one of the stellar magnitude conversions presented in Jester et al. (2005): and assuming a ‘typical’ colour for our galaxies (namely the red sequence colour at ). This gives a limit of . This is fainter than our r-band selection limit for our sample and we therefore use all galaxies in our sample for calculations, below. Additionally, we note that this is an invalid conversion since we have not used point sources and made assumptions about the typical galaxy colour. We re-emphasize that we are only interested in the relative trend within our own dataset rather than an absolute comparison to external datasets and therefore our approach is sound for this purpose.
In Fig. 9 we plot the variation of , by our definition, with radius from the cluster centre. We complement this trend with the radial variation of (as defined in Section 4). The trend in is to increase away from the cluster core, but for , it looks reasonably flat until a very high radius from the cluster centre; and even there the trend is not significant. The best statement we can make is that the cluster core appears hostile to both bright blue galaxies and active galaxy types.

Many other authors have previously noted the lack of bright blue galaxies in the cores of clusters and the (weak) radial trend for (Raichoor & Andreon 2012a; Li et al. 2009; Tran et al. 2005; Dahlén et al. 2004; Dahlén, Fransson & Näslund 2002; Kodama & Bower 2001; see also Chung et al. 2011 who notes that ‘the fraction of star-forming galaxies increases with cluster radius but remains below the field value even at ’) for a given absolute magnitude limit used to define the Butcher-Oemler effect. Our results for Abell 1691 support these previous works and add weight to the arguments presented elsewhere (Wilman, Zibetti, & Budavári 2010; Wetzel, Tinker & Conroy 2012; Hou et al. 2012) that the red galaxy fraction (i.e. ) correlates with environment only up to Mpc away from the cluster core. A tantalizing facet of Fig. 9 is the upturn of at 2–3 Mpc from the cluster core. Although statistically not significant, we note that this radius is about the same seen by Porter et al. (2008) who report a fractional enhancement in star-bursting galaxies at these radii along filaments of galaxies. We therefore hypothesize that this maxima is a reflection of this enhanced star-formation rate seen by Porter et al. (2008) and probably caused by first-time harassment (Moore et al. 1996) of galaxies within those filaments. A much larger sample of galaxy clusters will be required to probe this blue fraction enhancement and definitively ascertain whether such an enhancement is significant.
The radial variation for has also been noted by other authors (Hwang et al. 2012; Gilmour et al. 2007; Johnson, Best & Almaini 2003; Kauffmann et al. 2003), but there are yet others who suggest that the AGN distribution may be flat (as we find out to several Mpc), or even concentrated toward the cluster centres (Branchesi et al. 2007; Martini et al. 2007; Ruderman & Ebeling 2005). Our results support a mild increase in AGN fraction at large radii away from the cluster centre, but otherwise suggest a flat distribution. This result supports the notion that AGN incidence may be driven by galaxy-galaxy interactions when there is an available gas supply to fuel the AGNs.
6 Spectroscopic classification
We further quantify the galaxy population by classifying the cluster members on the basis of the line strengths of two key diagnostic features: and [OII] (Poggianti et al. 1999; Dressler et al. 1997; see also Pimbblet et al. 2006). In combination, these two lines can successfully discriminate between a number of important stages in galaxy evolution, including the E+A phase (i.e. strong absorption coupled with a lack of current star formation as indicated by a lack of [OII] emission). Although we could have used as our indicator of present star-formation, we elect to employ this classification scheme to be in-line with previous studies. A summary of the classification scheme along with its broad interpretations is presented in Table 1.

| Class | Definition | Interpretation |
|---|---|---|
| k | EW() and EW([OII]) | Passive: star-formation ceased several Gyr ago. |
| k+a | EW() and EW([OII]) | Post-starburst: a young population of A-stars with no present star-formation. |
| e(c) | EW() and EW([OII]) | Star-forming galaxy; similar to a present day, steadily star-forming, spiral galaxy. |
| e(a) | EW() and EW([OII]) | Recent, strong star-burst galaxy whose star-formation rate is falling back down. |
| e(b) | EW([OII]) | On-going star-burst. |
In Fig. 10 we display the spectroscopic classifications of cluster members split by radial bin from the cluster core. As would be expected, the passive k-type galaxies dominate at the cluster core (Table 2) and gradually fall-off with increasing radius away from the cluster centre (indeed, the outermost radial bin may be regarded as the ‘field’ value). The values for the total emission classes versus non-emission classes are very comparable to the values reported by Pimbblet et al. (2006) for massive, highly X-ray luminous clusters (a non-emission class fraction of 0.82 within and 0.74 beyond ) which are in turn a higher fraction than high redshift massive clusters (Poggianti et al. 1999).
| Class | ||||
|---|---|---|---|---|
| k | ||||
| k+a | ||||
| e(c) | ||||
| e(a) | ||||
| e(b) | nil | nil | ||
| Emission Classes | ||||
| Non-emission Classes |
6.1 Red and passive spirals
Figures 8 and 10 contain a number of spiral galaxies that are red and (or) passive. Since spiral galaxies possess young stellar populations, the existence of these red spiral galaxies is potentially, at first glance, surprising. However, the colour of a galaxy and its morphology are likely to be driven by different mechanisms: the colour is a reflection of the recent star-formation history (say, within the past Gyr) whilst the morphology is more sensitive to recent kinematic or dynamical events in the galaxies’ life (cf. Boselli & Gavazzi 2006). Red and passive spiral galaxies within clusters may therefore represent an important, but brief, transition phase in the life of a galaxy: a point at which its star-formation rate has been truncated (or all the star-forming gas has been used up) but it is yet to undergo significant morphological transformation to an S0 or elliptical morphology (Goto et al. 2003b; Moran et al. 2006; Wolf et al. 2009; Bundy et al. 2010; Lee et al. 2010; Masters et al. 2010; see also Mahajan & Raychaudhury 2009; Ishigaki et al. 2007).
To investigate the relation of red, passive spiral galaxies with environment, we now extract them from our catalogue using the following criteria: (i) they must be of the ‘k’ spectroscopic class (Table 1); (ii) they must be spiral as defined by Galaxy Zoo; (iii) they must be photometrically red – within the dotted parallel lines that represent the scatter of the colour-magnitude relation’s fitted intercept displayed on Fig. 8. This yields 18 red and passive spiral galaxies cluster members within . Within , 5/15 sprial galaxies are red and passive (). This changes to 13/81 () between and . Expressed as a fraction of the total cluster population, the red and passive spiral galaxies constitute a fraction of at all radii. This suggests a lack of significant environmental dependence for the location of red and passive spiral galaxies and agrees with Masters et al. (2010) who note that although red spirals may prefer intermediate environs, ‘environment alone is not sufficient to determine if a galaxy will become a red spiral’. Gallazzi et al. (2009) argue that red star-forming galaxies seem ubiquitous at all galaxy densities. Given the relationship between radius and density for cluster galaxies, this supports our result of a none varying fraction of red passive sprirals with radius. This means that an environmental mechanism such as harassment may not be required to explain such galaxies: a quenching event followed by a slow morphological transformation is likely to be sufficient to cause these observations (Wolf et al. 2009). This supports Bamford et al. (2009) who argue that the timescale for morphological transform is longer than that for colour transform on the basis of an environmental dependence with galaxy colour at fixed morphology from Galaxy Zoo (Lintott et al. 2008).
7 Mass Relationships
The above analysis has considered the relationship between various parameters, such as AGN fraction, to environment – proxied as the distance from the cluster centre111Distance to the cluster centre can also be considered a temporal measure – i.e. the time since infall (Gao et al. 2004); but such a signal may be contaminated (e.g. Pimbblet 2011).. To better explore the covariance of environment and galaxy mass, we now re-do that above analysis but use galaxy stellar mass as our primary abscissa. We obtain the galaxy stellar mass for our cluster members from the SDSS value-added catalogue (see www.mpa-garching.mpg.de/SDSS/DR7/Data/stellarmass.html). Although the original stellar mass estimates by Kauffmann et al. (2003b) are based on the EW of and the D4000 Angstrom break, the data used here is based on the fit to the SDSS photometry which, like Kauffmann et al. (2003b), uses a large set of Bruzual & Charlot (2003) models to derive its output. The distributors of the dataset note that there are some differences to the line index fit derived stellar masses of Kauffmann et al. (2003b), including better accuracy at lower masses (see: www.mpa-garching.mpg.de/SDSS/DR7/mass_comp.html). We therefore contend that these masses should be more than robust enough for our purposes of correlating AGN fraction (etc.) with mass.
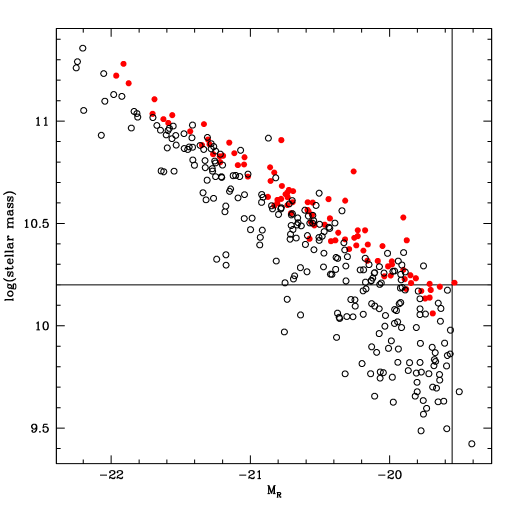
Before we repeat the above analysis for and using galaxy stellar mass (as above), we must guard against the selection bias of having a top-end mass limit with a low-end -band magnitude limit (cf. Holden et al. 2007). We therefore construct a mass versus absolute magnitude diagram and find the mass limit at which we are complete for the reddest galaxies (i.e. colour-magnitude red sequence galaxies) and the absolute magnitude limit corresponding to at the mean cluster redshift (Fig. 11). These limits are log(stellar mass)=10.2 and respectively and we only use galaxies more massive and brighter than these limits (Fig. 11) in the subsequent analysis. This ensures that we will be complete for these galaxies, regardless of star formation history.
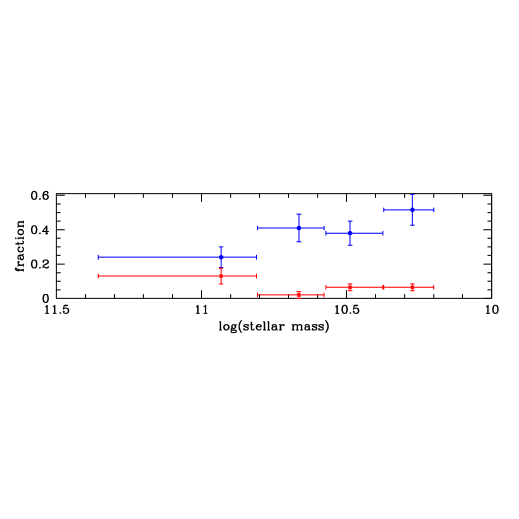
The results are displayed in Fig. 12. There are two striking features about this plot. Firstly the blue fraction, , appears to be primarily driven by low stellar mass galaxies (log(stellar mass)). The difference between the lowest mass bin and the highest is significant at a level for . Although the trend in AGN fraction suggests that is being driven by the higher mass regimes in agreement with previous works (Xue et al. 2010; Brusa et al. 2009) and unsurprising given that supermassive black holes are almost exclusively found in massive galaxies (Magorrian et al. 1998), our limited sample is only able to place a significance of on this trend. In both cases, these trends are much stronger than found in Fig. 9. The inference of this result for the Butcher-Oemler effect is that it is almost exclusively driven by lower mass (log(stellar mass)) galaxies. This is supported by Tajiri & Kamaya (2001) who contend that blue Butcher-Oemler galaxies are the less-massive cluster galaxies that also possess small (cluster frame) peculiar velocities and De Propris et al. (2003) who note that the Butcher-Oemler effect is primarily due to low-luminosity galaxies that are presently star-forming.
| Class | (stellar mass) | (stellar mass) | (stellar mass) |
|---|---|---|---|
| k | |||
| k+a | nil | ||
| e(c) | |||
| e(a) | nil | nil | |
| e(b) | nil | nil | |
| Emission Classes | |||
| Non-emission Classes |
In Table 3 we compute the spectroscopic classifications for our galaxies (as per Table 2), but split on galaxy mass using the bias corrected sample (Fig. 11). Immediately we see that the passive k types are dominant at the high mass regime (log(stellar mass)). This supports the notion that massive galaxies are mostly non-star-forming and dead, regardless of their environment. Meanwhile, of the emission line classes, the recent star-burst galaxies (e(a) types; but also see Poggianti et al. 2001 who suggest the e(a) class may include a significant contribution from on-going dust-enshrouded star-bursts) are exclusively found at lower mass regimes.
We now turn to the red and passive spiral galaxies in the bias corrected sample. Out of all spiral galaxies, we find that 6/37 () are red and passive at log(stellar mass)10.5, whereas this grows to 12/48 () at log(stellar mass)10.5. In terms of the whole galaxy population, these fractions become and respectively (where the errors are Poissonian). Although not highly significant (i.e. less than difference), this provides the tantalizing suggestion that the red and passive population is driven by higher mass rather than environment. This agrees with observations made by Masters et al. (2010) who show that red galaxies are predominantly massive galaxies, regardless of their morphology. Since Galaxy Zoo is limited to simply saying that a given galaxy is a spiral, hence a future line of investigation would be to determine the sub-class of spiral that these red and passive spirals are. We could then address whether earlier spirals (i.e. Sa) classes dominate the passive spiral fraction.
7.1 Velocity Dispersion Profiles

Pimbblet et al. (2006) notes that the velocity dispersion of different spectroscopic classifications of galaxies can vary strongly – the emission line galaxies tending to yield larger velocity dispersions at higher radii from the cluster centre. This ties in to work decades earlier by (e.g.) Rood et al. (1972) who note different profiles for red and blue galaxies. However, Pimbblet et al. make no comment about how galaxy mass may affect these profiles. Here, we compute the velocity dispersion profile () by mass for A1691 by following a method originally detailed by Bergond et al. (2006) for use with globular cluster systems that has since found adoption in application to galaxy clusters (Hou et al. 2012; 2009).
The method involves the use of a moving window (or kernel) that takes in to account the redshift measurements of all cluster members for each radial bin rather than simply using binned radii. The projected velocity dispersion profile is defined as:
| (2) |
where is the radius from the centre of the cluster, are the measured redshifts (or radial velocities), is the mean redshift of the cluster (as determined above) and is the weighting fuction such that:
| (3) |
where is the chosen width of the window (here, set to a constant value of 30 arcmin).
The resultant velocity dispersion profiles for high mass (log(stellar mass)10.7), low mass (log(stellar mass)10.5), and all cluster galaxies for our bias corrected sample is displayed in Fig. 13. To obtain uncertainties on these profiles, we take a Monte Carlo approach and bootstrap our samples 1000 times. The error bounds depicted in Fig. 13 are the standard deviations from these 1000 Monte Carlo trials.
To interpret Fig. 13, we note that a rising profile would be indicative of interacting systems (cf. Hou et al. 2009; Menci & Fusco-Femiano 1996) or a close neighbour (Girardi et al. 1996). In the case of Abell 1691, we see that the overall profile declines gently with radius. This underscores our earlier finding of little significant substructure inside our cluster. However, the velocity dispersion profiles of the high mass and low mass galaxies are notably different. The high mass galaxies demonstrate a steep decline with radius, to almost three-quarters their central value by . On the other hand, the lower mass galaxies show a mild increase to a local maxima in at before slowly declining again to their central levels. Significantly, the inner profiles for the high- and low-mass samples are different. One immediate inference is that these two different mass populations have had significantly different accretion histories on to the cluster’s potential – the higher mass ones in the centre perhaps being more recent arrivals due to their comparatively larger central . This may point to substructure in the high mass sample in the inner regions. Therefore, to test this, we run a DS test for the high mass galaxies within . We find , meaning that there is no significant substructure for the massive central galaxies. One alternative explanation is that the lower mass galaxies can have their profile flattened quicker than the higher mass galaxies following accretion on to the cluster. This would agree with the conclusions of Brough et al. (2008; see also Pimbblet 2008) who note that the timescale for new accretion on to the cluster potential is shorter than that required to relax multiple nuclei in brightest cluster galaxies; more massive galaxies would seem more able to retain a larger peculiar (to the cluster) velocity.
7.2 Filaments, Duty Cycles and Discussion
Filaments of galaxies have been noted in the literature as having a pre-processing role in the evolution of galaxies that are being funneled along them to the galaxy clusters that they inter-connect (e.g. Porter et al. 2008; Fadda et al. 2008; Koyama et al. 2008). We select three of the filaments leading off the core of A1691 by visual inspection of Fig. 3: one going North, in the direction of cluster candidate 632 of Yoon et al. (2008); the Eastward extension of A1691, and the thin curved filament heading broadly South from the cluster. We investigate these three filaments, both combined and as individual objects, for trends deviating from that of the cluster as a whole but are unable to find an excess of star-burst galaxies, post-star-burst galaxies (k+a types), emission line types, star formation rates, or specific star formation rates. On the surface, this is contrary to the results of Porter et al. (2008) and the IR study of Fadda et al. (2008). We note however, that the Porter et al. results concern inter-cluster filaments of a straight morphology. The only filament in our sample that could fall under that category in our sample is the one running to the North of the cluster core, in the direction of cluster candidate 632 of Yoon et al. (2008). Being of the order of 5 Mpc long, this one would have been excluded from the Porter et al. sample for being too short. There is potentially an interesting inference from this null result: that filaments need a sufficient mass to pre-process galaxies and cause the enhanced SF observed by Porter et al. A larger sample of weaker (i.e. lower mass) filaments will be able to resolve this in the future (e.g., using the GAMA dataset; Driver et al. 2011).
Taking the above results together, the duty cycle of lower mass galaxies appears to be distinct from higher mass ones (Haines et al. 2006; von der Linden et al. 2010; Oemler et al. 2009 and references therein). Haines et al. (2006) and von der Linden et al. (2010) both deduce a different environmental dependence for the star-formation of low versus high mass galaxies that we are able to test using the data for A1691. In Fig. 14, we compare the star-formation rates and specific star-formation rates of low mass (log(stellar mass)) and high mass (log(stellar mass) galaxies as a function of radius from the cluster centre for the mass-bias corrected sample.
The two different mass regimes have significantly different forms: the high mass galaxies plateau in both specific- and star formation rates at radii larger than whereas the lower mass galaxies follow a strong increasing trend. These results agree well with Haines et al. (2006) who notes that dwarf galaxies transition from being passive (i.e. rates consistent with massive galaxies) within , to highly star forming outside this radius.
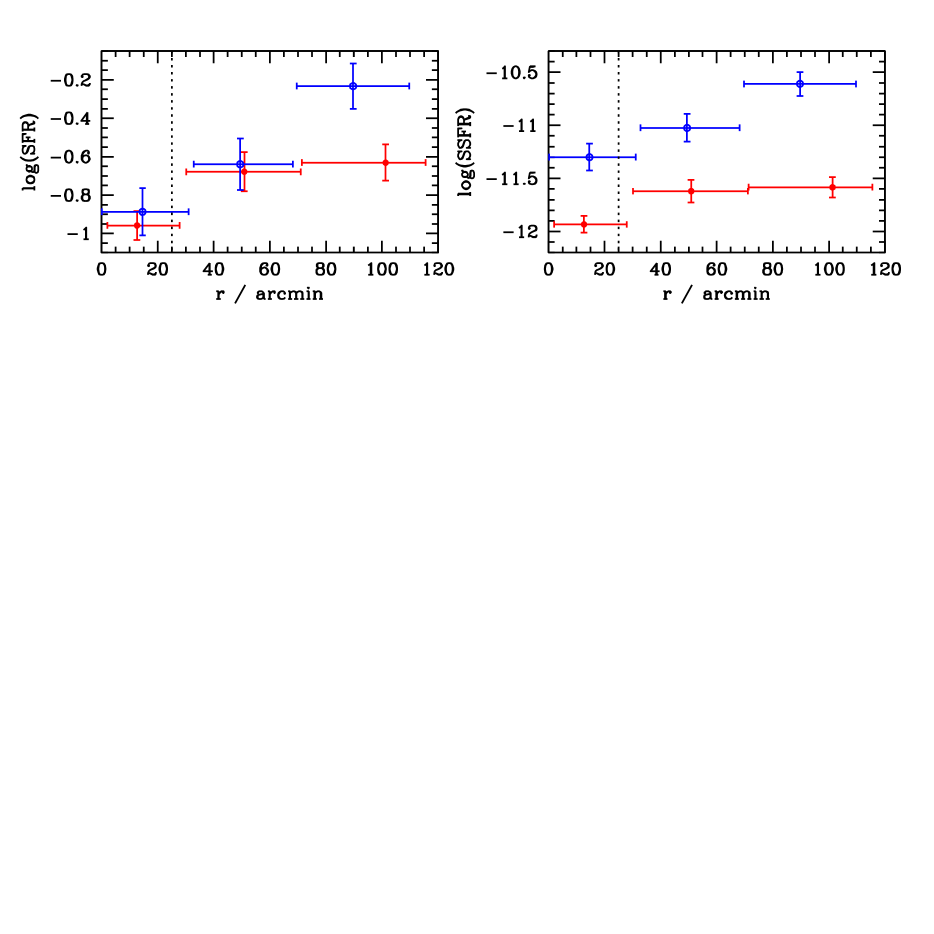
Therefore, the low mass galaxy population appear to undergo a starburst event at some distance from the cluster core (more likely a large radius), before fading in to a redder population (cf. Porter et al. 2008). This star-burst phase is likely to be at least partially (perhaps mainly) responsible for the Butcher-Oemler effect and therefore the effect may simply measure how efficiently low mass galaxies are being processed by the cluster environment at this redshift222This ties in to the idea of down-sizing (Cowie et al. 1996). At higher redshifts, it may be the case that more massive galaxies will be driving the Butcher-Oemler effect, but such a hypothesis requires further testing and discussion (see, e.g., Raichoor & Andreon 2012a,b; De Propris et al. 2003), which is beyond the scope of this single-cluster, low redshift study.. As low mass galaxies approach the cluster core, their star-formation has likely been shut down and they will readily be undergoing morphological transformation (although the timescale for morphological transform will be different to star formation truncation and colour change). Those lower mass systems in the centre of the cluster have a much smaller velocity dispersion profile than the high mass ones (the inverse being true at larger radii). This suggests that the low mass galaxies at the outskirts have recently been accreted, whereas the those in the centre have had their velocity profile dampened more quickly relative to the massive galaxies that are better able to retain a higher peculiar velocity in the cluster frame.
Meanwhile for more massive galaxies, star formation appears to have been shut down a long time ago in the main part, but almost certainly shut down prior to morphological transformation and (potential) eventual merging with other red and dead cluster galaxies. Star-formation in massive galaxies (when it occurs) would therefore seem to be driven by the gas reserves of the galaxies rather than through a star-burst phase. We infer that the evolution of the massive galaxies is more gentle and slow affair compared to the brutal treatment of the low mass galaxies.
We terminate with a few caveats. There are implicit dangers in plotting various parameters as a function of distance from the cluster core due to the covariance of the changing morphological mixture of galaxies (Dressler 1980; see also Pimbblet et al. 2002; Andreon 2003), projection effects (Diaferio et al. 2001; Rines et al. 2005), as well as the existence of ‘backsplash’ populations – those galaxies that are on radial orbits that have visited the high density core regions of the cluster and subsequently been slung back to larger distances away from the centre (Pimbblet 2011; Gill, Knebe, & Gibson 2005). The latter two in particular may be problematic. In the case of the former, star-forming galaxies that are close to the cluster core may simply be interlopers. This means that the fractions of star-forming galaxies presented in Table 2 should be regarded as upper limits at small distances from the cluster centre. Secondly, the backsplash population can cause any gradient with distance from the cluster centre to be dampened or smeared in relation to a full three-dimensional treatment (Atlee & Martini 2012; Ellingson et al. 2001; Balogh, Navarro & Morris 2000) which would render the points further away from the cluster core in Fig. 9 as lower limits.
8 Conclusions
We have presented an investigation of the galaxy population of Abell 1691,
an intermediate X-ray luminosity cluster from SDSS data. Our main conclusions
can be stated as follows.
We have determined new global parameters for Abell 1691, including recession
velocity ( kms-1) and velocity dispersion
( kms-1). The cluster is morphologically
relaxed in its core regions, with no significant substructure within and
is ‘fed’ by multiple filaments of galaxies within which a number of sub-groups reside.
We identify AGN from a BPT diagram and show that the cluster AGN fraction
increases with radius from the cluster centre and is mostly driven by massive
(log(stellar mass)) galaxies.
The blue fraction of the cluster population also increases with radius away
from the centre but is driven by lower mass galaxies
(log(stellar mass)).
Emission line galaxies follow a similar pattern. Moreover,
the emission line galaxies are found to be driven by low mass galaxies in
the cluster (especially
the recently star-bursting e(a) class). This suggests that some low mass galaxies
star-burst as they are accreted on to the cluster before fading to redder colours
and having their morphologies transformed.
Accordingly, we suggest that the Butcher-Oemler effect could therefore
be a consequence of mass selection effects.
Massive galaxies are predominantly red, occupy the centre of the cluster,
are non-star-forming,
have a different velocity dispersion profile to other cluster galaxies,
and are likely to have had a significantly different duty
cycle compared to the bluer galaxies. We have investigated the environment and mass of
red and passive spiral galaxies
(which are likely to be a transition class object) and show that they are also driven
by mass but do not have a preferential position (environment) within the cluster.
This paper follows Jensen & Pimbblet (2012) and is our second paper examining the ‘environment’ of intermediate galaxy clusters.
Acknowledgements
We would like to thank Heath Jones, Matt Owers, Stefano Andreon, Samantha Penny and Tim Dolley for helpful discussion during the course of this work. KAP thanks Iris Pimbblet for inspiration. We are also particularly grateful to the anonymous referee for her/his feedback that significantly improved the science presented in this work.
Figure 5 was produced using the karma toolkit (Gooch 1996).
Funding for the SDSS and SDSS-II has been provided by the Alfred P. Sloan Foundation, the Participating Institutions, the National Science Foundation, the U.S. Department of Energy, the National Aeronautics and Space Administration, the Japanese Monbukagakusho, the Max Planck Society, and the Higher Education Funding Council for England. The SDSS Web Site is http://www.sdss.org/.
The SDSS is managed by the Astrophysical Research Consortium for the Participating Institutions. The Participating Institutions are the American Museum of Natural History, Astrophysical Institute Potsdam, University of Basel, University of Cambridge, Case Western Reserve University, University of Chicago, Drexel University, Fermilab, the Institute for Advanced Study, the Japan Participation Group, Johns Hopkins University, the Joint Institute for Nuclear Astrophysics, the Kavli Institute for Particle Astrophysics and Cosmology, the Korean Scientist Group, the Chinese Academy of Sciences (LAMOST), Los Alamos National Laboratory, the Max-Planck-Institute for Astronomy (MPIA), the Max-Planck-Institute for Astrophysics (MPA), New Mexico State University, Ohio State University, University of Pittsburgh, University of Portsmouth, Princeton University, the United States Naval Observatory, and the University of Washington.
This research has made use of the NASA/IPAC Extragalactic Database (NED) which is operated by the Jet Propulsion Laboratory, California Institute of Technology, under contract with the National Aeronautics and Space Administration.
References
- [\citeauthoryearAbazajian et al.2009] Abazajian K. N., et al., 2009, ApJS, 182, 543
- [\citeauthoryearAbraham et al.1996] Abraham R. G., et al., 1996, ApJ, 471, 694
- [\citeauthoryearAird et al.2012] Aird J., et al., 2012, ApJ, 746, 90
- [\citeauthoryearAlexander & Hickox2012] Alexander D. M., Hickox R. C., 2012, NewAR, 56, 93
- [\citeauthoryearAndreon & Davoust1997] Andreon S., Davoust E., 1997, A&A, 319, 747
- [\citeauthoryearAndreon & Ettori1999] Andreon S., Ettori S., 1999, ApJ, 516, 647
- [\citeauthoryearAndreon2003] Andreon S., 2003, A&A, 409, 37
- [\citeauthoryearAndreon et al.2006] Andreon S., Quintana H., Tajer M., Galaz G., Surdej J., 2006, MNRAS, 365, 915
- [\citeauthoryearAtlee et al.2011] Atlee D. W., Martini P., Assef R. J., Kelson D. D., Mulchaey J. S., 2011, ApJ, 729, 22
- [\citeauthoryearAtlee & Martini2012] Atlee D. W., Martini P., 2012, ApJ, submitted (arXiv:1201.2957)
- [\citeauthoryearBaldry et al.2006] Baldry I. K., Balogh M. L., Bower R. G., Glazebrook K., Nichol R. C., Bamford S. P., Budavari T., 2006, MNRAS, 373, 469
- [\citeauthoryearBaldwin, Phillips, & Terlevich1981] Baldwin J. A., Phillips M. M., Terlevich R., 1981, PASP, 93, 5
- [\citeauthoryearBalogh & Morris2000] Balogh M. L., Morris S. L., 2000, MNRAS, 318, 703
- [\citeauthoryearBalogh, Navarro, & Morris2000] Balogh M. L., Navarro J. F., Morris S. L., 2000, ApJ, 540, 113
- [\citeauthoryearBalogh et al.2004] Balogh M. L., Baldry I. K., Nichol R., Miller C., Bower R., Glazebrook K., 2004a, ApJ, 615, L101
- [\citeauthoryearBalogh et al.2004] Balogh M., et al., 2004b, MNRAS, 348, 1355
- [\citeauthoryearBamford et al.2009] Bamford S. P., et al., 2009, MNRAS, 393, 1324
- [\citeauthoryearBergond et al.2006] Bergond G., Zepf S. E., Romanowsky A. J., Sharples R. M., Rhode K. L., 2006, A&A, 448, 155
- [\citeauthoryearBekki, Couch, & Shioya2001] Bekki K., Couch W. J., Shioya Y., 2001, PASJ, 53, 395
- [\citeauthoryearBekki, Couch, & Shioya2002] Bekki K., Couch W. J., Shioya Y., 2002, ApJ, 577, 651
- [\citeauthoryearBlanton et al.2003] Blanton M. R., Lin H., Lupton R. H., Maley F. M., Young N., Zehavi I., Loveday J., 2003, AJ, 125, 2276
- [\citeauthoryearBoselli & Gavazzi2006] Boselli A., Gavazzi G., 2006, PASP, 118, 517
- [\citeauthoryearBower, Lucey, & Ellis1992] Bower R. G., Lucey J. R., Ellis R. S., 1992, MNRAS, 254, 601
- [\citeauthoryearBranchesi et al.2007] Branchesi M., Gioia I. M., Fanti C., Fanti R., Cappelluti N., 2007, A&A, 462, 449
- [\citeauthoryearBrinchmann et al.2004] Brinchmann J., Charlot S., White S. D. M., Tremonti C., Kauffmann G., Heckman T., Brinkmann J., 2004, MNRAS, 351, 1151
- [\citeauthoryearBrough et al.2008] Brough S., Couch W. J., Collins C. A., Jarrett T., Burke D. J., Mann R. G., 2008, MNRAS, 385, L103
- [\citeauthoryearBrusa et al.2009] Brusa M., et al., 2009, A&A, 507, 1277
- [\citeauthoryearBruzual & Charlot2003] Bruzual G., Charlot S., 2003, MNRAS, 344, 1000
- [\citeauthoryearBundy et al.2010] Bundy K., et al., 2010, ApJ, 719, 1969
- [\citeauthoryearButcher & Oemler1978] Butcher H., Oemler A., Jr., 1978, ApJ, 226, 559
- [\citeauthoryearButcher & Oemler1984] Butcher H., Oemler A., Jr., 1984, ApJ, 285, 426
- [\citeauthoryearCalvi et al.2012] Calvi R., Poggianti B. M., Fasano G., Vulcani B., 2012, MNRAS, 419, L14
- [\citeauthoryearCarlberg, Yee, & Ellingson1997] Carlberg R. G., Yee H. K. C., Ellingson E., 1997, ApJ, 478, 462
- [\citeauthoryearChristlein & Zabludoff2005] Christlein D., Zabludoff A. I., 2005, ApJ, 621, 201
- [\citeauthoryearChung et al.2011] Chung S. M., Eisenhardt P. R., Gonzalez A. H., Stanford S. A., Brodwin M., Stern D., Jarrett T., 2011, ApJ, 743, 34
- [\citeauthoryearCid Fernandes et al.2010] Cid Fernandes R., Stasińska G., Schlickmann M. S., Mateus A., Vale Asari N., Schoenell W., Sodré L., 2010, MNRAS, 403, 1036
- [\citeauthoryearClemens et al.2006] Clemens M. S., Bressan A., Nikolic B., Alexander P., Annibali F., Rampazzo R., 2006, MNRAS, 370, 702
- [\citeauthoryearConstantin, Hoyle, & Vogeley2008] Constantin A., Hoyle F., Vogeley M. S., 2008, ApJ, 673, 715
- [\citeauthoryearCooper et al.2006] Cooper M. C., et al., 2006, MNRAS, 370, 198
- [\citeauthoryearCouch & Sharples1987] Couch W. J., Sharples R. M., 1987, MNRAS, 229, 423
- [\citeauthoryearCouch et al.1994] Couch W. J., Ellis R. S., Sharples R. M., Smail I., 1994, ApJ, 430, 121
- [\citeauthoryearCouch et al.1998] Couch W. J., Barger A. J., Smail I., Ellis R. S., Sharples R. M., 1998, ApJ, 497, 188
- [\citeauthoryearCowie et al.1996] Cowie L. L., Songaila A., Hu E. M., Cohen J. G., 1996, AJ, 112, 839
- [\citeauthoryearDahlén et al.2004] Dahlén T., Fransson C., Östlin G., Näslund M., 2004, MNRAS, 350, 253
- [\citeauthoryearDahlén, Fransson, Näslund2002] Dahlén T., Fransson C., Näslund M., 2002, MNRAS, 330, 167
- [Danese 1980] Danese L., de Zotti G., di Tullio G., 1980, A&A, 82, 322
- [\citeauthoryearDeng et al.2010] Deng X.-F., Wen X.-Q., Xu J.-Y., Ding Y.-P., Huang T., 2010, ApJ, 716, 599
- [\citeauthoryearDe Propris et al.2003] De Propris R., Stanford S. A., Eisenhardt P. R., Dickinson M., 2003, ApJ, 598, 20
- [\citeauthoryearDe Propris et al.2004] De Propris R., et al., 2004, MNRAS, 351, 125
- [\citeauthoryearDiaferio et al.2001] Diaferio A., Kauffmann G., Balogh M. L., White S. D. M., Schade D., Ellingson E., 2001, MNRAS, 323, 999
- [\citeauthoryeardi Serego Alighieri, Lanzoni, & Jørgensen2006] di Serego Alighieri S., Lanzoni B., Jørgensen I., 2006, ApJ, 647, L99
- [\citeauthoryearDressler1980] Dressler A., 1980, ApJ, 236, 351
- [\citeauthoryearDressler & Gunn1983] Dressler A., Gunn J. E., 1983, ApJ, 270, 7
- [\citeauthoryearDressler & Shectman1988] Dressler A., Shectman S. A., 1988, AJ, 95, 985
- [\citeauthoryearDressler et al.1997] Dressler A., et al., 1997, ApJ, 490, 577
- [\citeauthoryearDressler et al.1999] Dressler A., Smail I., Poggianti B. M., Butcher H., Couch W. J., Ellis R. S., Oemler A., Jr., 1999, ApJS, 122, 51
- [\citeauthoryearDressler et al.2004] Dressler A., Oemler A., Jr., Poggianti B. M., Smail I., Trager S., Shectman S. A., Couch W. J., Ellis R. S., 2004, ApJ, 617, 867
- [\citeauthoryearDressler et al.2009] Dressler A., Rigby J., Oemler A., Jr., Fritz J., Poggianti B. M., Rieke G., Bai L., 2009, ApJ, 693, 140
- [\citeauthoryearDriver et al.2011] Driver S. P., et al., 2011, MNRAS, 413, 971
- [\citeauthoryearEastman et al.2007] Eastman J., Martini P., Sivakoff G., Kelson D. D., Mulchaey J. S., Tran K.-V., 2007, ApJ, 664, L9
- [\citeauthoryearEbeling et al.2000] Ebeling H., Edge A. C., Allen S. W., Crawford C. S., Fabian A. C., Huchra J. P., 2000, MNRAS, 318, 333
- [\citeauthoryearEllingson et al.2001] Ellingson E., Lin H., Yee H. K. C., Carlberg R. G., 2001, ApJ, 547, 609
- [\citeauthoryearFabricant, Bautz, & McClintock1994] Fabricant D. G., Bautz M. W., McClintock J. E., 1994, AJ, 107, 8
- [\citeauthoryearFadda et al.2008] Fadda D., Biviano A., Marleau F. R., Storrie-Lombardi L. J., Durret F., 2008, ApJ, 672, L9
- [\citeauthoryearFisher et al.1998] Fisher D., Fabricant D., Franx M., van Dokkum P., 1998, ApJ, 498, 195
- [\citeauthoryearGallazzi et al.2009] Gallazzi A., et al., 2009, ApJ, 690, 1883
- [\citeauthoryearGavazzi, Savorgnan, & Fumagalli2011] Gavazzi G., Savorgnan G., Fumagalli M., 2011, A&A, 534, A31
- [\citeauthoryearGeorgakakis et al.2008] Georgakakis A., et al., 2008, MNRAS, 385, 2049
- [\citeauthoryearGill, Knebe, & Gibson2005] Gill S. P. D., Knebe A., Gibson B. K., 2005, MNRAS, 356, 1327
- [\citeauthoryearGilmour et al.2007] Gilmour R., Gray M. E., Almaini O., Best P., Wolf C., Meisenheimer K., Papovich C., Bell E., 2007, MNRAS, 380, 1467
- [\citeauthoryearGiodini et al.2012] Giodini S., et al., 2012, A&A, 538, A104
- [\citeauthoryearGirardi et al.1998] Girardi M., Giuricin G., Mardirossian F., Mezzetti M., Boschin W., 1998, ApJ, 505, 74
- [\citeauthoryearGirardi et al.1996] Girardi M., Fadda D., Giuricin G., Mardirossian F., Mezzetti M., Biviano A., 1996, ApJ, 457, 61
- [\citeauthoryearGómez et al.2003] Gómez P. L., et al., 2003, ApJ, 584, 210
- [\citeauthoryearGooch1996] Gooch R., 1996, ASPC, 101, 80
- [\citeauthoryearGoto et al.2003] Goto T., et al., 2003, PASJ, 55, 739
- [\citeauthoryearGoto et al.2003] Goto T., et al., 2003b, PASJ, 55, 757
- [\citeauthoryearGrützbauch et al.2011] Grützbauch R., Conselice C. J., Varela J., Bundy K., Cooper M. C., Skibba R., Willmer C. N. A., 2011, MNRAS, 411, 929
- [\citeauthoryearGunn & Gott1972] Gunn J. E., Gott J. R., III, 1972, ApJ, 176, 1
- [\citeauthoryearHaggard et al.2010] Haggard D., Green P. J., Anderson S. F., Constantin A., Aldcroft T. L., Kim D.-W., Barkhouse W. A., 2010, ApJ, 723, 1447
- [\citeauthoryearHaines et al.2006] Haines C. P., La Barbera F., Mercurio A., Merluzzi P., Busarello G., 2006, ApJ, 647, L21
- [\citeauthoryearHaines et al.2009] Haines C. P., et al., 2009, ApJ, 704, 126
- [\citeauthoryearHeckman1980] Heckman T. M., 1980, A&A, 87, 152
- [\citeauthoryearHeckman et al.2005] Heckman T. M., Ptak A., Hornschemeier A., Kauffmann G., 2005, ApJ, 634, 161
- [\citeauthoryearHenriksen & Byrd1996] Henriksen M., Byrd G., 1996, ApJ, 459, 82
- [\citeauthoryearHo, Filippenko, & Sargent1997] Ho L. C., Filippenko A. V., Sargent W. L. W., 1997, ApJS, 112, 315
- [\citeauthoryearHolden et al.2007] Holden B. P., et al., 2007, ApJ, 670, 190
- [\citeauthoryearHou et al.2012] Hou A., et al., 2012, MNRAS, 421, 3594
- [\citeauthoryearHou et al.2009] Hou A., Parker L. C., Harris W. E., Wilman D. J., 2009, ApJ, 702, 1199
- [\citeauthoryearHwang et al.2012] Hwang H. S., Park C., Elbaz D., Choi Y.-Y., 2012, A&A, 538, A15
- [\citeauthoryearIshigaki, Goto, & Matsuhara2007] Ishigaki M., Goto T., Matsuhara H., 2007, MNRAS, 382, 270
- [\citeauthoryearJensen & Pimbblet2012] Jensen P. C., Pimbblet K. A., 2012, MNRAS, 422, 2841
- [\citeauthoryearJester et al.2005] Jester S., et al., 2005, AJ, 130, 873
- [\citeauthoryearJohnson, Best, & Almaini2003] Johnson O., Best P. N., Almaini O., 2003, MNRAS, 343, 924
- [\citeauthoryearKauffmann et al.2003] Kauffmann G., et al., 2003, MNRAS, 346, 1055
- [\citeauthoryearKauffmann et al.2003] Kauffmann G., et al., 2003b, MNRAS, 341, 33
- [\citeauthoryearKauffmann et al.2004] Kauffmann G., White S. D. M., Heckman T. M., Ménard B., Brinchmann J., Charlot S., Tremonti C., Brinkmann J., 2004, MNRAS, 353, 713
- [\citeauthoryearKewley et al.2001] Kewley L. J., Dopita M. A., Sutherland R. S., Heisler C. A., Trevena J., 2001, ApJ, 556, 121
- [\citeauthoryearKodama & Bower2001] Kodama T., Bower R. G., 2001, MNRAS, 321, 18
- [\citeauthoryearKoyama et al.2008] Koyama Y., et al., 2008, MNRAS, 391, 1758
- [\citeauthoryearLake, Katz, & Moore1998] Lake G., Katz N., Moore B., 1998, ApJ, 495, 152
- [\citeauthoryearLavery & Henry1988] Lavery R. J., Henry J. P., 1988, ApJ, 330, 596
- [\citeauthoryearLarson, Tinsley, & Caldwell1980] Larson R. B., Tinsley B. M., Caldwell C. N., 1980, ApJ, 237, 692
- [\citeauthoryearLee et al.2010] Lee J. H., Lee M. G., Park C., Choi Y.-Y., 2010, MNRAS, 403, 1930
- [\citeauthoryearLewis et al.2002] Lewis I., et al., 2002, MNRAS, 334, 673
- [\citeauthoryearLi, Yee, & Ellingson2009] Li I. H., Yee H. K. C., Ellingson E., 2009, ApJ, 698, 83
- [\citeauthoryearLintott et al.2008] Lintott C. J., et al., 2008, MNRAS, 389, 1179
- [\citeauthoryearLintott et al.2011] Lintott C., et al., 2011, MNRAS, 410, 166
- [\citeauthoryearLubin1996] Lubin L. M., 1996, AJ, 112, 23
- [\citeauthoryearMa & Ebeling2011] Ma C.-J., Ebeling H., 2011, MNRAS, 410, 2593
- [\citeauthoryearMagorrian et al.1998] Magorrian J., et al., 1998, AJ, 115, 2285
- [\citeauthoryearMahajan & Raychaudhury2009] Mahajan S., Raychaudhury S., 2009, MNRAS, 400, 687
- [\citeauthoryearMahajan, Haines, & Raychaudhury2010] Mahajan S., Haines C. P., Raychaudhury S., 2010, MNRAS, 404, 1745
- [\citeauthoryearMargoniner et al.2001] Margoniner V. E., de Carvalho R. R., Gal R. R., Djorgovski S. G., 2001, ApJ, 548, L143
- [\citeauthoryearMargoniner & de Carvalho2000] Margoniner V. E., de Carvalho R. R., 2000, AJ, 119, 1562
- [\citeauthoryearMartini, Mulchaey, & Kelson2007] Martini P., Mulchaey J. S., Kelson D. D., 2007, ApJ, 664, 761
- [\citeauthoryearMasters et al.2010] Masters K. L., et al., 2010, MNRAS, 405, 783
- [\citeauthoryearMenci & Fusco-Femiano1996] Menci N., Fusco-Femiano R., 1996, ApJ, 472, 46
- [\citeauthoryearMiller et al.2003] Miller C. J., Nichol R. C., Gómez P. L., Hopkins A. M., Bernardi M., 2003, ApJ, 597, 142
- [\citeauthoryearMontero-Dorta et al.2009] Montero-Dorta A. D., et al., 2009, MNRAS, 392, 125
- [\citeauthoryearMoore et al.1996] Moore B., Katz N., Lake G., Dressler A., Oemler A., 1996, Nature, 379, 613
- [\citeauthoryearMoran et al.2006] Moran S. M., Ellis R. S., Treu T., Salim S., Rich R. M., Smith G. P., Kneib J.-P., 2006, ApJ, 641, L97
- [\citeauthoryearNair & Abraham2010] Nair P. B., Abraham R. G., 2010, ApJ, 714, L260
- [\citeauthoryearOemler et al.2009] Oemler A., Jr., Dressler A., Kelson D., Rigby J., Poggianti B. M., Fritz J., Morrison G., Smail I., 2009, ApJ, 693, 152
- [\citeauthoryearOwers, Couch, & Nulsen2009] Owers M. S., Couch W. J., Nulsen P. E. J., 2009, ApJ, 693, 901
- [\citeauthoryearPasquali et al.2009] Pasquali A., van den Bosch F. C., Mo H. J., Yang X., Somerville R., 2009, MNRAS, 394, 38
- [\citeauthoryearPasquali et al.2010] Pasquali A., Gallazzi A., Fontanot F., van den Bosch F. C., De Lucia G., Mo H. J., Yang X., 2010, MNRAS, 407, 937
- [\citeauthoryearPatel et al.2011] Patel S. G., Kelson D. D., Holden B. P., Franx M., Illingworth G. D., 2011, ApJ, 735, 53
- [\citeauthoryearPeng et al.2010] Peng Y.-j., et al., 2010, ApJ, 721, 193
- [\citeauthoryearPimbblet et al.2002] Pimbblet K. A., Smail I., Kodama T., Couch W. J., Edge A. C., Zabludoff A. I., O’Hely E., 2002, MNRAS, 331, 333
- [\citeauthoryearPimbblet, Drinkwater, & Hawkrigg2004] Pimbblet K. A., Drinkwater M. J., Hawkrigg M. C., 2004, MNRAS, 354, L61
- [\citeauthoryearPimbblet et al.2006] Pimbblet K. A., Smail I., Edge A. C., O’Hely E., Couch W. J., Zabludoff A. I., 2006, MNRAS, 366, 645
- [\citeauthoryearPimbblet2008] Pimbblet K. A., 2008, PASA, 25, 176
- [\citeauthoryearPimbblet2011] Pimbblet K. A., 2011, MNRAS, 411, 2637
- [\citeauthoryearPinkney et al.1996] Pinkney J., Roettiger K., Burns J. O., Bird C. M., 1996, ApJS, 104, 1
- [\citeauthoryearPoggianti et al.1999] Poggianti B. M., Smail I., Dressler A., Couch W. J., Barger A. J., Butcher H., Ellis R. S., Oemler A., Jr., 1999, ApJ, 518, 576
- [\citeauthoryearPoggianti, Bressan, & Franceschini2001] Poggianti B. M., Bressan A., Franceschini A., 2001, ApJ, 550, 195
- [\citeauthoryearPopesso et al.2005] Popesso P., Biviano A., Böhringer H., Romaniello M., Voges W., 2005, A&A, 433, 431
- [\citeauthoryearPopesso & Biviano2006] Popesso P., Biviano A., 2006, A&A, 460, L23
- [\citeauthoryearPorter et al.2008] Porter S. C., Raychaudhury S., Pimbblet K. A., Drinkwater M. J., 2008, MNRAS, 388, 1152
- [\citeauthoryearPress et al.1992] Press W. H., Teukolsky S. A., Vetterling W. T., Flannery B. P., 1992, Numerical Recipies, Cambridge University Press, Cambridge
- [\citeauthoryearQuilis, Moore, & Bower2000] Quilis V., Moore B., Bower R., 2000, Sci, 288, 1617
- [\citeauthoryearRaichoor & Andreon2012] Raichoor A., Andreon S., 2012a, A&A, 537, A88
- [\citeauthoryearRaichoor & Andreon2012] Raichoor A., Andreon S., 2012b, A&A, 543, A19
- [\citeauthoryearRakos & Schombert1995] Rakos K. D., Schombert J. M., 1995, ApJ, 439, 47
- [\citeauthoryearRines et al.2005] Rines K., Geller M. J., Kurtz M. J., Diaferio A., 2005, AJ, 130, 1482
- [\citeauthoryearRood et al.1972] Rood H. J., Page T. L., Kintner E. C., King I. R., 1972, ApJ, 175, 627
- [\citeauthoryearRuderman & Ebeling2005] Ruderman J. T., Ebeling H., 2005, ApJ, 623, L81
- [\citeauthoryearSato & Martin2006] Sato T., Martin C. L., 2006, ApJ, 647, 946
- [\citeauthoryearSivakoff et al.2008] Sivakoff G. R., Martini P., Zabludoff A. I., Kelson D. D., Mulchaey J. S., 2008, ApJ, 682, 803
- [\citeauthoryearSkibba et al.2009] Skibba R. A., et al., 2009, MNRAS, 399, 966
- [\citeauthoryearSmail et al.1998] Smail I., Edge A. C., Ellis R. S., Blandford R. D., 1998, MNRAS, 293, 124
- [\citeauthoryearSpergel et al.2007] Spergel D. N., et al., 2007, ApJS, 170, 377
- [\citeauthoryearStasińska et al.2006] Stasińska G., Cid Fernandes R., Mateus A., Sodré L., Asari N. V., 2006, MNRAS, 371, 972
- [\citeauthoryearStrauss et al.2002] Strauss M. A., et al., 2002, AJ, 124, 1810
- [\citeauthoryearTajiri & Kamaya2001] Tajiri Y. Y., Kamaya H., 2001, ApJ, 562, L125
- [\citeauthoryearThomas et al.2010] Thomas D., Maraston C., Schawinski K., Sarzi M., Silk J., 2010, MNRAS, 404, 1775
- [\citeauthoryearTran et al.2003] Tran K.-V. H., Franx M., Illingworth G., Kelson D. D., van Dokkum P., 2003, ApJ, 599, 865
- [\citeauthoryearTran et al.2005] Tran K.-V. H., van Dokkum P., Illingworth G. D., Kelson D., Gonzalez A., Franx M., 2005, ApJ, 619, 134
- [\citeauthoryearTremonti et al.2004] Tremonti C. A., et al., 2004, ApJ, 613, 898
- [\citeauthoryearUrquhart et al.2010] Urquhart S. A., Willis J. P., Hoekstra H., Pierre M., 2010, MNRAS, 406, 368
- [\citeauthoryearvan den Bosch et al.2008] van den Bosch F. C., Pasquali A., Yang X., Mo H. J., Weinmann S., McIntosh D. H., Aquino D., 2008, MNRAS, submitted, (arXiv:0805.0002)
- [\citeauthoryearvan der Wel et al.2007] van der Wel A., et al., 2007, ApJ, 670, 206
- [\citeauthoryearvan Dokkum et al.1999] van Dokkum P. G., Franx M., Fabricant D., Kelson D. D., Illingworth G. D., 1999, ApJ, 520, L95
- [\citeauthoryearVeilleux & Osterbrock1987] Veilleux S., Osterbrock D. E., 1987, ApJS, 63, 295
- [\citeauthoryearVisvanathan & Sandage1977] Visvanathan N., Sandage A., 1977, ApJ, 216, 214
- [\citeauthoryearvon der Linden et al.2010] von der Linden A., Wild V., Kauffmann G., White S. D. M., Weinmann S., 2010, MNRAS, 404, 1231
- [\citeauthoryearVulcani et al.2011] Vulcani B., et al., 2012, A&A, submitted (arXiv:1111.0830)
- [\citeauthoryearWetzel, Tinker, & Conroy2012] Wetzel A. R., Tinker J. L., Conroy C., 2012, MNRAS, 424, 232
- [\citeauthoryearWilman, Zibetti, & Budavári2010] Wilman D. J., Zibetti S., Budavári T., 2010, MNRAS, 406, 1701
- [\citeauthoryearWilman & Erwin2012] Wilman D. J., Erwin P., 2012, ApJ, 746, 160
- [\citeauthoryearWolf et al.2009] Wolf C., et al., 2009, MNRAS, 393, 1302
- [\citeauthoryearXue et al.2010] Xue Y. Q., et al., 2010, ApJ, 720, 368
- [\citeauthoryearYahil & Vidal1977] Yahil A., Vidal N. V., 1977, ApJ, 214, 347
- [\citeauthoryearYoon et al.2008] Yoon J. H., Schawinski K., Sheen Y.-K., Ree C. H., Yi S. K., 2008, ApJS, 176, 414
- [Zabludoff 1990] Zabludoff A. I., Huchra J. P., Geller M. J., 1990, ApJS, 74, 1
- [\citeauthoryearZabludoff et al.1996] Zabludoff A. I., Zaritsky D., Lin H., Tucker D., Hashimoto Y., Shectman S. A., Oemler A., Kirshner R. P., 1996, ApJ, 466, 104