PreCam, a Precursor Observational Campaign
for Calibration of the Dark Energy Survey
Abstract
PreCam, a precursor observational campaign supporting the Dark Energy Survey (DES), is designed to produce a photometric and astrometric catalog of nearly a hundred thousand standard stars within the DES footprint, while the PreCam instrument also serves as a prototype testbed for the Dark Energy Camera (DECam)’s hardware and software. This catalog represents a potential 100-fold increase in Southern Hemisphere photometric standard stars, and therefore will be an important component in the calibration of the Dark Energy Survey. We provide details on the PreCam instrument’s design, construction and testing, as well as results from a subset of the 51 nights of PreCam survey observations on the University of Michigan Department of Astronomy’s Curtis-Schmidt telescope at Cerro Tololo Inter-American Observatory. We briefly describe the preliminary data processing pipeline that has been developed for PreCam data and the preliminary results of the instrument performance, as well as astrometry and photometry of a sample of stars previously included in other southern sky surveys.
1 The Dark Energy Survey in the Context of Current Cosmology
The Dark Energy Survey, or DES, will map 5000 deg2 of the southern galactic cap to observe more than 108 faint galaxies, more than 3000 Type Ia supernovae, and myriad other objects, to determine the nature and temporal evolution (if any) of dark energy (Annis et al., 2005; Bernstein et al., 2012). The DES utilizes the Dark Energy Camera, or DECam (Flaugher et al., 2012), installed on the Blanco telescope at Cerro Tololo Interamerican Observatory, to observe each pointing numerous times in each in five different passbands: g, r, i, z, and Y (the first four of which are similar, but not identical, to the Sloan Digital Sky Survey, or SDSS (Fukugita et al., 1996) filters). The DECam includes 62 2k x 4k pixel science CCDs (along with additional guide and focus/alignment CCDs) totaling 570 megapixels, creating a field of view of 3 deg2. A distinguishing characteristic of DECam is the choice of 200-micron thick, fully-depleted, n-type, red-sensitive CCDs for the imager array. These CCDs have a much better red-sensitivity, with an efficiency of greater than 50% per photon at wavelength 1000 nm, nearly an order of magnitude better than standard thin CCDs (McLeod et al., 1998) at that wavelength.
The goal of the DES is a factor of 3-5 improvement in the measured Dark Energy Task Force Figure of Merit of the dark energy parameters and over a Stage II experiment (Albrecht et al., 2006). To achieve this goal, the DES has an all-sky photometric calibration requirement of 2% (and a goal of 1%). Because the science requirements for the DES are quite stringent, the characteristics of the DECam must likewise be precisely controlled. One important method of calibrating the performance of the CCDs (and the entire optical system) during the Survey is to compare DECam measurements to previous measurements of known standard stars. Several catalogs of equatorial and Southern Hemisphere standard stars exist (Ivezi et al., 2007; Smith et al., 2002, 2013), but the extremely sparse nature of the observations render them inadequate for the needs of the DES. Furthermore, there are almost no standard stars that have been observed in the Y band. Thus, the efforts to provide calibration standards for the DECam are vital to the success of the overall Survey. The PreCam instrument contains two CCDs taken from among the spare devices made for the DECam itself, making the focal plane similar to a 1/31st-scale version of the DECam focal plane. This allows the PreCam survey observations to provide many of the necessary calibration standard stars for the DES, especially in the early years of the Survey. This in turn potentially allows up to 10% more of the DES time to be dedicated to science observations rather than calibration measurements, while still maintaining the design requirement of 2% photometric accuracy throughout the survey area. Much of the PreCam instrument’s hardware and software (such as the readout electronics) is likewise similar to that of the DECam, and has also been used for testing the DECam CCD electronics during the reassembly of the DECam system at CTIO after shipment.
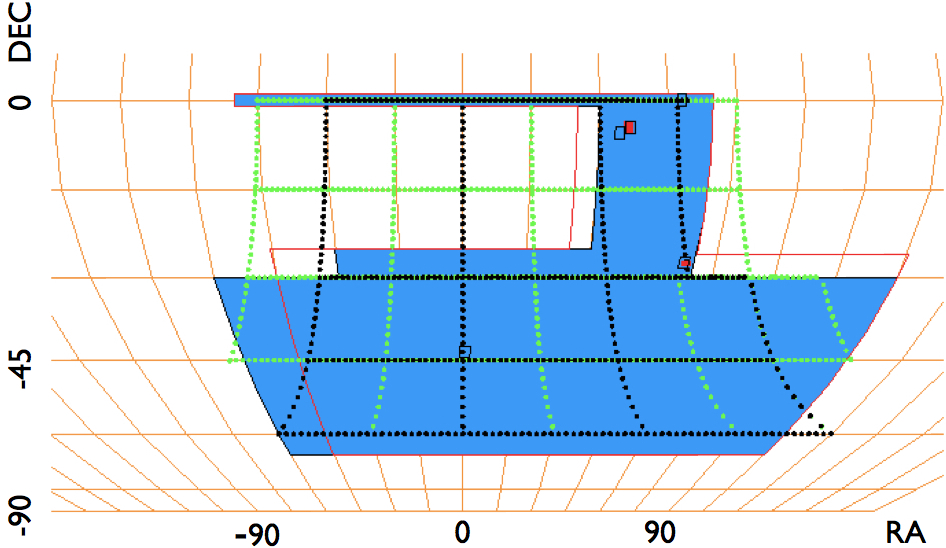
To accomplish its calibration goals, the PreCam survey observes relatively bright (magnitude 14-18) stars predominantly within the DES footprint using filters very similar to the DES grizY filter system (Abbott et al., 2009). For this survey, the PreCam instrument is mounted on the University of Michigan Department of Astronomy’s Curtis-Schmidt (C-S) telescope at CTIO. The first major step of the PreCam survey is to observe thousands of existing standard stars that have been catalogued as part of the SDSS or u′g′r′i′z′ standard star surveys (Ivezi et al., 2007; Smith et al., 2002, 2013). We then determine the survey’s photometric accuracy by comparing our observations to these other catalogs. We then use further PreCam observations of target candidate standard stars throughout the observed survey grid (105 stars overall) to provide a significantly expanded catalog that will be used to improve the overall photometric accuracy of the DES. On the C-S, the PreCam instrument’s field-of-view is 1.6∘ 1.6∘ (or 2.56 deg2). The PreCam survey was designed to cover 10% of the DES footprint in a sparse grid in RA and DEC, and each field in this grid was planned to be observed several times in each of the five filters. This grid pattern ensures that the DECam will regularly observe these calibrated standards during routine survey operations, thus obviating much of the need for dedicated standard star observations with DECam itself and thereby saving valuable observing time that can be devoted to further DES science goals. Figure 1 shows the planned PreCam survey grid overlaid on the DES footprint. In Section 2 we describe the design and construction of the PreCam instrument, as well as preliminary tests of its performance. In Section 3, we describe PreCam survey operations, while Section 4 describes the preliminary post-survey processing of the data. Sections 5 covers the results of this analysis, and in Section 6 we discuss the impact of these results in the context of DES calibrations. In Section 7, we conclude with a look toward the future prospects for PreCam.
2 Instrumentation and Bench Tests
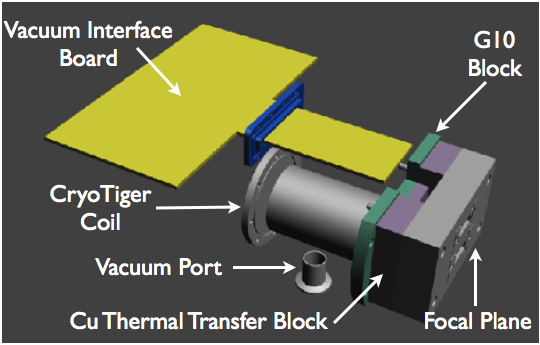
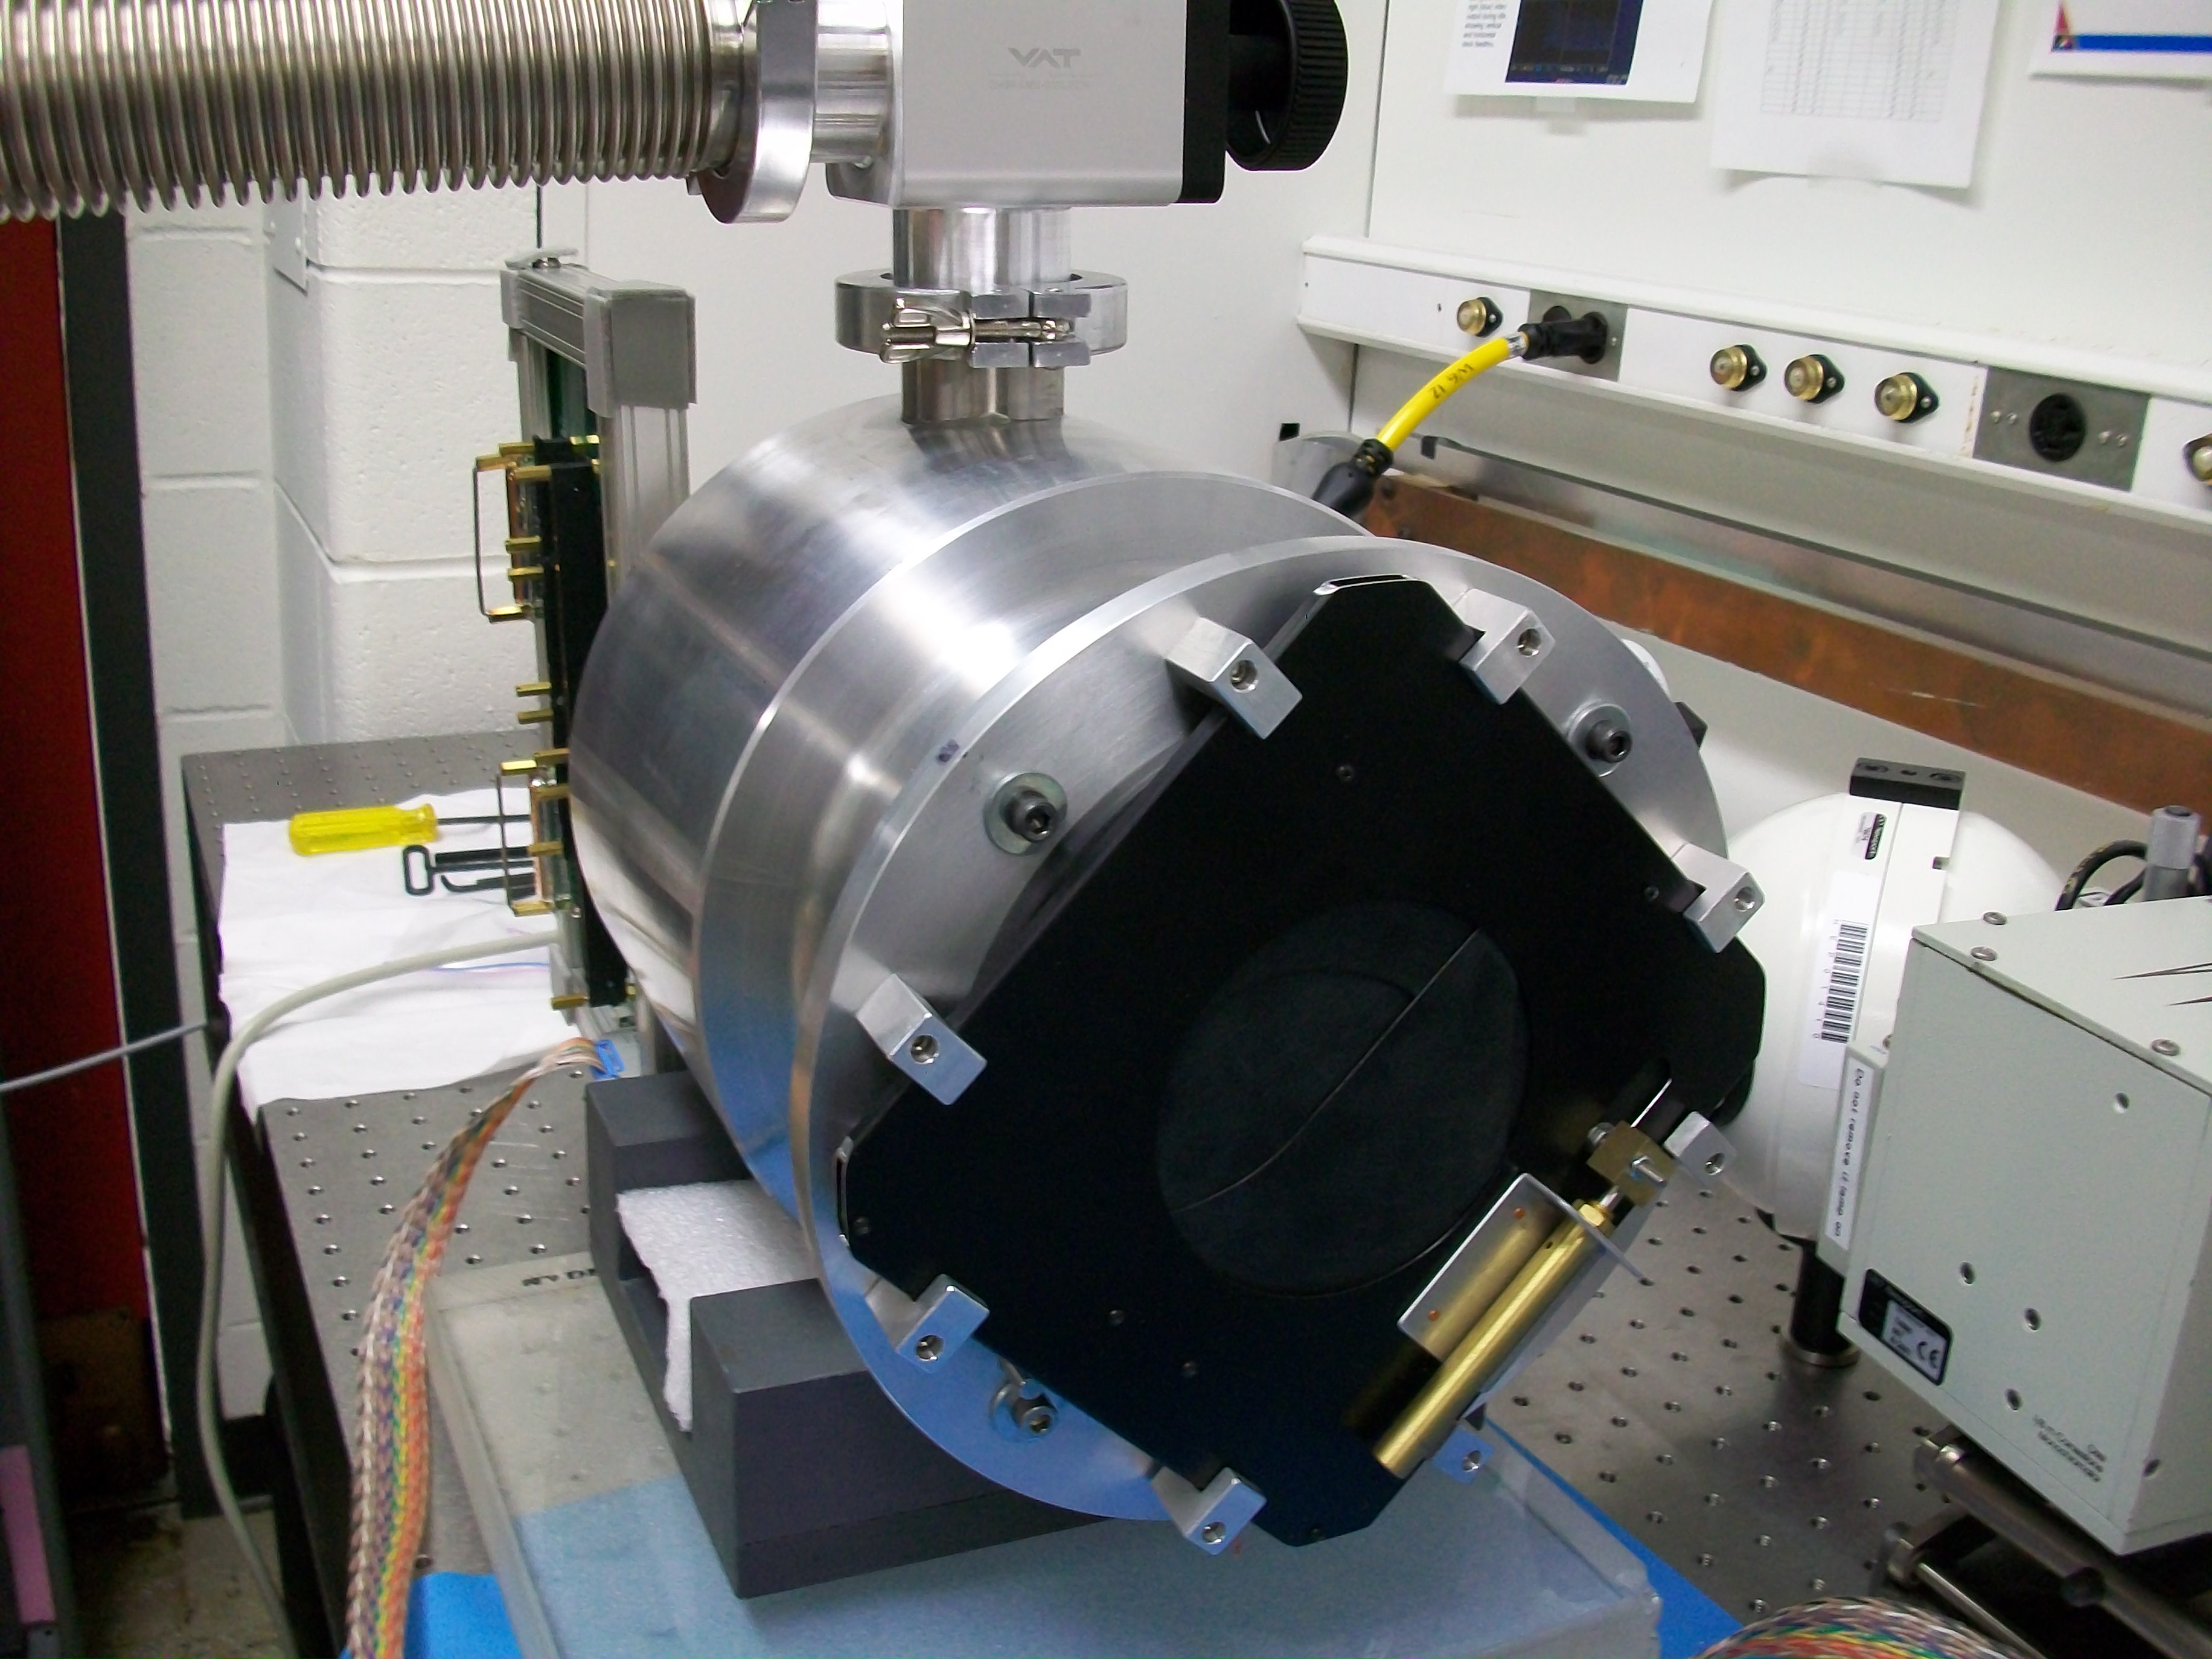
The PreCam instrument was primarily designed and built at Argonne National Laboratory, with the data acquisition (DAQ) electronics components contributed by Fermi National Accelerator Laboratory. The CCD detectors reside in an aluminum pressure vessel designed to operate at 10-6 mbar and -100∘ C, as required to reduce thermal noise to acceptable levels within the CCDs. In addition to the throughputs for cryogenic cooling and vacuum, the vessel has a 4 inch diameter sapphire window with an anti-reflective coating which allowed 99 transmission of light from the telescope to the CCDs111Al2O3 dewar window with A/R coating manufactured by JML Optical Industries, LLC, Rochester, NY 14625 (http://jmloptical.com). A custom-designed shutter222Compressed-gas actuated shutter manufactured by Packard Shutter Co., Fiddletown, CA, 95629 (http://www.packardshutter.com) is mounted in front of the vessel window and is actuated by compressed gas with an opening/closing stroke lasting less than 0.25 seconds (with the precise time depending somewhat on the applied gas pressure). Dry nitrogen is fed to the shutter and regulated by an electronically-controlled valve that receives the open signal in coincidence with the recording of the observed photoelectrons by the CCD. The vessel also has a Vacuum Interface Board (VIB) for signal readout from the CCDs (Shaw et al., 2012). The CCDs themselves are mounted on an aluminum focal plane immediately behind the vessel window and are positioned with an accuracy of better than 1mm, with a spacing between the two CCDs of 0.5 mm. Kapton cables 30 cm in length separately connect each CCD to the VIB. The focal plane is secured to a Cu thermal transfer block, which provides thermal contact between the CCDs and the CryoTiger cold probe333PolyCold CryoTiger system manufactured by Brooks Automation, Inc., Chelmsford, MA 01824. A custom-designed block of G10 plastic secures the thermal transfer block to the outer aluminum vessel while minimizing thermal transfer to the vessel walls. Two Pt thermocouples attached to the thermal transfer block are used to measure the temperature near the CCDs, and two 25 W heaters connected to the thermal transfer block complete the feedback loop for temperature control. While the CryoTiger is designed to operate at full power continuously, a Lakeshore 332 (LS332) device monitors the thermocouples and provides power to the heaters to maintain temperature stability444LS332 manufactured by LakeShore Electronics, Westerville, OH 43226 (http://lakeshore.com). To provide vacuum, a turbopump is attached to the vessel during testing and maintenance, but not operation555HiCUBE Turbomolecular pump manufactured by Pfeiffer Vacuum, GmbH, 35614 Asslar, Germany (http://www.pfeiffer-vacuum.com). Additionally, a small quantity ( 10 g) of charcoal getter is secured to the thermal transfer block to adsorb any gases not removed by the vacuum pump666Activated charcoal getter manufactured by Adsorbents & Dessicants Corporation of America (ADCOA), Gardena, CA 90247 (http://www.adcoa.net). After vacuum was established during bench tests, outgassing was determined to be minimal, and the presence of the getter allowed the operating pressure (10-6 to 10-5 mbar) to be maintained for more than a month without further pumping. Outside the vessel, the VIB is connected to a Monsoon electronics crate containing pre-production DES clock and bias and data acquisition boards; the Monsoon crate is then connected to the control PC with a fiber optic S-Link interface (Cardiel-Sas et al., 2008). The entire data DAQ system uses PANVIEW (a customized “Pixel Acquisition Node” LabVIEW interface), which is in turn controlled by the observer through a prototype of the Survey Image System Process Integration, or SISPI (Honscheid et al., 2008), the software manager and user interface for the DECam. See Figure 2 for a CAD model of the PreCam instrument and for a photograph of the complete PreCam system, as well as Table 1 for the characteristics of the instrument.
| CCD Type | 2 x DECam 2048 x 4086 pixels |
|---|---|
| CCD Pixel Scale | 1.45 arcsec/pixel |
| Digitization Precision | 16 bit/pixel |
| Number of Readout Ports | 4 (2 per CCD) |
| Window Type | 4 inch diameter Sapphire, AR Coated |
| Cooler Type and Setpoint | CryoTiger, -100∘ C |
| Readout Speed | 20 s |
| Gain | 4 ADU/photoelectron |
| Dark Noise | 1 ADU/min |
| Readout Noise | 1 ADU/pixel |
| Fullwell | 141K,113K,134K,144K e-/pixel |
| Pixel Size | 15 m x 15 m |
| Field of View | 1.6∘ x 1.6∘ (10% vignetting in central 1.0∘ diameter area) |
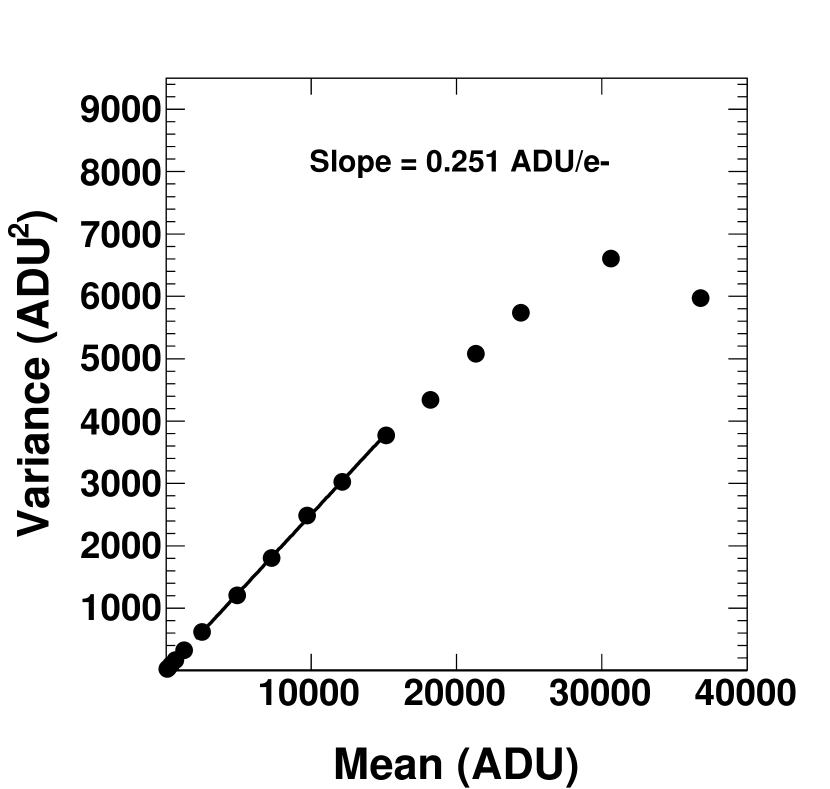
Bench tests were undertaken at Argonne National Laboratory from March to July, 2010, to determine the effectiveness of each individual component and of the entire integrated system. As already described, vacuum was created by the turbopump and maintained by the getter for nearly a month during the testing period. Once the LS332 was programmed with the proper set-points and Pt thermocouple resistance values (including the resistance of the readout cables), the temperature was stable to within 0.25K. With the PANVIEW software running within SISPI, the CCDs were read out and combined into a single FITS image in 20 seconds. Other bench tests (e.g., photon transfer curves, see Figure 3) determined the readnoise, dark current, and full well of the CCDs . At the conclusion of these tests, the PreCam instrument was shipped to CTIO for installation and operation on the C-S telescope. In the next section, we focus on the PreCam survey operations and data-taking.
3 Operations and Data-Taking
3.1 PreCam Installation and Commissioning on the Curtis-Schmidt
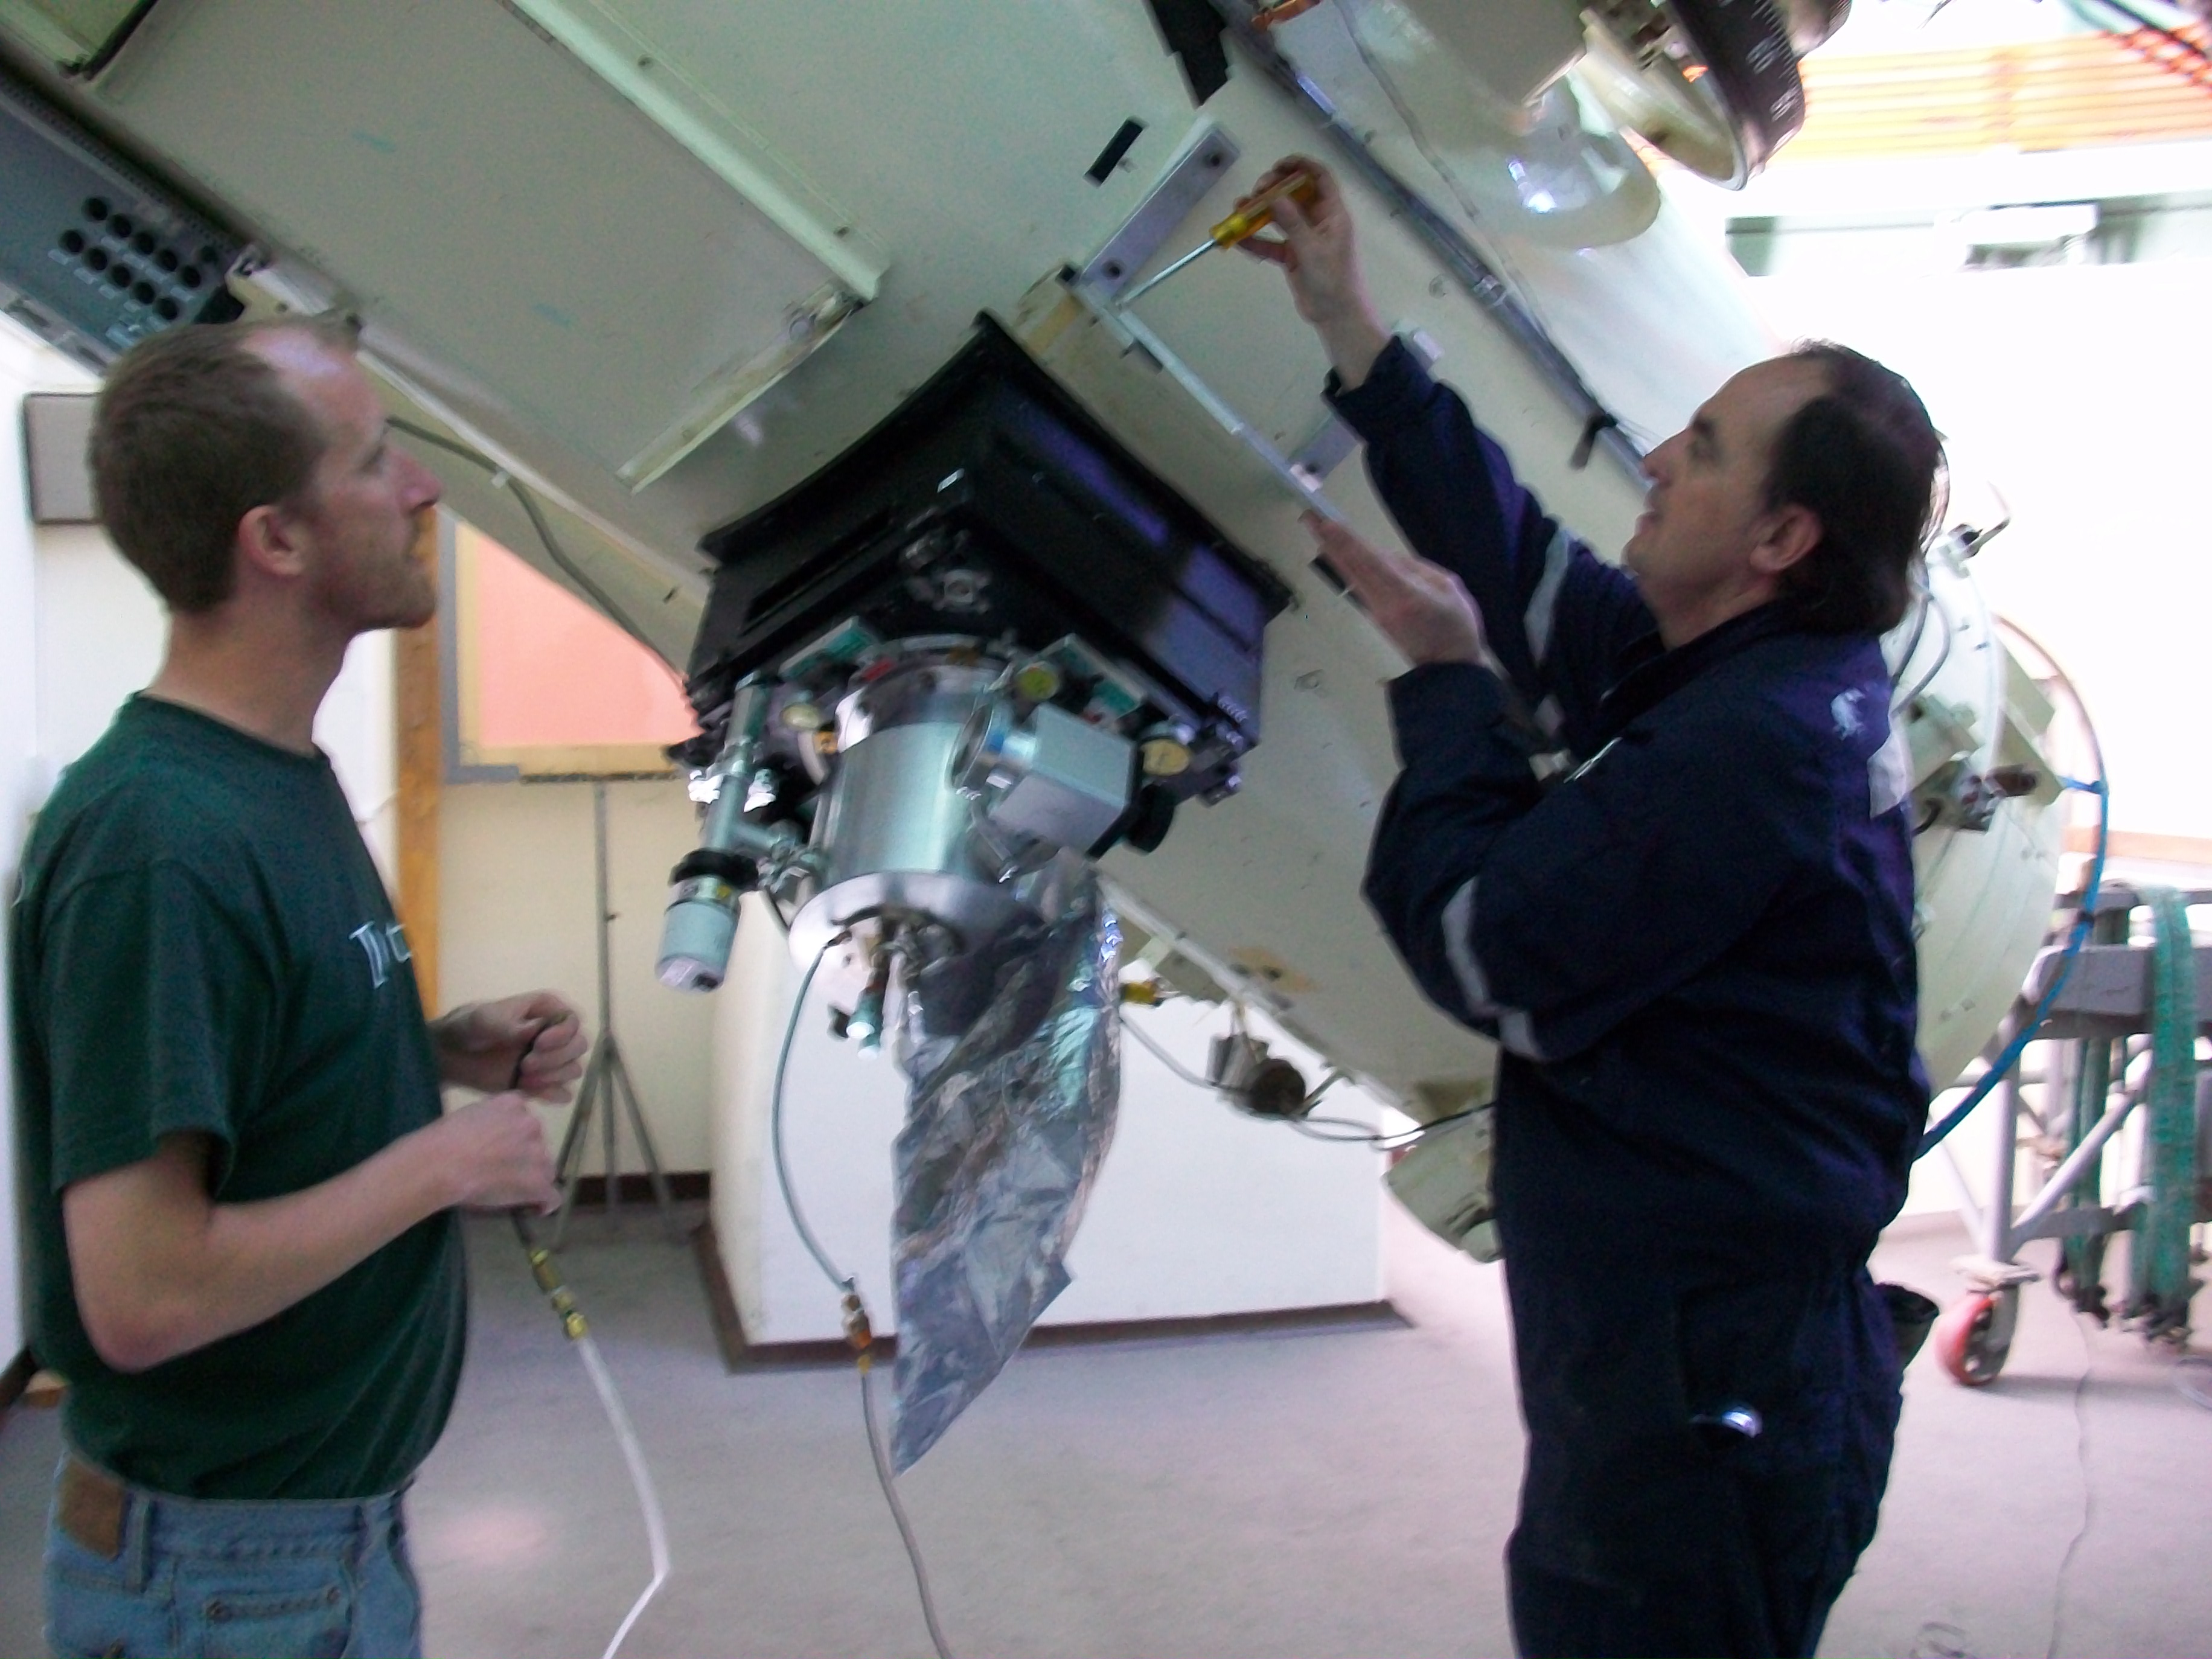
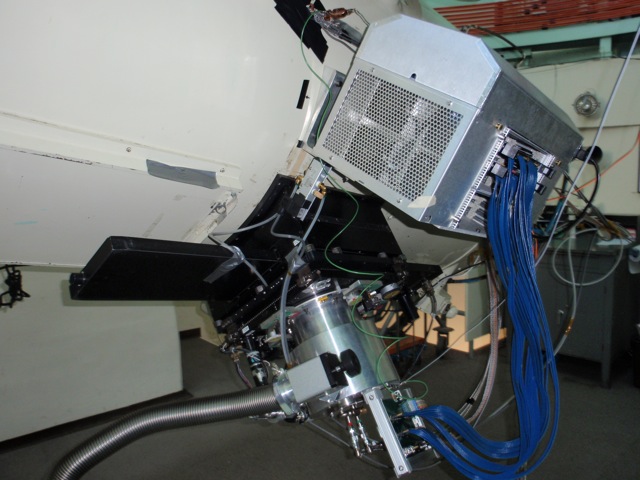
We were scheduled for 112 nights of telescope time (including installation and testing) through the University of Michigan Department of Astronomy on their Curtis-Schmidt telescope at CTIO. The C-S telescope is a 0.61 meter aperture telescope of classical Schmidt design, with the CCDs mounted at a Newtonian focus. Its fast optics and wide field of view make it ideally suited for long-duration wide-field observation campaigns such as the PreCam survey. Figure 4 shows the PreCam instrument as it is being installed on the C-S telescope, along with a close-up view of the instrument.
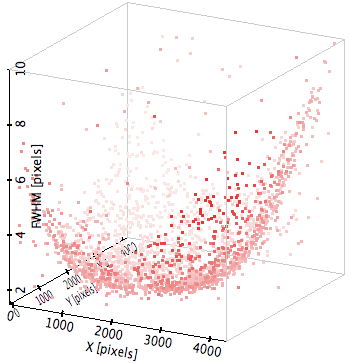
After installation, testing, and commissioning, we had 64 potential nights of on-sky observing. Of these, 51 provided useful science data, while the other nights were dedicated to PreCam or C-S engineering tasks (e.g., fixing a broken dome motor), or encountered various hardware or software malfunctions (see Data Processing, Section 4), or, rarely, poor weather conditions. The testing/commissioning tasks completed during August and September of 2010 included mounting and testing the new camera; installing and testing a new LED-based flat-field system, which was a prototype of the DECal system that is part of the DECam project (Rheault et al., 2012); replacing the C-S’s undersized secondary mirror with a new mirror and mount; the subsequent re-collimating of the optics; and interfacing the PreCam instrument with the C-S Telescope Control System (TCS). After the secondary mirror was replaced it was discovered that the new mirror did not meet requirements and we reinstalled the original secondary and mount. The final step of the commissioning process involved characterizing the shape of the focal plane and determining the best focus settings of the C-S mirrors. Although the Schmidt telescope has a curved focal plane, we elected to observe without a field flattener. Customized software for focus optimization was developed (Allam, 2012); output showing the curvature of the focal surface is shown in Figure 5. From these observations, filter- and temperature-dependent focus settings were determined and a procedure for nightly focus determination was developed.
3.2 The Flat-Field System and PreCam Filters
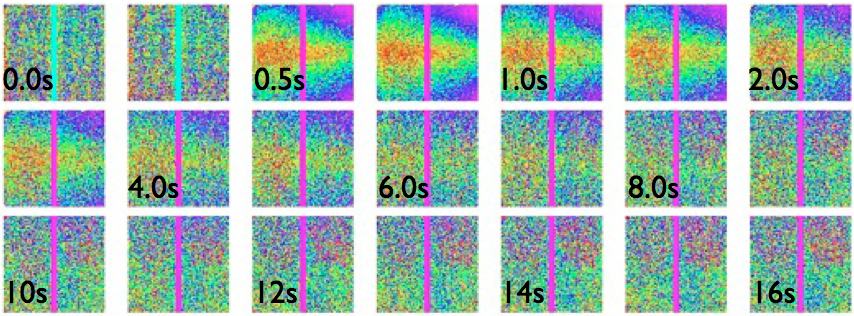
The PreCam flat-field system consists of a screen placed within the C-S dome and illuminated by six sets of LEDs mounted near the top of the C-S telescope. These LEDs emit light at wavelengths of 470, 740, 905, 970, and 1000 nm, as well as a broad-spectrum “white” light. A seventh LED was included in the flat-field system but was not used for PreCam observations. These were used to ensure uniformity of the system response to sources of uniform illumination; where variations from uniformity were identified within the observed data, a standard procedure was applied to “flatten” the system response so that every pixel of the CCDs effectively would register the same number of counts for a given source intensity. This also allowed us to measure (and correct for) any possible inaccuracies in collimation of the optics that would cause non-uniform illumination across the focal plane. The flat-field system is also used to test the effects of the shutter opening/closing time on image uniformity. Figure 6 shows that such non-uniformities are negligible for any image longer than 8 s even without any shutter map corrections; thus, PreCam images are unaffected by the non-zero shutter actuation time, as they are all 10 s or greater in duration.
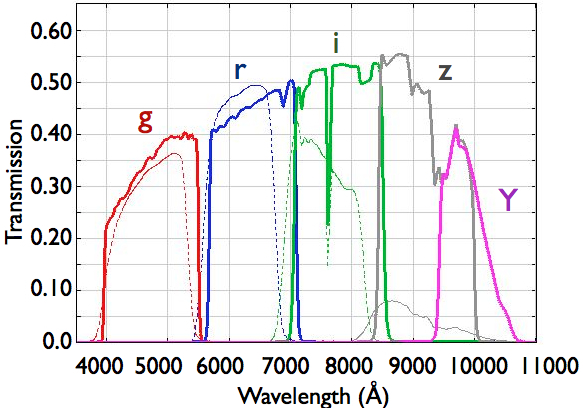
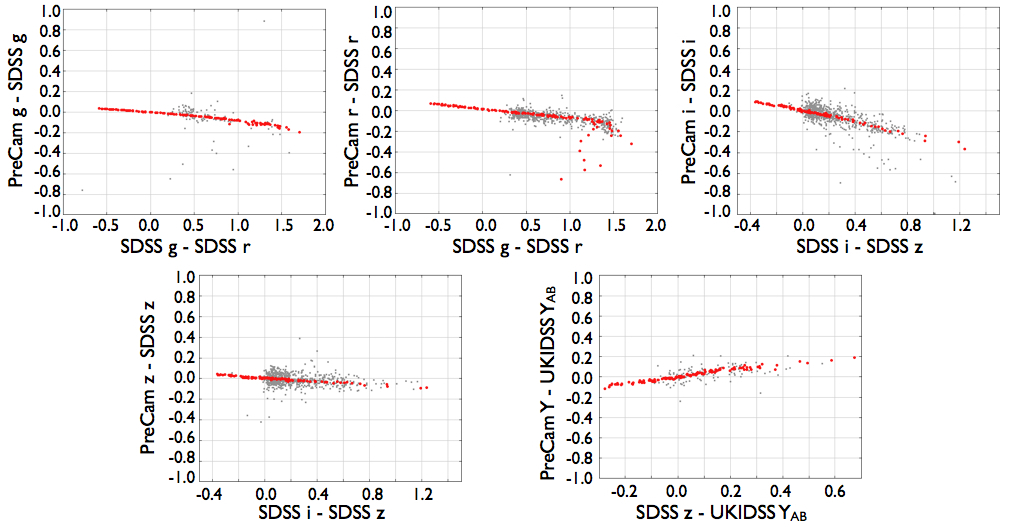
Scaled-down versions of filters very similar to those used by the DECam were also incorporated into the PreCam instrument, and they performed as expected (hereafter the PreCam filters are referred to with the subscript ). The measured wavelength-dependent transmission of the filters convolved with atmospheric absorption and CCD quantum efficiency is shown in Figure 7, while Figure 8 shows the color terms for a selection of observed stars, relative to the SDSS and UKIDSS filters, compared to those from the Pickles stellar library (Pickles, 1998). The excellent agreement between the expected and observed performance of the filters is thus confirmed. A comparison of the PreCam filters to those actually manufactured for and installed on the DECam also will be performed to ensure that any differences between the two sets of filters are accounted for prior to the application of PreCam data to DES calibrations.
3.3 Observing Strategy and the Observing Tactician
During primary data-taking (November 2010 to January 2011), each night of observing was preceded by collection of bias (0 s duration) and dark images. Around sunset (when there is minimal stray light illuminating the interior of the C-S dome), flat-field images were also acquired using the previously-described system. Once the sky was dark enough (i.e. after astronomical twilight), we made pointing and focus determination observations before proceeding to regular observations.
As part of the PreCam observing procedure, a prototype of the DES Observing Tactician, or ObsTac (Annis & Neilsen, 2012), was implemented and tested; this automated target selection and scheduling program was used for the vast majority of the science data-taking, leading to significant improvements in performance that will be carried over to the DES itself. ObsTac has two primary elements: 1) a database that contains tables of field positions, desired exposure times for each filter, exposures already completed or planned, and other data that influence target selection; and 2) a SISPI service, the ObsTac server, that returns the specification for an observation (pointing, exposure time, filter, and earliest and latest acceptable times of observation) upon receiving a request for an observation at a given time.
When called, the ObsTac server determines if there are any exposures needed with time restrictions (calibration fields, for example), and if there are, it returns the relevant data for such an exposure. Otherwise, it returns the highest priority exposure of the survey that is observable, where “observable” takes into account the airmass and phase and separation from the moon. The algorithm used to calculate the priority was modified several times over the course of PreCam observing, but setting time and sky brightness were generally the determining factors. Fields that set first were targeted first, as they may not have been available later in the survey. Exposures in bluer filters were preferred in dark sky conditions, because redder filters can better tolerate brighter sky conditions. In standard observing with the DES, there will also be additional supporting services—for example, a simple SISPI service will monitor the length of the observing queue, and fill it when necessary through calls to the ObsTac server.
For the PreCam survey, however, not all aspects of the ObsTac infrastructure were used; instead, we performed simulations of the night to be observed, recording which exposures were selected by ObsTac at any given time. This record was then provided to the PreCam observing software, which read and executed the automating observing plan. Because the plan was generated for the whole night ahead of time, ObsTac could not automatically accommodate changes in observing in real time. In particular, the actual times of observation occasionally differed from those planned by ObsTac, resulting in more large airmass observations than originally expected. Because airmass-dependent corrections as well as FWHM selection criteria were applied to the observed data, such high-airmass observations are not expected to negatively impact our final results (apart from perhaps reducing the total number of usable standards stars that are incorporated into our catalog).
Based on the ObsTac observing plan, the PreCam observing software interacted with the C-S TCS to move the telescope to the desired observing position, changed the filter to the desired setting, opened and closed the shutter, and interfaced with the DAQ system that recorded and read out each image. Once each image was completed, the observing script selected the next object in the observing plan and repeated the observing process until all objects were observed, morning twilight prevented further observing, or the observer manually interrupted the observing sequence. Guided by this automated process, we obtained 11020 images during the PreCam survey. The majority of these images were located along SDSS Stripe 82 and throughout the eastern half of the DES footprint, though we also obtained some images outside that region. PreCam survey images contain just under 10 million identified objects, though this includes multiple observations of the same objects. All observations are divided into three distinct categories: calibration exposures (biases, dark frames, dome flats), standard fields (10 s images of known bright standards), and target fields (including both known and candidate standard stars). Standard observations were repeated in every filter once every hour throughout the observing nights in order to ensure the internal consistency of the PreCam dataset. Furthermore, these observations were used to determine the average zero-point offset for data taken with each filter on each night. With these zero-points offsets applied, the photometric accuracy is greatly improved (see Results, below).
3.4 The Quick-Reduce Pipeline
During observations, a prototype of the Quick Reduce (QR) pipeline developed for the DECam by the DES-Brazil team was deployed at CTIO and adapted to handle data from the PreCam survey. The QR pipeline carries out the following steps: 1) automatically reads the most recent image stored on disk; 2) applies standard corrections to this image (overscan, bias subtraction and flat-field correction); 3) extracts a catalog using Source Extractor (Bertin & Arnouts, 1996); 4) computes the mean of the measured FWHM and evaluates the distortion of the Point Spread Function (PSF) of the sources classified as stars on each CCD; 5) compares these values to user-specified values to determine whether the image complies with the quality criteria established; and 6) produces a set of web pages summarizing the results and showing a JPEG representation of the images reduced. The QR pipeline also allows displaying the raw and reduced fits files using, for instance, DS9. While the use of the QR pipeline during PreCam observing was limited, the experience was extremely valuable in the development and testing of the final system that has been incorporated into SISPI for use with the DES.
At the end of each night, the raw PreCam data were also transferred to the DES tertiary data storage site in Rio de Janeiro, Brazil, and subsequently to Fermilab using a tool named Bits Around the World (BAW) developed by the DES-Brazil group as a substitute for the official CTIO Data Transfer System (DTS), which was still under development at the time. These data were subsequently used in the development and testing of a pipeline for regular, automated, complete reduction of PreCam and (soon-to-be-acquired) DES data. Although the pipeline was not used to reduce all of the accumulated PreCam data, it was applied to several nights of data, demonstrating that approximately eight hours of data can be successfully reduced and the results transferred during the following daytime period, enabling a rapid feedback mechanism for guiding observations on subsequent nights, a critical component of the DES Observing Strategy.
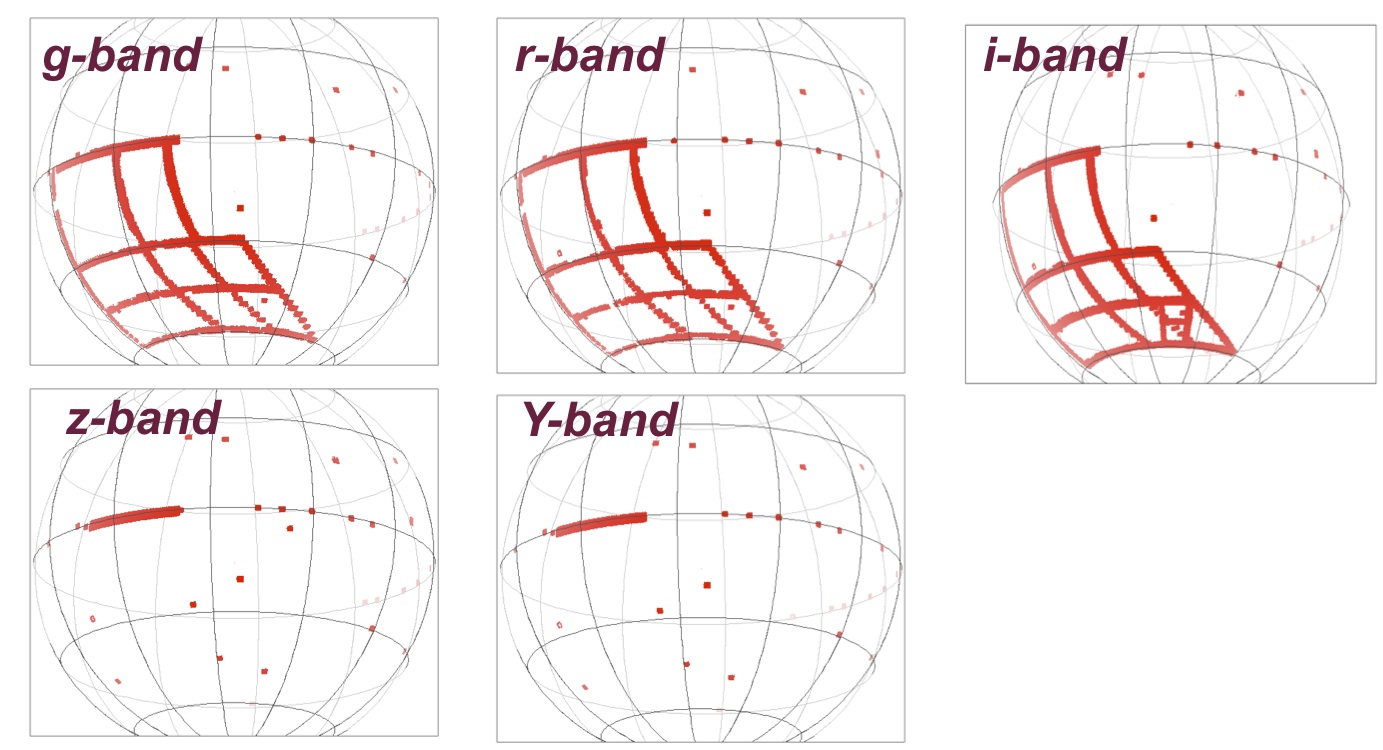
Table 2 shows the total number of science and calibration images obtained per filter (after initial data quality selection), along with the number of stars identified in these images, while Figure 9 shows the completed coverage map overlaid on the DES footprint, as well as filter-specific coverage maps.
| Filter | Target Field Exposure Duration (s) | NumberTargetExposures | NumberStd.Exposures | NumberStars |
| gpc | 36 | 1888 | 700 | 959,085 |
| rpc | 51 | 1868 | 700 | 1,881,279 |
| ipc | 65 | 3152 | 700 | 3,881,716 |
| zpc | 162 | 269 | 700 | 1,816,290 |
| Ypc | 73 | 343 | 700 | 890,181 |
4 Preliminary Data Processing
Once the data were collected, we performed standard bias correction and flat-fielding of all the images (at -100∘C, the dark current was negligible and thus was not subtracted from the images), using master bias and master flat-field images that were derived from all useful images of these types. After these standard steps, further processing was required due to unique circumstances confronted during PreCam observations. The full details of the final processing and analysis steps will be detailed in a subsequent publication (Allam et al., 2013); here we describe the preliminary analysis applied to a representative sample (10, described in Table 3) of the data collected.
| Date (UT) | Filter(s) Used | NTargetExposures |
|---|---|---|
| 21011215 | i, z | 40, 29 |
| 20110107 | g, z | 194, 3 |
| 20110108 | r, z | 56, 10 |
| 20110112 | i, z | 19 , 19 |
| 20110113 | i | 174 |
| 20110117 | i | 207 |
4.1 PreCam-Specific Image Processing: Streaking and Banding Corrections
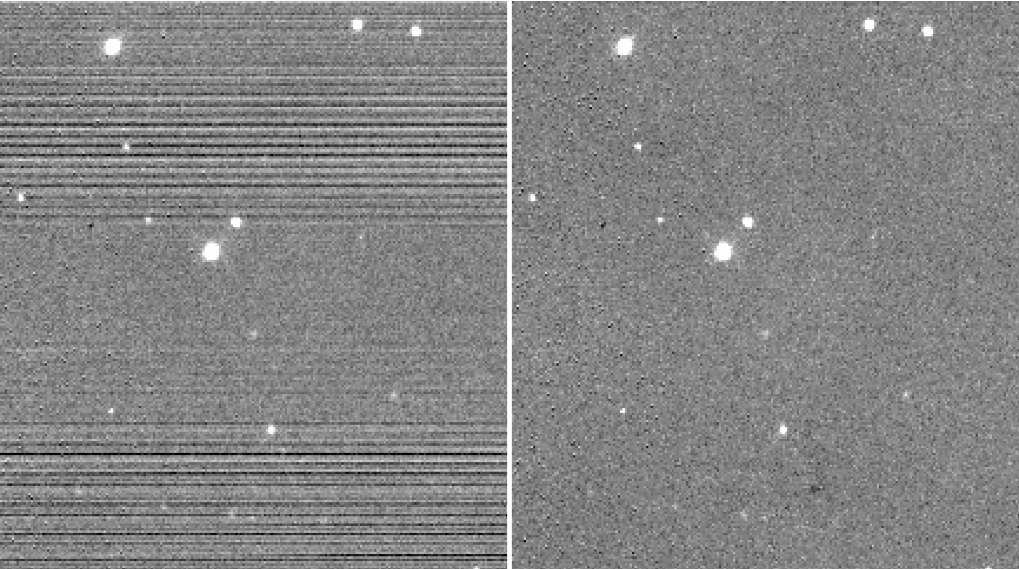
One significant problem encountered during data-taking was horizontal streaking and banding within the images. This was eventually traced to microscopic damage within the cables connecting the VIB to the Monsoon crate. Design differences preclude this problem from occurring on the DECam; meanwhile, in preparation for future PreCam data-taking, we have prepared a repaired cable as well as a strain-relief system that prevents the weight of the cable from damaging the sensitive connections as the telescope is moved. PreCam data that have already been collected were scanned for the presence of streaking or banding; nearly 40 of the images showed some signs of streaking. Because this induced common-mode noise was observed to be cyclic and to exhibit the same pattern in each amplifier for each CCD, a straightforward software algorithm comparing the pixel-by-pixel counts in the four amplifiers permitted the identification (and removal) of the banding and streaking effects (see Figure 10 for an example of an image with significant streaking, and the subsequent corrected image). Photometric and astrometric accuracy of the vast majority of these images was restored with this process; only 3.6 of the images were finally considered “unrecoverable” due to the presence of significant and uncorrectable streaking. Meanwhile, the residual uncertainty in photometric accuracy introduced by this process is small (mean variation of 0.01 mag) for any given image; therefore, thousands of additional images were retained in our dataset, and ultimately will contribute to the final PreCam Standard Star Catalog.
4.2 PreCam-Specific Image Processing: Shutter Corrections
Repeated actuation of the shutter led to failure of the shutter blades on several occasions. Ultimately, some of the blades completely broke, thereby preventing the shutter from fully closing (and obviously impeding our data-taking efforts). Prior to complete failure, however, the shutter blades would occasionally “stick” in a partially-open configuration. As with the streaking and banding problems, DECam’s design differences prevent such a problem from occurring during the Dark Energy Survey. Within the PreCam dataset, only a small fraction (3.5) of the images were identified as suffering from shutter problems, and the vast majority of these are still useful for determining stellar photometry, as a) only a small region of the full image is affected, and b) local background-subtraction algorithms can correct for the increased noise in these regions with negligible degradation of the resulting photometric accuracy. Additionally, the shutter actuation system has been modified with a slow-release valve for the compressed gas that extends the lifetime of the shutter blades by approximately a factor of three relative to the original shutter system. While this may not completely eliminate shutter problems during future operations, it improves shutter performance considerably and, coupled with the near-real-time image analysis provided by the QR system to identify broken or stuck shutter blades, will prevent significant loss of observing time during any future PreCam observing campaigns. The effect of the increased shutter closing time upon the uniformity of focal plane illumination is still being quantified, but because it only increases the blade actuation time by a factor of 2, it is not expected to impact PreCam exposures of 10 s or longer.
4.3 PreCam-Specific Image Processing: Illumination Correction
Finally, minor electronics issues associated with the CCDs and readout electronics arose during data processing. Specifically, “dipoles” became apparent in the partially-processed images. These occur when charge is improperly separated between (vertically) adjacent pixels, and one pixel is observed with a significantly greater background value than its immediate neighbor. These and other spurious variations are eliminated both in the production versions of the DES hardware and in the upgraded PreCam hardware; for all PreCam data already obtained these variations are eliminated by Illumination Correction processing (see Figure 11). Illumination Correction is effectively an additional application of flat-field corrections, incorporating a pixel-by-pixel multiplicative factor based on the mean of all target field exposures for each filter during a given night of observing (as opposed to the initial flat-fielding, which was based on master flat images constructed from dedicated dome flat exposures taken throughout the duration of the survey). Instrument-induced variation between pairs of adjacent pixels is corrected in this fashion, from 16 to a level consistent with normal background variation, and any stellar profiles affected by dipoles are marginally improved (due to more accurate distribution of stellar photon counts). However, the improvement to the photometry of known standard stars is negligible solely by removing the dipoles, because (in general) the values for both pixels was already incorporated into any stellar photometry measurements, since all the light that came from a star (even that portion of it translated by one pixel) was still associated with that star. However, for the longer exposures (ipc-, zpc-, and Ypc-band images), Illumination Correction removed significant additional variations in illumination not corrected by the initial flat-fielding process, thus improving the final photometric accuracy of the stars found in images in those three bands. Because the photometric accuracy of stars in the gpc- and rpc-band images was not improved by the Illumination Correction, this step was not applied to images taken in these filters.
4.4 Star Flat Corrections and Catalog Generation
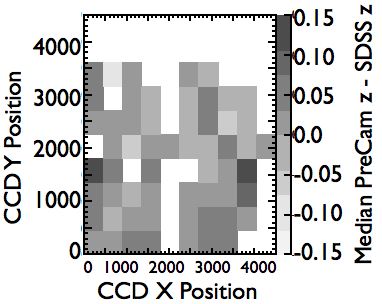
After the streaking/banding, shutter, and illumination variation issues are resolved, as a final processing step, residual instrumental effects are removed by means of applying a star flat correction (see Figure 12). These star flat images are created by comparing, over the course of a night, the magnitudes of known standard stars with their previously measured magnitudes from, e.g., SDSS or other catalogs. This yields a fine-scale (of order 100 sub-regions per image) zero-point correction that is applied to each image in addition to the global zero-point for the entire image. After this processing, a catalog is developed for each image using Source Extractor. The preliminary PreCam Southern Star Catalog is derived from this catalog, after the application of additional selection criteria; specifically, the Source Extractor-determined Stellarity 0.95 and FWHM 4 pixels (based upon a 12 arcsec diameter circular aperture). In the next section we describe results from the 10% subsample of the PreCam stellar catalog to which we have applied this preliminary analysis.
5 Results
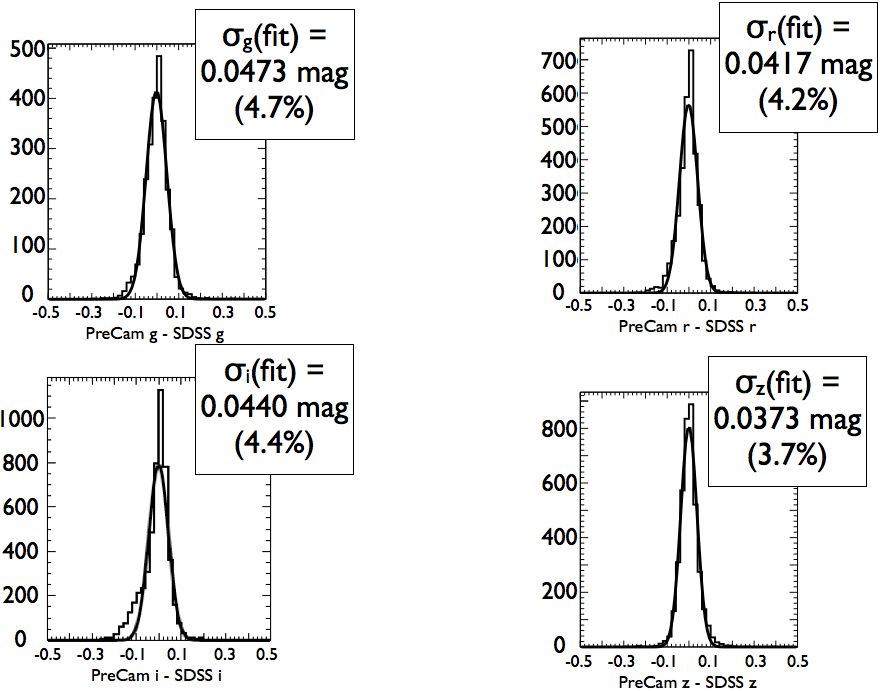
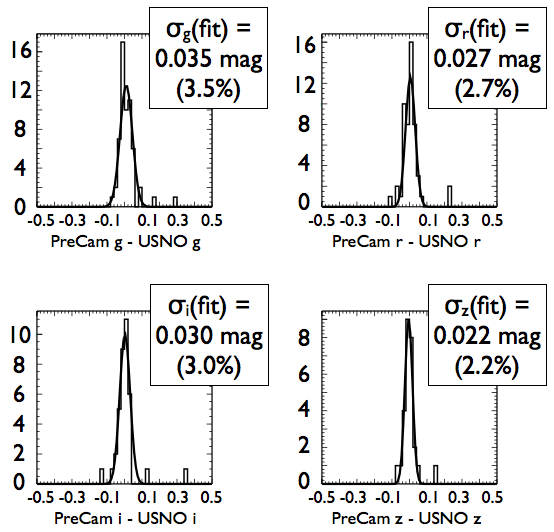
Preliminary measurements of target candidate standard stars in the PreCam images are compared to the 2MASS Point Source catalog (Skrutskie et al., 2006) for astrometry, while for photometry they are compared to the SDSS DR7 catalog (Ivezi et al., 2007) as well as the Equatorial and Southern extensions of the u′g′r′i′z′ catalogs (Smith et al., 2013). For the astrometry, we use a set of python scripts to perform a “first pass” fit, which is good to 2 arcseconds (RMS). We are currently refining these scripts and, with proper treatment of the field curvature and using independent astrometric solutions for the two PreCam CCDs, we have achieved astrometric accuracy good to 0.3 arcseconds (RMS), or about of a pixel. This is sufficient to provide unique identification of any stars that will be included in the final version of the PreCam Standard Star Catalog. For the photometry, existing standard stars are matched if the PreCam-determined position was within 3 arcseconds of the known position, and then nightly zero-point offsets and airmass-dependent color corrections are applied to the matched stars prior to determining the final photometric accuracy. A representative sample of the results taken from 10 of the observations, or six nights out of the total of 51, shows that PreCam measures stellar photometry with a mean accuracy of 3-5 (depending on filter) relative to SDSS results, and better than that (2) for Southern u′g′r′i′z′ stars brighter than magnitude 15 (see Figures 13 and 14). For the final PreCam catalog with improved data analysis and averaging of multiple observations of each field, our photometry is expected to achieve the required 2 accuracy (Allam et al., 2013).
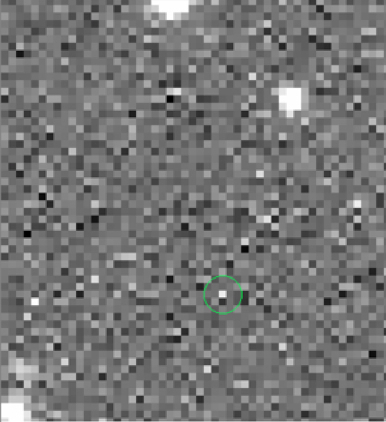
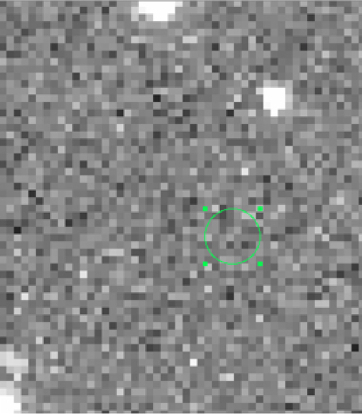
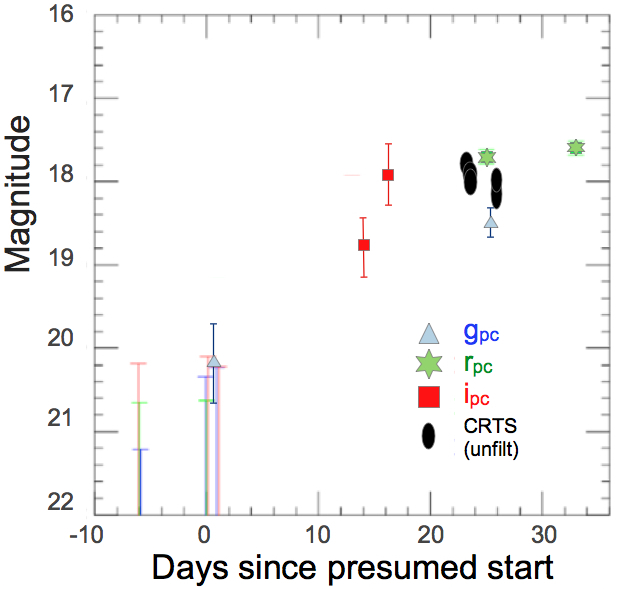
In addition to the production of a preliminary standard star catalog based upon previous standards, PreCam provides a preview of the science that will be conducted with the DES. SN2010lr, a Type Ia supernova discovered by the Catalina Real-Time Transient Survey, or CRTS (Drake et al., 2011), was observed by PreCam as well, and we show a preliminary light curve of the SN in Figure 15. The observed magnitude near 18 is in agreement with photometric measurements from the CRTS. Spectroscopic measurements by (Prieto et al., 2011) lead these authors to claim that this SN is most similar to SN1998bu with peak magnitude occurring around December 20 (Day 15 of the figure). Finally, it is worth noting that SN2010lr was seen (after the fact) in PreCam data from 2010-12-05, a date well before that of the initial CRTS discovery image. This initial detection was made at a magnitude significantly below that for which the PreCam survey is designed, thus the standard analysis procedures described above were not applied; instead, after data processing a single cut using Source Extractor’s DETECT_THRESH of 1.5 was made to generate the object catalogs that include the supernova. Therefore, we expect the photometric accuracy of this SN measurement to be significantly worse than for any of the standard stars in our catalog; nevertheless, the clear detection of the SN in the PreCam data is an encouraging sign of what will be accomplished with the significantly larger and more sensitive Dark Energy Survey.
6 Discussion
PreCam, a precursor observational campaign for calibration of the Dark Energy Survey, was designed to provide accurate photometric and astrometric measurements of stars in a sparse grid throughout the DES footprint, while the PreCam instrument also served as a testbed for various components of the Dark Energy Camera. We successfully completed observations of roughly half of the desired target fields comprising the PreCam survey grid by early 2011, and preliminary results based on the analysis of a subset of the data show that we are approaching the stringent requirements for calibration of the DES. During construction and operations we tested the pre-production DES DAQ system, (spare) CCDs for the DECam, ObsTac and the QR system, as well as various other components. As described above, many different issues were overcome during the commissioning and observations of PreCam, including a secondary mirror of insufficient optical quality, banding and streaking within the data, shutter failures, and data transport issues. Nevertheless, we were able to collect data during 51 out of 64 possible nights (80% duty cycle), and the vast majority of those data (well in excess of 90%) provides us with useful measurements of thousands of previously-measured standard stars and up to a hundred thousand potential new standard stars to a magnitude limit if ipc17. All of these will be incorporated into the forthcoming PreCam Standard Star Catalog and used as inputs to the DECam calibration procedures. Additional observations with the PreCam instrument to complete the proposed grid of new standard stars, using the Curtis-Schmidt or another telescope, are under consideration but are not approved at this time.
7 Conclusions
In an effort to provide a catalog of standard stars for improved calibration of the Dark Energy Survey, we designed, built, tested, installed, commissioned, and operated the PreCam instrument to collect observations over 51 days in 2010 and 2011. We performed PreCam survey observations in a sparse grid throughout the Dark Energy Survey footprint; photometric accuracy as compared to the SDSS catalog is between 3.0% and 5.0% for the sample of data described in this paper, and 2% as compared to the brighter stars of the u′g′r′i′z′ standard star catalog extensions. Final analysis of these data should allow us to reach the 2 photometric accuracy for nearly a hundred thousand stars suitable for DES standard star calibrations, and perhaps even obtain the desired 1 accuracy. The full PreCam Southern Hemisphere Standard Star Catalog will be released after complete analysis of the full PreCam dataset (Allam et al., 2013), but application of the standard star calibrations to the DES data will begin with the first light of DES, currently scheduled for September 2012.
References
-
Abbott et al. (2009)
Abbott, T., et al., available online at http://www.noao.edu/meetings/decam/media
/DECam_Technical_specifications.pdf - Albrecht et al. (2006) Albrecht, A., et al., Report of the Dark Energy Task Force; available online at arXiv:astro-ph/0609591v1
- Allam (2012) Allam, S. (in prep.)
- Allam et al. (2013) Allam, S., et al. (in prep.)
- Annis et al. (2005) Annis, J., et al., White Paper Submitted to the Dark Energy Task Force; available online at arXiv:astro-ph/0510195 (2005) For more information regarding the DES, see http://www.darkenergysurvey.org
- Annis & Neilsen (2012) Annis, J. and E. Neilsen (in prep.)
- Cardiel-Sas et al. (2008) Cardiel-Sas, L., et al., Proc SPIE 7014 (2008) 70146P. See also Castilla, J. et al., Proc SPIE 7735 (2010) 7735-311
- Bernstein et al. (2012) Bernstein, J.P. et al., Astrophysical Journal 753 (2012) 152
- Bertin & Arnouts (1996) Bertin, E. and S. Arnouts, Astronomy Astrophysics Supplement 317 (1996) 393
- Drake et al. (2011) Drake, A., et al. Central Bureau for Electronic Telegrams No. 2614, 1 January 2011 For further information on CRTS, see also Drake et al., Astrophysical Journal 696 (2008) 870
- Flaugher et al. (2012) Flaugher, B., et al. Proc SPIE 8446-35 (2012) (in press)
- Fukugita et al. (1996) Fukugita, M., et al., Astron. J. 111 (1996) 1748
- Honscheid et al. (2008) Honscheid, K., et al., Proceedings of SPIE 7019-11 (2008)
- Ivezi et al. (2007) Ivezi, ., et al., Astron. J 134 (2007) 973
- McLeod et al. (1998) McLeod, B.A., et al., Proc. SPIE 3355 (1998) 477-486
- Pickles (1998) Pickles, A. J., PASP 110, (199) 8638
- Prieto et al. (2011) Prieto, J., et al., Central Bureau for Electronic Telegrams No. 2620, 4 January 2011
- Rheault et al. (2012) Rheault,J. P., et al., Proc SPIE 8446-94 (2012) (in press)
- Schlegel et al. (1998) Schlegel, D.J., D.P. Finkbeiner, M. Davis, Astrophysical Journal, 500, 525 (20 June 1998)
- Shaw et al. (2012) Shaw, T., et al., Proc. SPIE 8453-100 (2012) (in press), and references therein
- Skrutskie et al. (2006) Skrutskie, M. F., et al., Astron.J. 131:1163 (2006)
- Smith et al. (2002) Smith, J. A., et al., Astron.J. 123:2121-2144 (2002)
- Smith et al. (2013) Smith, J. A., et al. (in prep.). See also http://www-star.fnal.gov/Southern_ugriz/index.html