Coherent Radiation from Extensive Air Showers in the Ultra-High Frequency Band
Abstract
Using detailed Monte Carlo simulations we have characterized the features of the radio emission of inclined air showers in the Ultra-High Frequency band (300 MHz - 3 GHz). The Fourier-spectrum of the radiation is shown to have a sizable intensity well into the GHz frequency range. The emission is mainly due to transverse currents induced by the geomagnetic field and to the excess charge produced by the Askaryan effect. At these frequencies only a significantly reduced volume of the shower around the axis contributes coherently to the signal observed on the ground. The size of the coherently emitting volume depends on frequency, shower geometry and observer position, and is interpreted in terms of the relative time delays with respect to a plane shower front moving at the speed of light. At ground level, the maximum emission at high frequencies is concentrated in an elliptical ring-like region around the intersection of a Cherenkov cone with its vertex at shower maximum and the ground. The frequency spectrum of inclined showers when observed at positions that view shower maximum in the Cherenkov direction, is shown to be in broad agreement with the pulses detected by the Antarctic Impulsive Transient Antenna (ANITA) experiment, making the interpretation that they are due to Ultra-High Energy Cosmic Ray atmospheric showers consistent with our simulations. These results are also of great importance for experiments aiming to detect molecular bremsstrahlung radiation in the GHz range as they present an important background for its detection.
pacs:
95.85.Bh, 95.85.Ry, 29.40.-nI Introduction
Radio pulses from ultra-high energy cosmic rays (UHECRs) were first observed in the 1960s and 1970s in coincidence with air shower arrays jelley ; allan but severe difficulties were encountered to extract sufficiently precise information about the showers themselves using this technique alone Fegan_review . Current advances in fast signal digitization and increased computational power have opened up new possibilities to exploit the technique and multiple efforts are being carried out to characterize these pulses in detail. Experiments such as AERA AERA in the context of the Pierre Auger Collaboration, LOPES LOPES in the context of KASCADE, and LOFAR LOFAR , are regularly detecting pulses. These experiments are typically operating in the 30-80 MHz range since the emission is expected to be at least partially coherent at those frequencies. There are also efforts to detect GHz emission from EAS claimed to originate from a different and yet unconfirmed mechanism: molecular bremsstrahlung Gorham_molecular , such as AMBER Gorham_molecular , MIDAS MIDAS , CHROME CHROME and EASIER microwave-auger .
Recently several events in the 300-900 MHz frequency range were serendipitously observed with the ANITA balloon-borne antenna array which was flown over Antarctica. These events have been claimed to be consistent with emission from Extended Air Showers (EAS) with energies between – eV ANITA_UHECR . Earlier claims of detection of UHECRs in the ultra-high frequency (UHF) band exist Fegan_Nature1 ; Spencer_Nature ; Fegan_Nature2 . Other experiments have also recently observed GHz radiation associated with EAS EASIER ; CHROME although at higher frequencies, typically above 3 GHz. These results motivate a careful study of the radio emission induced by UHECR showers paying particular attention to the UHF band in the 300 MHz - 3 GHz range.
The emission is due to both shower charges and currents: an excess of electrons accumulates because there are no positrons in the atmosphere, a mechanism predicted by Askaryan Askaryan62 , and drift currents are induced through the separation of positively and negatively charged particles in the magnetic field of the Earth Kahn-Lerche ; Allan_Nature ; Falcke_radio_EAS ; CODALEMA , with the latter mechanism dominating the emission.
When the induced currents and the net charge distributions move at a speed faster than the speed of light in the atmosphere, several features characteristic of Cherenkov emission appear, including an enhancement of the high frequency components of the field ZHAireS ; Scholten_arXiv . Calculations of the emission from air showers have been performed using Monte Carlo simulations ZHAireS ; REAS3 ; SELFAS ; COREAS , and analytical and semi-analytical techniques Scholten_MGMR ; Seckel_ARENA2012 .
In this work we characterize the features of the UHF emission from EAS using ZHAireS ZHAireS , a full Monte Carlo simulation of the air shower and its associated radio emission. The simulation is based on the AIRES shower code aires , and the emission is calculated using a well established algorithm allan obtained from first principles ZHS91 ; ZHS92 ; ARZ10 with which the electric field due to each individual charged particle track produced in the shower simulation is calculated. In this process interference between the emission from different tracks is carefully accounted for, including the variation of the refractive index with altitude. The algorithm does not assume any specific emission mechanism and correctly reproduces the radiation induced by the excess charge and the geomagnetic field ZHAireS .
II Characterization of radio emission in the UHF band
For the emission in the UHF band, inclined showers are addressed in more detail for two reasons: as they have the shower maximum high up in the atmosphere, the observation distance is usually quite far away and the conditions for coherent emission from different stages of shower evolution are strengthened ZHS_thinned . In addition it is inclined showers that have been observed in the GHz regime by ANITA. EAS have been simulated over Antarctica (altitude m above sea level and atmospheric density profile for the South Pole) with zenith angles between and , and radiation patterns at different positions on the ground have been obtained. A 55 magnetic field pointing towards North with an inclination of -72.42∘ has been assumed. Antennas have been positioned on the ground along East-West (E-W) and North-South (N-S) lines intersecting at the shower impact point, as shown in Fig. 1.
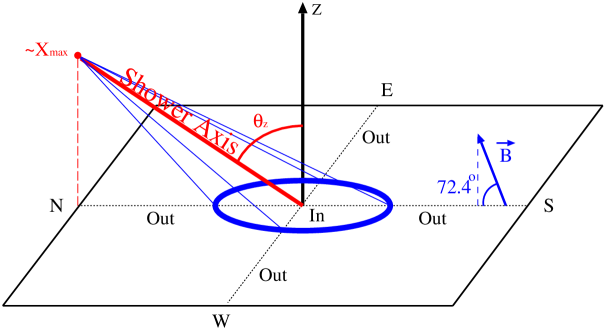
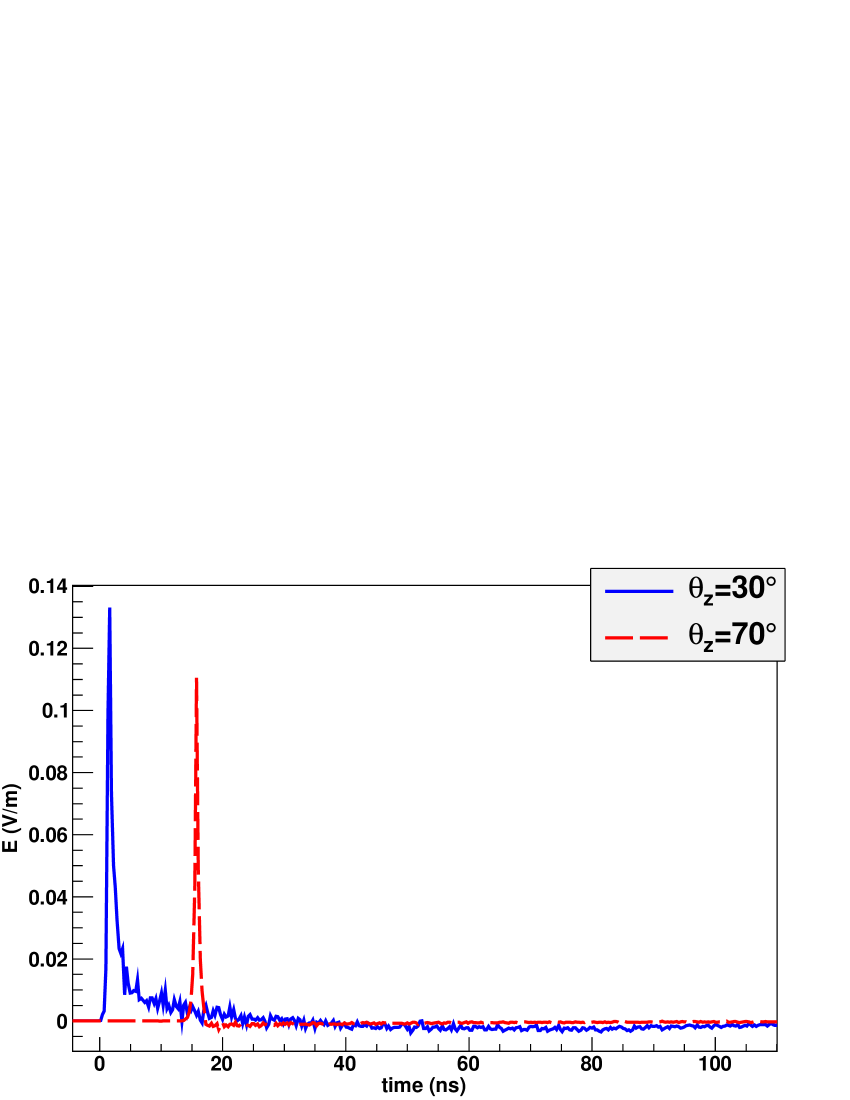
Our simulations of inclined showers predict strong pulses in the nano-second scale for antennas that view the depth of maximum shower development () at angles very close to the Cherenkov angle, i.e. antennas placed on an elliptical “ring” shown in Fig. 1, defined by the intersection of a Cherenkov cone centered at and the ground. This is in agreement with the results reported in ZHAireS ; Scholten_arXiv . As the observation point moves away from this region, to the inner or outer regions of the Cherenkov cone, there is a significant broadening in time of the pulse, which is equivalent to a relative lowering of the spectrum in the UHF band.
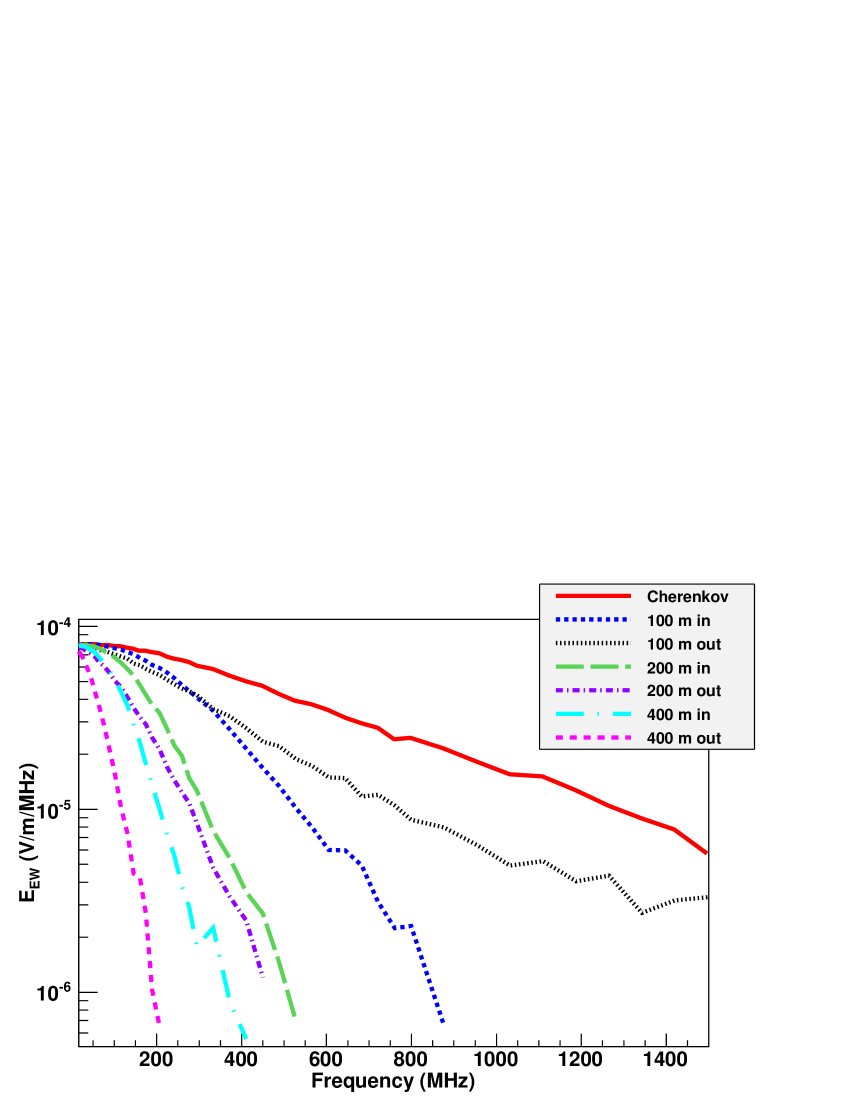
In Fig. 2 we show the frequency spectra for antennas lying on the ground along a W-E line that intercepts shower axis. The label “Cherenkov” refers to antennas that lay on the elliptical ring shown in Fig. 1, while numerical labels refer to the distance in meters from the ring to the antenna, either towards shower axis (in) or away from it (out). The spectra clearly become steeper as the observation points get further away from the Cherenkov ring. Only antennas located very close to the ring contain a significant signal in the UHF band111Note there is an asymmetry between the “in” and “out” directions..
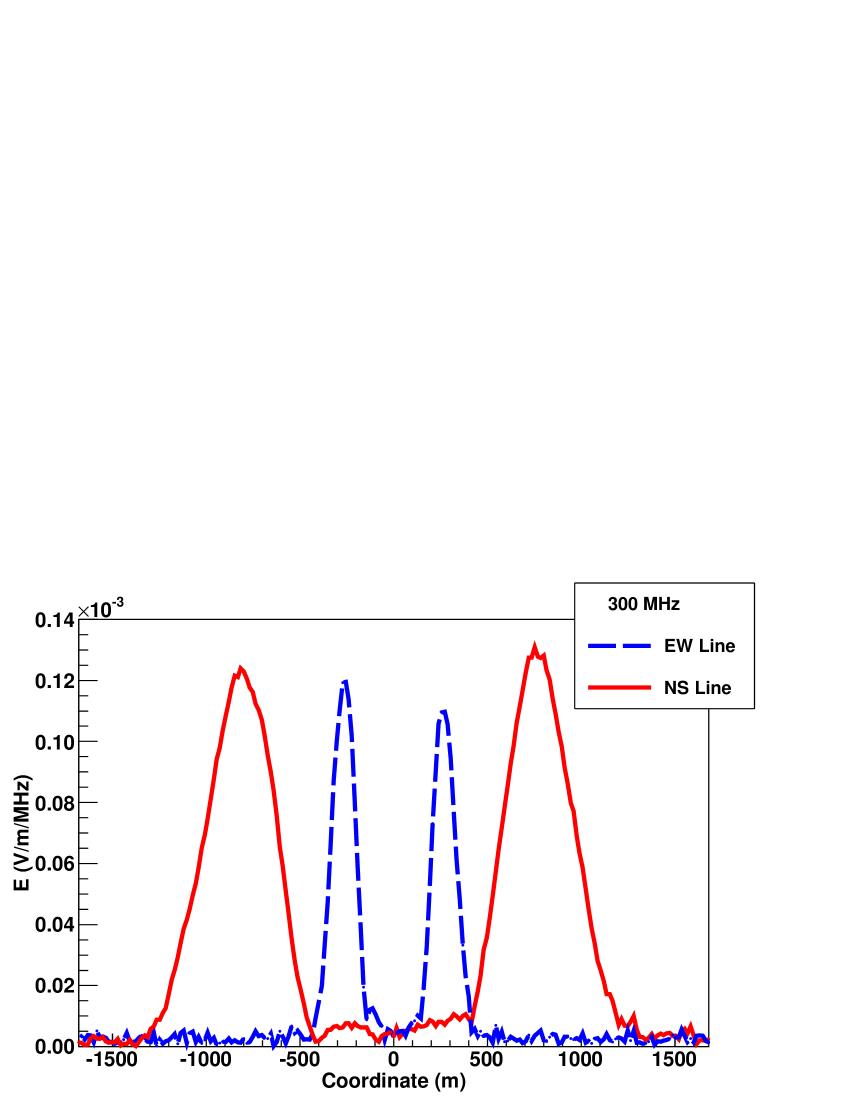
In Fig. 3 we show the spectral component of the electric field at 300 MHz as a function of distance to the shower core for antennas along the S-N and W-E axes. The shower comes from the North towards the South. The projection of the Cherenkov cone on ground makes an approximate ellipse with its major axis along the N-S direction as expected.
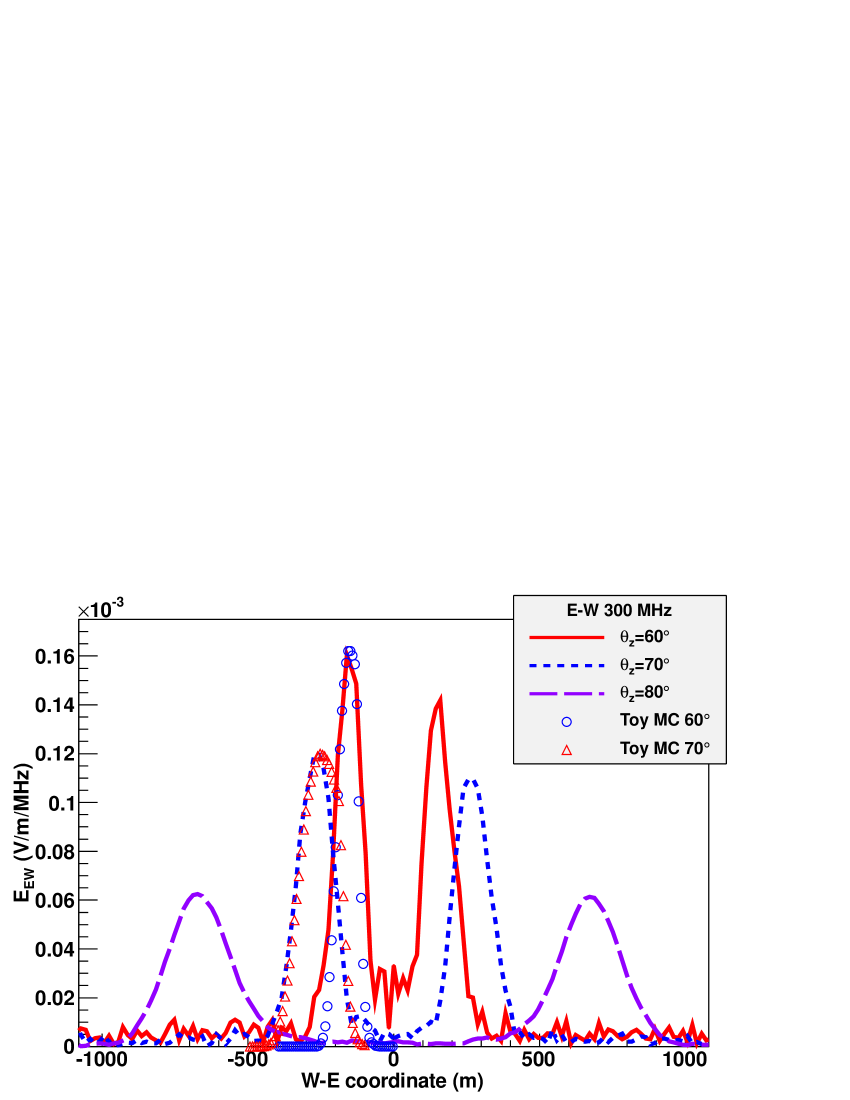
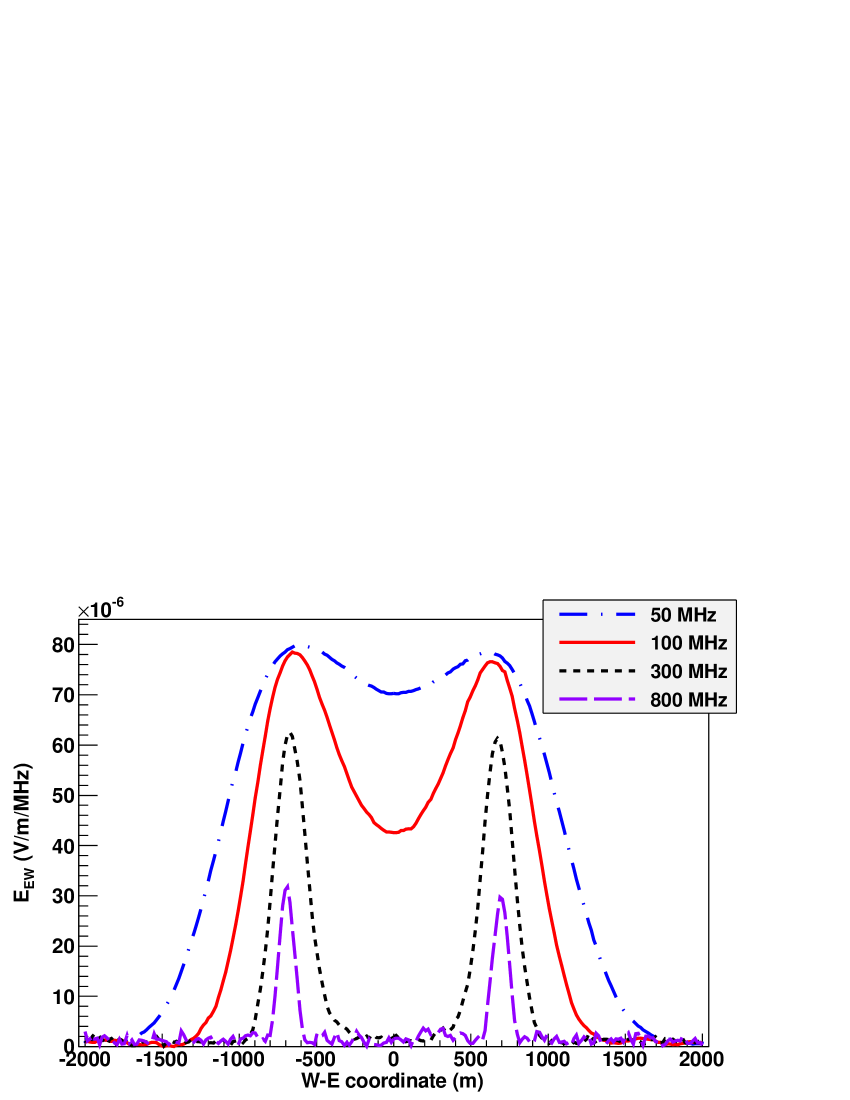
In Fig. 4 we show the spectral components of the electric field for a eV proton shower with three different zenith angles. The scaling of the major axis of the ring with is illustrated. The axes and area of the ring increase as the zenith angle rises because the shower maximum is more distant from the ground. This increase dominates the drop induced because the opening angle of the Cherenkov cone (i.e. the Cherenkov angle) decreases as decreases with altitude222In the UHF band the Cherenkov angle at an altitude corresponding to decreases in the UHF band from for a shower with zenith angle 50∘ to for a shower with .. In Fig. 5 the Fourier components of the field as a function of distance to the core are plotted for fixed zenith angle. As the frequency drops the angular width of the Cherenkov ring broadens (an effect already visible in Fig. 2), and eventually it becomes broader than the Cherenkov angle itself making a “plateau” in the radial coordinate on ground. This can be mostly appreciated in the 50 MHz frequency line shown in Fig. 5. There is evidence of this behaviour in the flattening of the lateral distribution of the signal close to the shower core in showers detected by the LOPES LOPES_LDF and LOFAR experiments LOFAR as pointed out in Scholten_PRL ; Scholten_arXiv .
III ANITA Observations
The ANITA collaboration has recently reported observations of UHECRs in the UHF band ANITA_UHECR . Most of these events are “reflected” events, meaning that the radiation from the shower is reflected on the Antarctic ice sheet towards the ANITA payload. The ANITA observations exhibit power spectra (i.e. electric field squared) falling exponentially with frequency as between 300-900 MHz, with an average exponential constant MHz for reflected events333Note that () is the constant of the exponential fall off of the electric field power (amplitude) spectrum.. The results shown in Fig. 2 for the electric field amplitude, when squared, fit well to an exponential fall-off in the UHF band with an exponential constant of MHz for an antenna located precisely in the Cherenkov ring, decreasing to MHz (84 MHz) for the antenna 100 m away towards the outside (inside) of the Cherenkov ring. The interpretation that the radiation detected with the ANITA instrument was due to extensive air showers induced by UHECRs ANITA_UHECR , is consistent with our simulations. The geometry must be such that the antenna is pointing in the direction of the reflected radiation emitted at the Cherenkov cone at shower maximum.
The ability of ANITA to observe events reflected from regions away from the Cherenkov ring on the ground is trigger limited. The ANITA trigger requires coincidences between several frequency bands registered by neighboring feeds as expected from impulsive signals. As a result the detector selects only those pulses with significant power over multiple bands of width ranging from to MHz centered at frequencies 265, 435, 650, and 990 MHz ANITA_instrument_paper . A steeply falling cosmic-ray energy spectrum favors triggers on events with flatter frequency spectra such as those expected near the Cherenkov ring.
Although we have only discussed the features of the spectrum on ground, we expect the reflection on the ice sheet as well as the larger distance from the shower to the ANITA payload when compared to the distance to ground, to reduce the strength of the spectrum but not to modify significantly the spectral features.
IV Interpretation: time delays
In order to interpret the features of the frequency spectrum on the ground as obtained in the full Monte Carlo simulations, regions of the shower that emit coherently at a given frequency have been studied. For this purpose, we have calculated for a given observer, the delays between the arrival time of the emission originated at different positions of the shower, with respect to the arrival of the earliest signal. For an observer in the Cherenkov ring, the earliest part of the signal originates at the shower axis, close to shower maximum. In order to contribute coherently at a given frequency the magnitude of the delays must be below a fraction of the period of that frequency. For the purposes of discussion we fix that fraction to one half of the period.
In the limit of very large distances to the shower, the Cherenkov condition guarantees that all points along the shower axis emit in phase for observation at the Cherenkov angle. However, this is not the case in a real situation with the observer at ground, since the shower as a whole is not observed in the far-field. In fact, as we move along the shower axis the angle of the line of sight to the observation point changes introducing time delays which induce destructive interference between different stages in the longitudinal development of the shower ZHS_thinned .
It is convenient to separate the time delays into geometrical delays associated to the position from which the radiation originates, and intrinsic time delays which are due to the fact that the shower front is lagging behind with respect to a plane front that moves at the speed of light because of both curvature and time spread. Geometrical delays can be calculated analytically. The time delay of the shower, as obtained in simulations with AIRES and measured in experiments conicalshape , is approximately proportional to the radius near shower axis with a constant 0.2 ns/m. In the calculation of the time delays we accounted for an index of refraction that varies with altitude in the same way as that in the full Monte Carlo simulation.
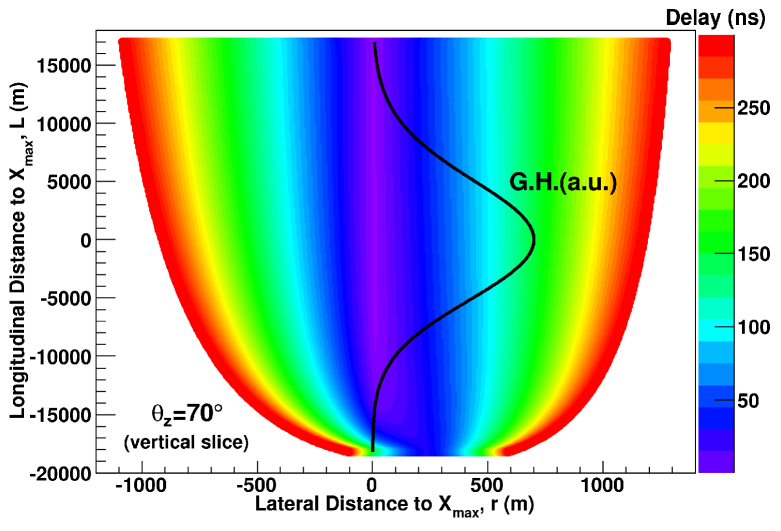
The total delays as a function of the position in the shower ( distance to shower axis, distance to ) from which the radio emission originates are displayed in Fig. 6 for a eV shower with of zenith angle. The shower is coming from the North and the observer is located on ground at the South and at a position such that is viewed at the Cherenkov angle (see Fig. 1). The coordinate is measured in the plane perpendicular to the shower axis along the North-South direction. A similar picture is obtained in the East-West direction. Clearly for this geometry it is first the lateral distribution that is responsible for the loss of coherence as the frequency increases. It can be appreciated that for the bulk of the shower - contained within the Moliére radius ( m for such a shower at ) - the time delays are below ns so that for frequencies well below 10 MHz the emission from all the shower is coherent.
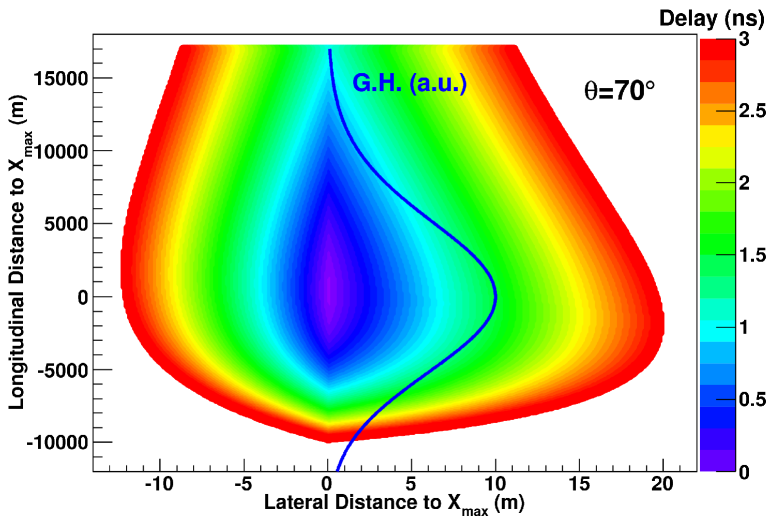
The central region of the shower is separated in the right panel of Fig. 6 to indicate the delay structure in the region relevant for UHF emission. The coherent region can be seen to extend to several km along the shower axis to either side of shower maximum. As points separated from the axis are considered, the intrinsic time delay of the shower front dominates for observers that see close to the Cherenkov angle. This limits the coherent volume to lateral distances smaller than m with the frequency of observation. As a consequence, the region contributing in phase is a long and thin volume along shower axis.
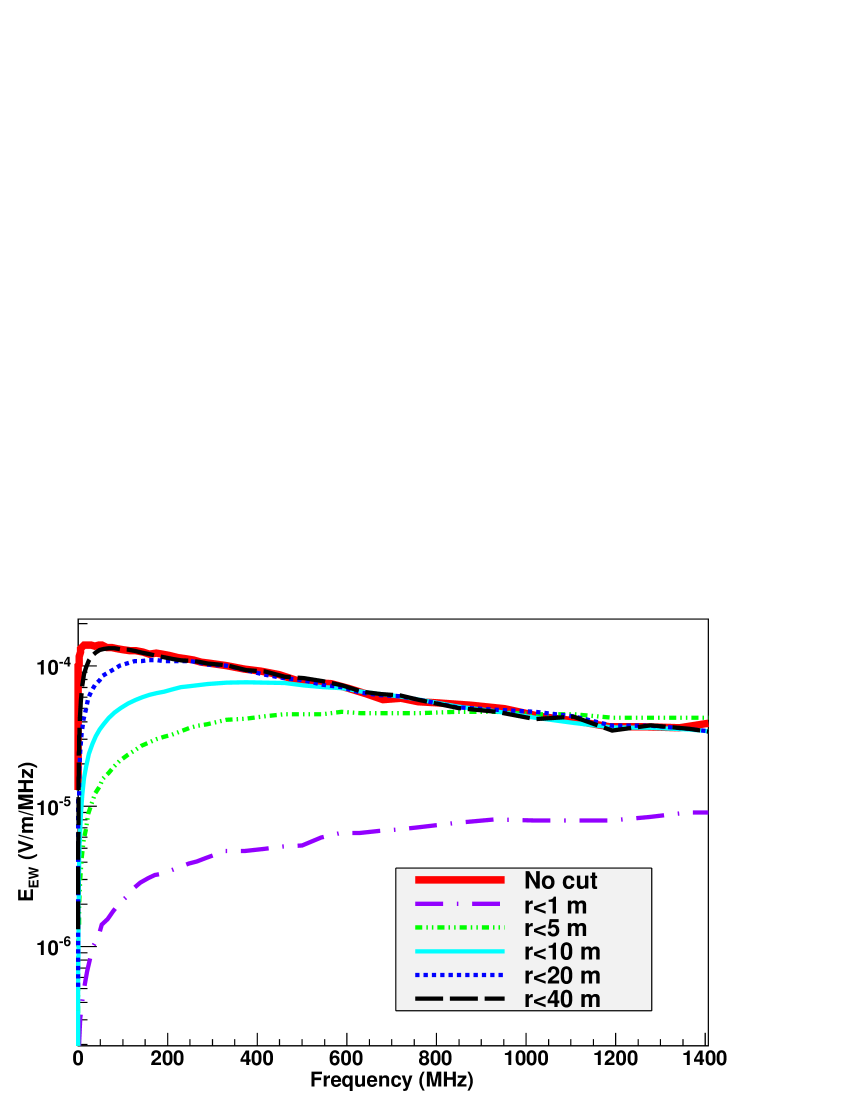
This is confirmed in full Monte Carlo simulations in which we obtained the Fourier spectrum for a eV proton shower with and compared it to that obtained accounting only for particles occupying a fractional volume of the shower. For frequencies above MHz the spectrum of the whole shower is mainly due to particles with m as shown in Fig. 7.
This picture resembles the simple model described in ZHAireS which neglects the lateral spread of the shower. In that model the high frequency signal was taken to be proportional to the value of the longitudinal distribution at the point that “views” the antenna in the Cherenkov direction. For inclined showers as is the focus of this work, this point must be replaced by an integral over the longitudinal distance along shower axis from which the bulk of the radiation is produced coherently at a given frequency in the UHF band. As the zenith angle decreases, the range of integration in the longitudinal dimension becomes smaller and the picture approaches again the model in ZHAireS .
IV.1 Lateral distribution of the field at ground level
For the observer viewing shower maximum at the Cherenkov angle, the volume contributing coherently occupies a region of the shower around where the number of particles is largest. This is illustrated in Fig. 6 where the longitudinal shower profile is depicted on top of the spatial distribution of the delays. As a consequence, for this observer the electric field is largest. If the observer moves along the radial direction in such a way that the shower maximum ceases to be in the Cherenkov direction, the volume contributing coherently moves upwards or downwards with respect to into regions in the atmosphere where the number of charges contributing to the emission is typically smaller, and the electric field is reduced. This leads to the lateral distribution of the Fourier components of the field shown in Figs. 3, 4 and 5. Using the simple model in ZHAireS accounting for the proper longitudinal region and the depth development of the number of charged particles in the cascade, the lateral distribution can be reproduced as shown in Fig. 4. This indicates that the measurement of the spectral components in the UHF band at different distances to the impact point can be related to the longitudinal development of the shower.
IV.2 Frequency spectrum at ground level
The approach of studying the time delays in the shower, allows us to interpret the frequency spectrum not only in the UHF band but at all frequencies, and all shower zenith angles including vertical showers.
The spectrum at ground from frequencies below 1 MHz up to GHz for a eV proton induced shower with , and for an observer viewing shower maximum at the Cherenkov angle is shown in Fig. 8. Qualitatively, at very low frequencies the delays for any region in the shower are smaller than half the period of the corresponding frequency, and the coherent volume spans the whole shower. There is no loss in coherence from the volume of the shower contributing most to the emission as the frequency increases because it is constant with frequency. Since the electric field contributed by each particle track is proportional to frequency ZHS92 , the total field increases in the same fashion for frequencies below MHz as can be seen in Fig. 8. As the frequency increases, the coherent volume starts to shrink but only in the lateral dimension. In the longitudinal direction and close to the shower axis, the delays are still small compared to half the period of the frequency because the observer is close to the Cherenkov angle for the bulk of the inclined shower. This can be seen in the left panel of Fig. 6. At and far from the shower axis the delays are ns. This translates into a frequency MHz at which the coherent volume starts to shrink laterally. The slope of the spectrum begins changing at that point due to the decrease in the number of particles contributing coherently. The change of slope is mild around 2 MHz because only particles outside the Moliere radius of the shower stop contributing coherently, and those constitute a small fraction of the shower, typically . At some frequency the lateral dimension of the shrinking volume of the coherent region reaches the Moliére radius ( m at for a shower). Since the typical delay at the Moliere radius for a shower around is ns, this occurs at a frequency of MHz. For the lateral distribution is flatter than when , and the decrease in the number of particles contributing coherently is more important in relative terms as the frequency increases. As a consequence the spectrum flattens. This behavior is clearly seen in the spectrum obtained in full Monte Carlo simulations shown in Fig 8. Near the lower edge of the UHF band, at MHz, only the volume inside which the delays are smaller than ns contributes coherently. This volume is depicted in the right panel of Fig. 6 and it is of order 10 m lateral width. As the frequency increases above MHz, the coherent volume shrinks in both the lateral and longitudinal dimensions, with the consequence that the spectrum starts dropping exponentially with frequency, as obtained with our full Monte Carlo simulations shown in Figs. 2 and 8.
In essence, this is very similar for more vertical showers. The main difference is that the drop in the spectrum begins at a lower frequency as can be seen in Fig. 8 where we show the spectrum for a proton shower of energy eV. The reason for this is that in a more vertical shower the geometrical delays due to the longitudinal shower dimensions are typically larger than in the inclined case over the whole region in space occupied by the shower, and they start to become of the order of the lateral and intrinsic delays at a smaller frequency. As a result the time structure of the pulse has a broader time scale for vertical showers and the high frequency components, although present, appear as a small modulation of the pulses.
V Summary and outlook
The radio signal emitted from UHECR air showers has been shown to have a sizable intensity well into the GHz frequency range. In relative terms the UHF components are more important for inclined showers than for vertical ones. When projecting on the ground, the peak of the UHF signal is located at a narrow elliptical ring defined by the intersection of the Cherenkov cone at shower maximum and the ground. The width of the ring becomes narrower as the frequency is increased. The lateral distance to shower axis at which the UHF signal is recieved at highest amplitude depends on geometry, increasing with zenith angle, and reaching hundreds of meters for showers of .
We have shown that the lateral distribution for the low frequency components of the radio pulses, typically below 100 MHz, displays a rather flat behavior with distance to the shower core until a position is reached at which shower maximum is viewed at the Cherenkov angle ZHAireS ; Scholten_PRL . This behavior is consistent with observations made at LOPES LOPES_LDF and LOFAR LOFAR and should be taken into account when trying to obtain the shower geometry and properties from the radio pulse measurements AERA .
The frequency spectrum of the pulses received in the Cherenkov cone has been shown to extend well into the GHz regime and to fall with an exponential slope in the UHF band, with a constant that is largest at the Cherenkov angle and drops as the observer views shower maximum away from the Cherenkov angle. Predictions for short radio pulses at ns scales follow from the spectra obtained for inclined showers.
In the case of more vertical showers, although the UHF components exist, the pulses are dominated by the lower frequency components and thus give typically a much broader pulse in time.
Our results indicate that by looking at the pulses at different distances from the shower core with a dense array it could be in principle possible to obtain information about the depth development of the shower Scholten_arXiv , but the detectors mut be positioned at fairly close distances because the Cherenkov cone is typically very narrow. These results provide an important background for experiments that are trying to measure molecular bremsstrahlung radiation from extensive air showers, and should be carefully considered in order to properly interpret measurements made in the UHF band. It is worth noting that molecular bremsstrahlung is thought to be isotropic Gorham_molecular , while the geomagnetic radiation studied in this paper is highly collimated in the direction of the Cherenkov cone.
The power spectra obtained in the Cherenkov direction are consistent with the spectra measured at ANITA and attributed to radio pulses from UHECR ANITA_UHECR . The results of the simulations made in this work further support this hypothesis. An event by event comparison of ANITA pulses and realistic predictions, followed by a simulation of the experiment would further strengthen this claim. The third flight of ANITA, scheduled for 2013-2014, is expected to detect hundreds of cosmic rays ANITA_UHECR , and could provide a highly significant test of the expected UHECR pulse properties. The EVA (Exa-Volt Antenna) project EVA could increase the event rate by a factor of 10.
VI Acknowledgments
J.A-M, W.R.C., M.T. and E.Z. thank Xunta de Galicia (INCITE09 206 336 PR) and Consellería de Educación (Grupos de Referencia Competitivos – Consolider Xunta de Galicia 2006/51); Ministerio de Educaci´on, Cultura y Deporte (FPA 2010-18410 and Consolider CPAN - Ingenio 2010); ASPERA (PRI-PIMASP-2011-1154) and Feder Funds, Spain. We thank CESGA (Centro de SuperComputación de Galicia) for computing resources. Part of this research was carried out at the Jet Propulsion Laboratory, California Institute of Technology, under a contract with the National Aeronautics and Space Administration.
References
- (1) J.V. Jelley et al., Nuovo Cimento X 46, 649 (1966).
- (2) H. R. Allan, in: J. G. Wilson, S. A. Wouthuysen (Eds.), Progress in Elementary Particle and Cosmic Ray Physics, North Holland, (1971), p. 169.
- (3) D.J. Fegan, Nucl. Instrum. Meth. A 662, S2-S11 (2012), and references therein.
- (4) S. Fliescher for the Pierre Auger Collaboration, Nucl. Instrum. Meth. A 662, S124 (2012).
- (5) A. Nigl et al. [LOPES Collab.], Astron. Astrophys. 488, 807 (2008).
- (6) A. Corstanje et al., Proceedings of the ICRC, Beijing, China (2011).
- (7) P.W. Gorham et al. Phys. Rev. D 78, 032007 (2008).
- (8) J. Alvarez-Muñiz et al. [MIDAS Collab.] arXiv:1205.5785 [astro-ph] submitted to PRL; P. Privitera et al, Nucl. Phys. B, 212-213, 329 (2011)
- (9) R. Smida et al. [CHROME group], Proceedings of the ICRC, Beijing, China (2011).
- (10) P.S. Allison for the Pierre Auger Collaboration, Proceedings of the ICRC, Beijing, China (2011).
- (11) S. Hoover et al. [ANITA Collaboration], Phys. Rev. Lett. 105, 151101 (2010).
- (12) D.J. Fegan, P.J. Slevin, Nature 217, 440 (1968).
- (13) R.E. Spencer, Nature 222, 460 (1969).
- (14) D.J. Fegan, D.M. Jennings, Nature 223, 722 (1969).
- (15) P. Facal San Luis, for the Pierre Auger Collaboration, to appear in Proceedings of the International Symposium on Future Directions in UHECR Physics (UHECR 2012), CERN, Geneva (2012).
- (16) J. Alvarez-Muñiz, W. Rodrigues, M. Tueros and E. Zas, Astropart. Phys., 35, 325, (2012).
- (17) K. Werner, K.D. de Vries, O. Scholten, arXiv:1201.4471 [astro-ph].
- (18) Askar’yan, G.A., Soviet Physics JETP 14,2 441–443 (1962); 48 988–990 (1965).
- (19) H. Falcke et al., Nature 435, 313 (2005).
- (20) D. Ardouin et al., Astropart. Phys. 31, 192 (2009).
- (21) F.D. Kahn, I. Lerche, Proc. Roy. Soc. A289, 206 (1966).
- (22) H.R. Allan, R.W. Clay, J.K. Jones, Nature 227, 1116 (1970).
- (23) F. Halzen, E. Zas, T. Stanev, Phys. Lett. B 257, 432 (1991).
- (24) E. Zas, F. Halzen, T. Stanev, Phys. Rev. D 45, 362 (1992).
- (25) J. Alvarez-Muñiz, A. Romero-Wolf, E. Zas, Phys. Rev. D 81, 123009 (2010).
- (26) http://www.fisica.unlp.edu.ar/auger/aires/egAires.html, S.J. Sciutto.
- (27) M. Ludwig, T. Huege, Astropart. Phys. 34, 438 (2011)
- (28) V. Marin and B. Revenu, Astropart. Phys. 35, 733 (2012)
- (29) T. Huege et al. to appear in Procs. of the ARENA 2012, Erlangen (Germany)
- (30) O. Scholten, K. Werner, F. Rusydi, Astropart. Phys. 29, 94 (2008); K. Werner, O. Scholten, Astropart. Phys. 29, 393 (2008).
- (31) D. Seckel et al. to appear in Procs. of the ARENA 2012, Erlangen (Germany)
- (32) K. D. de Vries, A. M. van den Berg, O. Scholten, K. Werner Phys. Rev. Lett. 107, 061101 (2011)
- (33) J. Alvarez-Muñiz, C.W. James, R.J. Protheroe, Astropart. Phys. 32, 100 (2009).
- (34) K.D. de Vries et al., Astropart. Phys. 34, 267 (2010).
- (35) W.D. Apel et al. [LOPES Collab.] Astropart. Phys. 32, 294 (2010).
- (36) P.W. Gorham et al. Astropart. Phys., 32, 10 (2009).
- (37) A.K. Calabrese Melcarne, L. Perrone, A. Surdo, for the ARGO-YBJ Collaboration, Proceedings of the ICRC, Lodz, Poland (2009)
- (38) P.W. Gorham, F.E. Baginski, P. Allison, K.M. Liewer, C. Miki, B. Hill, G.S. Varner, Astropart. Phys. 35 242, (2011)