Anisotropic electrical resistivity of LaFeAsO:
evidence for electronic nematicity
Abstract
Single crystals of LaFeAsO were successfully grown out of KI flux. Temperature dependent electrical resistivity was measured with current flow along the basal plane, , as well as with current flow along the crystallographic -axis, , the latter one utilizing electron beam lithography and argon ion beam milling. The anisotropy ratio was found to lie between /. The measurement of was performed with current flow along the tetragonal [1 0 0] direction and along the [1 1 0] direction and revealed a clear in-plane anisotropy already at K. This is significantly above the orthorhombic distortion at T0 =147 K and indicates the formation of an electron nematic phase. Magnetic susceptibility and electrical resistivity give evidence for a change of the magnetic structure of the iron atoms from antiferromagnetic to ferromagnetic arrangement along the -axis at K.
I Introduction
The discovery of superconductivity in fluorine-doped LaFeAsO by Kamihara et al. Kamihara et al. (2008) led to the finding of several other iron-based superconductors. A common feature among these materials is an antiferromagnetic (AFM) ordering of iron in parent compounds that has to be sufficiently suppressed to induce superconductivity Johston (2010); Stewart (2011). Furthermore, there is increasing evidence for the relevance of an electron nematic phase on the emergence of superconductivity Fang et al. (2008). Thereby, the electronic symmetry is broken when compared to the underlying crystallographic symmetry, i.e., the 4-fold rotation symmetry along the crystallographic -axis is broken in the tetragonal phase of the Fe-based superconductors. Electronic nematicity has been intensely studied in Fe2As2 compounds ( = Ca, Ba, Sr), mainly by measuring the in-plane anisotropy of the electrical resistivity Tanatar et al. (2010); Chu et al. (2010); Blomberg et al. (2011); Fisher et al. (2011); Blomberg et al. (2012). Recent theoretical work by Fernandes et al. showed that the observed in-plane anisotropy can be well described within a nematic scenario Fernandes et al. (2011). Further evidence for a broken in-plane symmetry stems from inelastic neutron scattering Lester et al. (2010), elastic properties Fernandes et al. (2010), optical spectroscopy Nakajima et al. (2011); Dusza et al. (2012), angle resolved photo emission spectroscopy Wang et al. ; Yi et al. (2011), and magnetic torque measurements Kasahara et al. (2012). These results could be obtained because good quality single crystals are available for the Fe2As2 compounds. In contrast, the synthesis and in particular the single crystal growth for the other large family of Fe-based superconductors, the FeAsO compounds with = rare earth metal, is still more challenging Karpinski et al. (2009); Yan et al. (2011). Accordingly, the situation is much less clear and the relevance of nematic fluctuations for the FeAsO is not settled. Indications for a breaking of the 4-fold rotation symmetry in the tetragonal phase of LaFeAsO can be inferred from structural and elastic properties which show a ’gradual orthorhombic distortion’ McGuire et al. (2008); Qureshi et al. (2010) and a softening of elastic moduli McGuire et al. (2008), respectively, for cooling below K which is well above the proposed structural transition temperature of T0 K.
Here we present results on the anisotropic electrical resistivity of LaFeAsO giving direct evidence for a broken in-plane symmetry and show that nematic fluctuations are a general property of both Fe2As2- and FeAsO-type compounds.
II Experimental
Large LaFeAsO single crystals were grown by a high-temperature adaptation of the growth conditions described in Ref. 24. The reactants are air-sensitive and were handled in an argon-filled glovebox (M. Braun, ppm, ppm, argon purified with molecular sieve and copper catalyst). Iron(II)-oxide (%, Sigma-Aldrich), arsenic (%, Alfa Aeser), and freshly filed lanthanum (%, Treibacher) were mixed and transferred to a glassy carbon crucible (diameter: mm, height: mm, wall thickness: mm). wt.-% of potassium iodide (%, Grüssing, dried at K in dynamic vacuum) was used as the flux and stacked below and above the reactants. Subsequently, the crucible was enclosed in a tantalum container and welded closed at mbar argon atmosphere.
The mixtures were heated to K over hours in a furnace with static argon atmosphere. After 5 hours, the furnace was slowly cooled down to K (batch 1) or K (batch 2) at K /hour and finally cooled down to room temperature (RT) at K/ hour (no systematic differences between batch 1 and batch 2 were observed).
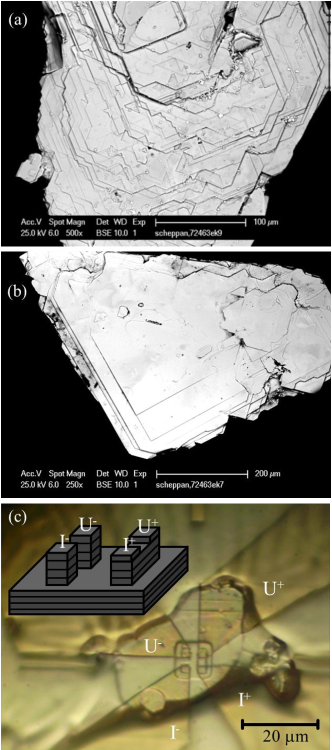
The flux was removed by deionized water to isolate plate-shaped single crystals of up to a millimeter along a side. Electron micrographs of two LaFeAsO single crystals are shown in Fig. 1(a,b). The surfaces can form pronounced terraces (a) or be rather flat (b). Note, the size of the single crystals is sensitive to the grain size of iron(II)-oxide; grinding the starting material to a fine powder resulted in significantly smaller LaFeAsO single crystals whereas the presence of iron(II)-oxide lumps ( mm) favors the growth of larger samples. Further attempts to evaluate the influence of the solubility of FeO in KI-flux have been performed by cold-pressing ground FeO powder into a pellet and using this as starting material. After carrying out the growth procedure as described above, the original pellet form was still recognizable. However, this hard and stable pellet was found to consist of Fe2As instead of FeO. The other products were La2O3, LaAs, and a minuscule amount of LaFeAsO. Using polycrystalline LaFeAsO and KI-flux as starting materials did not yield single crystals. These observations point to a non-equilibrium crystal growth with the details being thus far unclear.
Energy dispersive x-ray analysis revealed a stoichiometric La:Fe:As content and confirmed the presence of oxygen. The characteristic emission lines of potassium or iodine were not observed, thus substantial inclusion or incorporation of the flux material can be excluded. Powder x-ray diffraction patterns were measured at K on a Stadi P diffractometer (Stoe & Cie., Cu , Ge monochromator). Lattice parameters were determined by LeBail pattern decomposition using GSASLarson and Von Dreele and EXPGUIToby (2001). To orient the large single crystals and to assess their mosaicity, images of sections of the reciprocal space were recorded using a Buerger precession camera (Huber, Mo anode, Zr filter). Low temperature scans (1∘) of single crystals, cooled with an Oxford Cryostream 700, were collected with a Bruker SMART diffractometer (Mo , graphite monochromator).
Electrical resistivity for current flow along the basal plane, , was measured in a 4-point geometry using the AC transport option of a Quantum Design Physical Property Measurement System (PPMS). Silver paint was used to connect Pt-wire to the as-grown plate-like samples [Fig. 4(b)].
To measure the electrical resistivity along the crystallographic -direction, , mesa structures were created using electron beam lithography and argon ion beam milling on LaFeAsO single crystals [Fig. 1(c)]. First, two quadratic and one rectangular mesa were etched out of a single crystal. Second, two additional mesas were designed on top of the rectangular mesa. In the last step, silver leads were structured on top in order to measure the -axis transport of the rectangular mesa (for more detailed information see Ref. Probst, ). Note that this geometry has a small -plane contribution to the electrical resistance. However, its contribution is negligible as long as . The effective dimensions of the mesas were 2 m 6 m 0.24 m (sample 5) and 6 m 18 m 0.29 m (sample 6). The -axis transport measurements from K were performed using a self made dipstick setup inside a standard liquid He transport dewar.
Magnetization measurements were performed using a Quantum Design Magnetic Property Measurement System (MPMS).
III Structural characterization
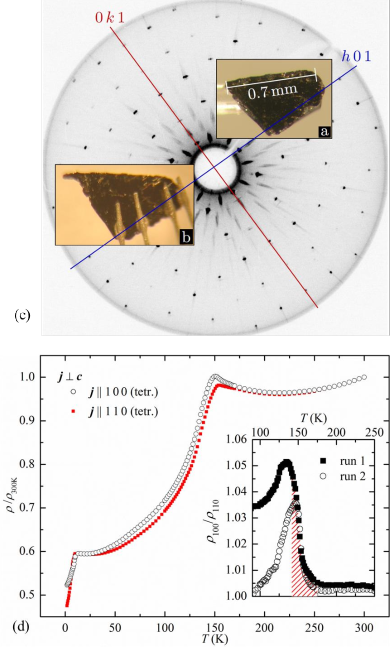
X-ray diffraction of large single crystals (Fig. 1a,b and Fig. 4a,b) revealed as the dominant growth directions for LaFeAsO. The plate-shaped crystals exhibit mostly , faces with a high aspect ratio (typically above 20). The growth along directions is much slower than along the perpendicular directions. This leads to unstable growth conditions perpendicular to the basal plane. Consequently, the surface appears rough and a higher mosaicity can be observed for reflections. Reflections of reciprocal planes perpendicular to (e.g. reflections in Fig. 4) are of low mosaicity and show no significant misorientation parallel to the basal plane. Therefore, oriented transport measurements are feasible on these large single crystals.
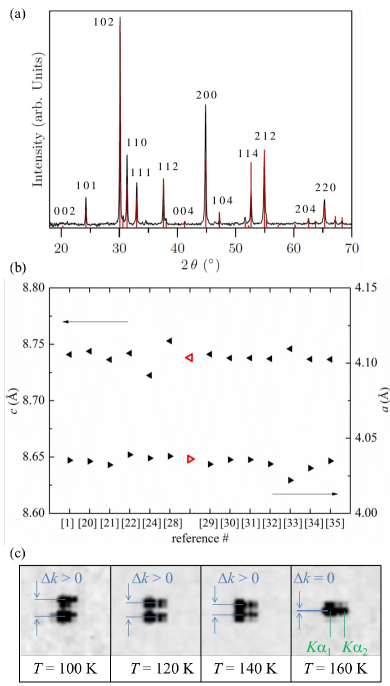
An x-ray powder diffraction pattern measured on ground single crystals is shown in Fig. 2a. The obtained lattice parameters of Å and Å are plotted in Fig. 2b in direct comparison with selected literature data (published standard deviations are smaller than the size of the symbols, the reference number is given on the abscissa: 1 - Ref. Kamihara et al., 2008, 2 - Ref. McGuire et al., 2008, 3 - Ref. Qureshi et al., 2010, 4 - Ref. Shekhar et al., 2009, 5 - Ref. Nitsche et al., 2010, 6 - Ref. Quebe et al., 2000, 7 - this paper, 8 - Ref. Nomura et al., 2008, 9 - Ref. Wang et al., 2009, 10 - Ref. Cao et al., 2009, 11 - Ref. Qi et al., 2009, 12 - Ref. Yan et al., 2009b, 13 - Ref. de la Cruz et al., 2008, 14 - Ref. Luo et al., 2009). There is no significant deviation of our data from the statistical average of the lattice parameter. We emphasize this point to stress that the unprecedented change of the Fe magnetic structure (see below) is not a result of different lattice parameters.
However, the influence of the As -parameter on physical properties has not been studied systematically and can be responsible for the pronounced sample dependencies found for LaFeAsO in this as well as in other studies Yan et al. (2009a). In fact, band structure calculations revealed a significant influence of the As -parameter on electronic structure and magnetic properties Krellner et al. (2008). An accurate experimental determination of the As -parameter can be done by means of single crystal x-ray diffraction. However, the single crystals used for electrical resistivity measurements are too large for this technique. An isolation of smaller suitable samples failed since the plate-like crystals are malleable and mechanical stress can easily lead to bending which causes broad reflection profiles. Detailed results on the As -parameters of FeAsO ( = La, Ce, Pr, Nd, Sm, Gd, and Tb) obtained on smaller single crystals were presented in an earlier publication Nitsche et al. (2010).
Figure 2(c) shows the 8 0 0 reflection in the tetragonal phase at K (right hand side) and its splitting at K manifesting the structural distortion from tetragonal to orthorhombic symmetry in agreement with an ordering temperature of T0 =147 K inferred from resistivity measurements (see below). The peak-broadening along the horizontal direction is caused by the presence of both Mo and Mo radiation. The orthorhombic splitting further increases under cooling to and 100 K. However, the temperature calibration of the setup ( K) is not sufficient for a quantitative analysis of the temperature dependence of the order parameter.
IV Electrical resistivity
IV.1 Anisotropy: ab-plane vs. c-axis
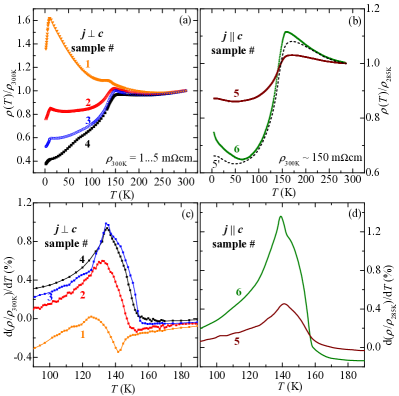
Fig. 3a shows the electrical resistivity of four LaFeAsO single crystals from two different batches, all normalized to RT, with current flow perpendicular to the -axis, . Sample 2 and 4 belong to batch I, sample 1 and 3 belong to batch II. The resistivity at RT varies from sample to sample between 1 to 5 mcm without any correlation to the temperature dependence. Since the geometry factor is not well defined for these plate-like samples the absolute values are approximate.
K: All four samples exhibit a minimum in shifting progressively from K for sample 1, to K for sample 2, to K for sample 3, and to K for sample 4. The correlation with the low- behavior is evident: if the minimum occurs at higher temperatures and accordingly increases strongly while cooling towards T0 then shows a similar tendency to increase with decreasing at low temperatures.
T 150 K (T, T0): A sharp change of slope in at K marks the structural transition and the AFM ordering of Fe in all samples. The derivatives with respect to temperature, d/d, are plotted in Fig. 3c. The Néel temperature of Fe, determined by the maximum of the peak in d/d, was found to be T = 135 K for samples 3 and 4, which show relatively sharp maxima. For samples 1 and 2 the peak in d/d is shifted to lower temperatures and is less pronounced but not significantly broadened. Taking into account the different -dependence of above and below T, it is presumably not a lower T that causes the maximum in d/d to occur at lower but the different ’background’ of in samples 1 and 2. The peaks in d/d for samples 3 and 4 have a shoulder towards higher temperatures that can be used to define the ordering temperature of the structural transition, T0 (see Ref. Jesche et al., 2010). For samples 3 and 4 we find T0= 147 K which is K above T. Even though the shoulder in d/d is less pronounced for samples 1 and 2, a similar splitting between T and T0 can be inferred from the total width of the peak.
K: Under cooling the resistivity is either increasing (sample 1), decreasing (samples 3 and 4), or first decreasing followed by increasing (sample 2). Three possible explanations for this behavior are discussed in sec. VI.1.
A sharp drop in at K has been observed in all samples. This behavior is reminiscent of NdFeAsO Tian et al. (2010), where a similar anomaly in has been observed at K which is, as shown by neutron diffraction, associated with a change of the magnetic structure of Fe from AFM to ferromagnetic (FM) arrangement along the -axis. For both AFM and FM arrangement along the -axis, the Fe-moments are (anti)-parallel aligned along the orthorhombic -axis with an AFM arrangement along the -axis and a FM arrangement along the -axis. In case of AFM arrangement along the -axis a stripelike order forms and the magnetic unit cell is doubled along the -axis when compared to the crystallographic unit cell. For FM arrangement along the -axis the magnetic unit cell corresponds to the orthorhombic crystallographic unit cell.
Since the magnetic exchange along the -axis seems to be frustrated in the FeAsO systems, i.e., on the verge between AFM and FM, since the effective coupling changes from FM ( = Ce Zhao et al. (2008), Pr Kimber et al. (2008), and Nd Tian et al. (2010) for ) to AFM ( = La de la Cruz et al. (2008), Nd Tian et al. (2010) for ), we propose a similar change in the AFM structure of Fe in LaFeAsO at K. As will be discussed below, the measured magnetic susceptibility supports this interpretation. Note, we also synthesized CeFeAsO as described in the experimental section above and did not observe additional anomalies in besides the ones at T and . Therefore, the use of KI-flux is not sufficient for the emergence of a -anomaly which gives further evidence for the proposed scenario since the arrangement of the Fe-moments in CeFeAsO is already FM along the -axis.
Scanning electron microscope images revealed a rough surface for sample 1 with -planes forming distinct plateaus separated by sharp steps whereas sample 4 shows a rather smooth surface [Fig. 1(a,b)]. Furthermore, a clear trend of a subsequently increasing roughness is observable from sample 1 to sample 4 (not shown). With the electrical contacts sitting on different -planes, a voltage drop along the -axis can affect the measurement of . Therefore, we suspected a varying, semi-conducting -axis contribution to the electrical resistivity to be the origin for the pronounced sample dependence. To prove this assumption the resistivity with current flow along the -axis, , was measured for 2 samples from batch I. The resistivity at K was found to be mcm and mcm for sample 5 and sample 6, respectively, which is two orders of magnitude larger than . The temperature dependent resistivity normalized to K is plotted in Fig. 3b. In contrast to no minimum was observed in at K instead increases monotonously towards approaching T0. The increase in of sample 6 at low- ( K) is more pronounced than in sample 5 reflecting the high- behavior ( K) corroborating the trend observed in . However, if the resistivity of sample 5 is normalized to match the high- slope d/d of sample 6, which can compensate for different residual resistivities and uncertainties in the geometry factor, the temperature dependence of both samples becomes similar, as seen in Fig. 3(b) (curve 5’, dashed line).
Fig. 3d shows the derivative of with respect to temperature, d/d. The maxima are observed at K and K for sample 6 and 5, respectively, which is slightly above the values found for and probably caused by a different ’background’.
IV.2 In-plane anisotropy
Rigorously measuring the in-plane anisotropy of the electrical resistivity requires a detwinning of the samples since four types of twin domains form in the orthorhombic, AFM state Tanatar et al. (2010). Therefore, the electrical resistivity of twinned samples is a combination of the - and -axis contributions for current flow along the tetragonal directions or a more complex superposition depending on the in-plane angle for current flow along arbitrary in-plane directions. Detwinning of the present LaFeAsO single crystals is technically difficult to achieve due to the relatively small sample size. However, it has been shown for BaFe2As2 that even free standing crystals do not develop an equal population of each domain orientation Blomberg et al. (2012). Accordingly, a finite in-plane anisotropy of the electrical resistivity can be expected even in twinned samples.
Figure 4 shows an LaFeAsO single crystal [sample 3 in Fig. 3(a,c)] mounted for Buerger precession measurements (a) and with contacts for electrical resistivity (b). The Buerger precession image reveals a clean diffraction pattern consistent with good quality single crystals and easily allows for an in-plane orientation [Fig. 4c, depicted is the reciprocal plane]. The electrical resistivity was measured with current flow along the [110] direction [, filled, red squares in Fig. 4(d)] and along the [100] direction [, open, black circles in Fig. 4(d)]. The silver-paint contacts have been dissolved in acetone after the first measurement and new contacts were prepared for the second orientation. Above K the electrical resistivities normalized to RT are almost identical for both orientations. A clear difference develops in the vicinity of T, T0 with a sharper maximum in . At lower temperatures the difference diminishes and the curves cross.
The inset in Fig. 4d shows the temperature-dependence of the in-plane anisotropy defined by the ratio / for two measurements of (the second measurement of revealed an identical resistivity within the experimental resolution). Even though the two measurements of are very similar, the calculation of the ratio / revealed differences. The maximum in-plane anisotropy was found at K and K for run 1 and run 2, respectively, which is in the vicinity of the structural and magnetic phase transitions.
The onset of the in-plane anisotropy takes place at K, which is 15 K above K where no indications for an orthorhombic distortion are observable in x-ray diffraction pattern [Fig. 2(c)]. Furthermore it is 20 K above the sharp onset of the peak in the derivative of the electrical resistivity [see Fig. 3(c) sample 3 and 4] and significantly above the ordering temperature of the (static) structural distortion at T0 = 147 K. A different -axis contribution in each direction as the origin of the in-plane anisotropy can not account for the observed behavior since there is no corresponding anomaly in at K [Fig. 3(b)]. Furthermore, is increasing under cooling below RT whereas is decreasing for all measured samples. Therefore, a different contribution in and of sample 3 would become apparent already between and 300 K which is in strong contrast to the almost identical resistivity values observed in this temperature range and the sharp onset of the in-plane anisotropy below K.
IV.3 Magneto-resistance
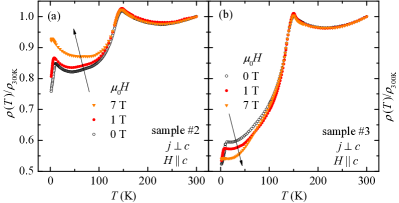
Although the resistivities of samples 2 and 3 in Fig. 3(a) behave similar in zero magnetic field, they have opposing response to an applied magnetic field. Measurements on both samples were performed with the external magnetic field applied along the crystallographic -direction. As shown in Fig. 5a,b the magneto-resistance of sample 2 at low is positive whereas sample 3 exhibits a negative magneto-resistance. of sample 2 is increasing under cooling below K where the minimum shifts to higher with applied external field. Sample 3 shows a metallic resistivity and accordingly a positive magneto-resistance is expected which is in contrast to the observed behavior. Furthermore, the curves measured in T and T cross at K indicating two competing effects on .
In both samples the magneto-resistance increases with decreasing temperature for T, T0 and is very small for T0. This indicates that both the positive and the negative magneto-resistance are correlated with the Fe-AFM ordering and the structural distortion. However, we were not able to identify the origin of the opposing response to a magnetic field and a further discussion of this effect is beyond the scope of this publication. Note, the magnetoresistance of sample 4 was found to be small but positive (not shown). A metallic ground state is therefore not necessarily connected with a negative magnetoresistance.
The magnetic field dependence of (change of AFM structure of Fe) is almost identical for both samples and manifests a shift of the transition to lower temperatures with increasing field.
V Magnetization
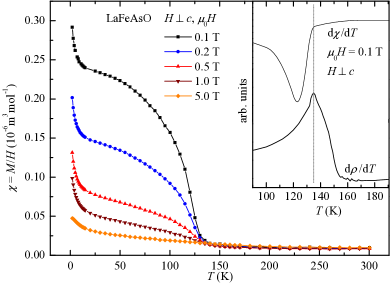
Figure 6 shows the magnetic susceptibility, , of LaFeAsO (sample 4) for magnetic fields of T and . The small field dependence of for K proves the absence of FM foreign phases with an ordering temperature above RT and the values of m3mol-1 at K are in good agreement with previous results of m3mol-1 obtained on single crystals by Yan et al. Yan et al. (2009b).
The strong increase in together with the development of a pronounced field dependence below K manifests what could be interpreted as FM ordering. However, a canting of the Fe-moments in the AFM ordered phase results in similar behavior. The size of the ordered/canted moment was calculated to be /f.u. (f.u. - formula unit LaFeAsO). Similar observations have been made in polycrystalline LaFeAsO0.85F0.1 that was assumed to contain a fraction of undoped or weakly doped LaFeAsO and manifested an ordered moment of /f.u. Fedorchenko et al. (2010).
A comparison of the derivatives d/d and d/d reveals a sudden increase of the magnetization during cooling exactly at the position of the maximum in d/d, i.e., only after the formation of static Fe-AFM ordering at T = 135 K but not already in the nematic phase (inset in Fig. 6).
The strong increase in below K is in good agreement with the proposed change of the magnetic structure of Fe at K where the FM arrangement along the -axis leads to an increase of the magnetization perpendicular to the -axis (the Fe-moments lie in the basal plane de la Cruz et al. (2008)). In contrast to the suppression of for (inferred from , see Fig. 5) remains almost constant for and T and is somewhat shifted to higher temperatures as well as broadened for T. Therefore, the anisotropy of the field dependence of is also in accordance with the proposed magnetic transition since favors the FM arrangement along whereas suppresses the rearrangement.
VI Discussion
VI.1 Sample dependence of the electric resistivity
The origin for the pronounced sample dependent electrical resistivity of LaFeAsO has not been clarified so far. Largely varying results were presented for polycrystalline and single crystalline LaFeAsO samples which were synthesized by different crystal growth procedures. Some of them show a more metallic Shekhar et al. (2009); Yan et al. (2009a), others a more semi-conducting behavior Kamihara et al. (2008); McGuire et al. (2008); Yan et al. (2009a). Our LaFeAsO single crystals were grown under (almost) identical conditions and cover the whole range from semi-conducting to metallic behavior in a continuous fashion [Fig 3(a)]. Details of the crystal growth procedure such as temperature profiles, quality of the starting materials, or crucibles are therefore not responsible for the observed sample dependencies. In the following, we discuss three possible scenarios for the origin of the observed behavior.
VI.1.1 c-axis contribution
A parasitic -axis contribution to the measured in-plane resistivity would explain the sample dependence above T, T0 where () increases (decreases) with decreasing temperature. Depending on the ratio of and a local minimum forms between and 250 K. The resistivity at lower temperatures around T, T0 is strongly affected by the in-plane orientation of the current flow as shown for sample 3. Note that the difference of the resistivities of sample 3 and 4 in Fig. 3(a) look somewhat similar to the difference of the resistivities for current flow along [1 0 0] and [1 1 0] of sample 3 in Fig 4(b). However, a closer inspection reveals a smooth and continuous increase of / setting in at K in contrast to the sharp onset of the in-plane anisotropy at K. The strong increase in at low temperature observed for sample 1 that exceeds the RT value under cooling can not be described by a -axis contribution since at low temperatures stays well below the RT values. Furthermore, of both samples 5 and 6 is decreasing under cooling between and 100 K whereas of sample 1 is increasing monotonically in this temperature range.
Therefore, a clear explanation for the overall temperature dependence of the electrical resistivity based on varying -axis contributions or an in-plane anisotropy could not be found. There are at least two significant contributions to the electrical resistivity, one metallic and one semi-conducting. The anomalies in at T, T0 seem to be superimposed to a sample dependent ’background’ and are more or less independent of above and below the transition temperatures of T = 135 K and T0 = 147 K.
VI.1.2 Metal-insulator transition
The increase in under cooling that was found for some samples of LaFeAsO in this as well as in other investigations is somewhat reminiscent of the cuprate parent compounds which are Mott-Hubbard insulators. Indeed, there is further theoretical evidence for an important role of electronic correlations and the possibility for the vicinity of a metal insulator transition in the iron pnictides, see e.g., Ref. Si and Abrahams, 2008; Abrahams and Si, 2011. The closeness to such an instability would naturally explain the strong sample dependence found for LaFeAsO with some samples being on the metallic side and others on the insulating side. On the other hand, there are other possible contributions to the electrical resistivity, e.g., scattering on magnetic impurities, domain boundaries (of magnetic domains formed in the orthorhombic AFM state), or magnetic fluctuations.
VI.1.3 Structural instability
Another completely different approach to describe the pronounced sample dependence is the assumption of a structural instability. With La being the largest rare earth metal, LaFeAsO might be on the stability limit of the ZrCuSiAs structure type. On the basis of structural data obtained for a whole series of FeAsO ( = La, Ce, Pd, Nd, Sm, Gd, Tb) Nitsche et al. (2010), the effective radius of lanthanum (corresponding to the La-As distance) is over-proportionally large compared to the rest of the rare earth metals. With the height of the lanthanum atom over the oxygen layer being even smaller than expected from the linear trend (Fig. 10 in Ref. Nitsche et al., 2010), a preference of lanthanum towards oxygen and a corresponding weakening of the bonding between the LaO and FeAs layers can be postulated. This is supported by the significantly higher /-ratio and the highest anisotropy of the crystal growth (basal plane vs. stacking direction) when compared to other FeAsO compounds. A resulting structural disorder on a microscopic scale may lead to the sample dependence of the physical properties. However, the experimental verification of this hypothesis is difficult since there is no trivalent ion significantly larger than La (but radioactive actinium).
Altogether, despite the cause of the sample dependence the signatures at T, T0, and are similar for both the metallic and the semi-conducting samples indicating that the Fe-magnetism is not related to the sample dependent electrical transport behavior (Fig. 3a).
VI.2 Anisotropy of the electrical resistivity
The anisotropy of the electrical resistivity between current flow along the crystallographic -axis and the basal plane can be roughly estimated to lie between (at RT). This is significantly larger than the values of found in Fe2As2 compounds Tanatar et al. (2009) ( = Ca, Sr, Ba) and reflects the larger structural anisotropy, i.e., the stronger 2-dimensional character of the FeAsO compounds. We define the ratio of the Fe-plane distance to the distance of nearest neighbor Fe atoms in the Fe-plane to compare the different crystal structures. This effective / ratio amounts to for LaFeAsO whereas smaller values of are obtained for the Fe2As2 compounds with = Ca Ni et al. (2008), = Sr Krellner et al. (2008), and = Ba Rotter et al. (2008), respectively. Despite the large uncertainties of , there is a clear trend seen as an increase of the resistivity anisotropy with increasing effective / ratio : for Ca, to for Sr, Ba Tanatar et al. (2009), to for LaFeAsO (at RT). Exfoliation is a possible origin for a high anisotropy, as pointed out by Tanatar et al. Tanatar et al. (2009). This is unlikely in the present study because of the small thickness of the LaFeAsO mesas (0.24 m and 0.29 m).
VI.3 Electronic nematicity
A detwinning of single crystals is necessary to determine the difference between electrical resistivity along the orthorhombic - and -axis and several measurements have been performed on doped and un-doped Fe2As2 compounds. However, we are not aware of any data obtained on twinned samples with current flow along two different in-plane directions and the influence of a spontaneous, unequal domain distribution on the electrical transport has not been settled so far. Furthermore, disentangling the - and - axis contributions is not essential for the discussion of whether an electron nematic phase may exist in the FeAsO compounds or not. Our finding of a clear in-plane anisotropy well above T, T0 in twinned LaFeAsO single crystals gives strong evidence for the existence of an electron nematic phase (shaded area in the inset of Fig. 4. The sharp onset of the anomaly at K does not mean that nematic fluctuations are absent above this temperature. In a simplified picture, it rather shows that the nematic fluctuation rate (which decreases with decreasing temperature approaching static ordering) and the spin-fluctuation scattering rate (which increases with decreasing temperature approaching the ordering temperature) are becoming comparable at this temperature, i.e., the relaxation time associated with scattering from spin fluctuations becomes smaller than the typical timescale of nematic fluctuations. This picture necessitates the assumption that spin-fluctuation scattering is relevant for the electrical transport which holds true for the presence of significant impurity scattering Fernandes et al. (2011).
VII Summary
We found a pronounced sample dependence of the electrical transport of LaFeAsO single crystals which is not reflected in their structural properties and can not be clearly ascribed to varying contributions of and . The Fe-magnetism is essentially unaffected from these variations of the electrical resistivity that range from semi-conducting to metallic behavior at low temperatures.
A pronounced in-plane anisotropy of the electrical resistivity develops under cooling below K and shows a maximum at K. The large temperature difference of K between structural distortion and emergence of in-plane anisotropy gives strong evidence for a symmetry breaking of the electronic system when compared to the underlying crystallographic symmetry, i.e., an electron nematic phase.
Magnetic susceptibility and electrical resistivity give evidence for a change of the magnetic structure of Fe from an AFM to a FM arrangement along the crystallographic -axis at K. This adds further evidence for a frustrated character of the magnetic exchange in FeAsO compounds along the -axis.
VIII Acknowledgments
C. Steiner, S. K. Kim, M. A. Tanatar, and R. M. Fernandes are acknowledged for fruitful discussions. P. C. Canfield was happy to read and comment on the manuscript. The authors thank P. Scheppan and U. Burkhardt for chemical analysis of the samples and T. Meusel for his help in performing the Buerger precession measurements. Part of A.J.’s work was supported by the U.S. Department of Energy, Office of Basic Energy Science, Division of Materials Sciences and Engineering with research being performed at the Ames Laboratory. Ames Laboratory is operated for the U.S. Department of Energy by Iowa State University under Contract No. DE-AC02-07CH11358.
References
- Kamihara et al. (2008) Y. Kamihara, T. Watanabe, M. Hirano, and H. Hosono, J. Am. Chem. Soc. 130, 3296 (2008).
- Johston (2010) D. C. Johston, Adv. Phys. 59, 803 (2010).
- Stewart (2011) G. R. Stewart, Rev. Mod. Phys. 83, 1589 (2011).
- Fang et al. (2008) C. Fang, H. Yao, W.-F. Tsai, J. P. Hu, and S. A. Kivelson, Phys. Rev. B 77, 224509 (2008).
- Tanatar et al. (2010) M. A. Tanatar, E. C. Blomberg, A. Kreyssig, M. G. Kim, N. Ni, A. Thaler, S. L. Bud’ko, P. C. Canfield, A. I. Goldman, I. I. Mazin, and R. Prozorov, Phys. Rev. B 81, 184508 (2010).
- Chu et al. (2010) J.-H. Chu, J. G. Analytis, K. De Greve, P. L. McMahon, Z. Islam, Y. Yamamoto, and I. R. Fisher, Science 329, 824 (2010).
- Blomberg et al. (2011) E. C. Blomberg, M. A. Tanatar, A. Kreyssig, N. Ni, A. Thaler, R. Hu, S. L. Bud’ko, P. C. Canfield, A. I. Goldman, and R. Prozorov, Phys. Rev. B 83, 134505 (2011).
- Fisher et al. (2011) I. R. Fisher, L. Degiorgi, and Z. X. Shen, Reports on Progress in Physics 74, 124506 (2011).
- Blomberg et al. (2012) E. C. Blomberg, A. Kreyssig, M. A. Tanatar, R. M. Fernandes, M. G. Kim, A. Thaler, J. Schmalian, S. L. Bud’ko, P. C. Canfield, A. I. Goldman, and R. Prozorov, Phys. Rev. B 85, 144509 (2012).
- Fernandes et al. (2011) R. M. Fernandes, E. Abrahams, and J. Schmalian, Phys. Rev. Lett. 107, 217002 (2011).
- Lester et al. (2010) C. Lester, J.-H. Chu, J. G. Analytis, T. G. Perring, I. R. Fisher, and S. M. Hayden, Phys. Rev. B 81, 064505 (2010).
- Fernandes et al. (2010) R. M. Fernandes, L. H. VanBebber, S. Bhattacharya, P. Chandra, V. Keppens, D. Mandrus, M. A. McGuire, B. C. Sales, A. S. Sefat, and J. Schmalian, Phys. Rev. Lett. 105, 157003 (2010).
- Nakajima et al. (2011) M. Nakajima, T. Liang, S. Ishida, Y. Tomioka, K. Kihou, C. H. Lee, A. Iyo, H. Eisaki, T. Kakeshita, T. Ito, and S. Uchida, Proc. Natl. Acad. Sci. U.S.A. 108, 12238 (2011).
- Dusza et al. (2012) A. Dusza, A. Lucarelli, A. Sanna, S. Massidda, J.-H. Chu, I. R. Fisher, and L. Degiorgi, New J. Phys. 14, 023020 (2012).
- (15) Q. Wang, Z. Sun, E. Rotenberg, F. Ronning, E. D. Bauer, H. Lin, R. S. Markiewicz, M. Lindroos, B. Barbiellini, A. Bansil, and D. S. Dessau, ArXiv:1009.0271.
- Yi et al. (2011) M. Yi, D. Lu, J.-H. Chu, J. G. Analytis, A. P. Sorini, A. F. Kemper, B. Moritz, S.-K. Mo, R. G. Moore, M. Hashimoto, W.-S. Lee, Z. Hussain, T. P. Devereaux, I. R. Fisher, and Z.-X. Shen, Proc. Natl. Acad. Sci. U.S.A. 108, 6878 (2011).
- Kasahara et al. (2012) S. Kasahara, H. J. Shi, K. Hashimoto, S. Tonegawa, Y. Mizukami, T. Shibauchi, K. Sugimoto, T. Fukuda, T. Terashima, A. H. Nevidomskyy, and Y. Matsuda, NATURE 486, 382 (2012).
- Karpinski et al. (2009) J. Karpinski, N. Zhigadlo, S. Katrych, Z. Bukowski, P. Moll, S. Weyeneth, H. Keller, R. Puzniak, M. Tortello, D. Daghero, R. Gonnelli, I. Maggio-Aprile, Y. Fasano, O. Fischer, K. Rogacki, and B. Batlogg, Physica C: Superconductivity 469, 370 (2009).
- Yan et al. (2011) J.-Q. Yan, B. Jensen, K. W. Dennis, R. W. McCallum, and T. A. Lograsso, Appl. Phys. Lett. 98, 072504 (2011).
- McGuire et al. (2008) M. A. McGuire, A. D. Christianson, A. S. Sefat, B. C. Sales, M. D. Lumsden, R. Jin, E. A. Payzant, D. Mandrus, Y. Luan, V. Keppens, V. Varadarajan, J. W. Brill, R. P. Hermann, M. T. Sougrati, F. Grandjean, and G. J. Long, Phys. Rev. B 78, 094517 (2008).
- Qureshi et al. (2010) N. Qureshi, Y. Drees, J. Werner, S. Wurmehl, C. Hess, R. Klingeler, B. Büchner, M. T. Fernández-Díaz, and M. Braden, Phys. Rev. B 82, 184521 (2010).
- Shekhar et al. (2009) C. Shekhar, S. Singh, P. K. Siwach, H. K. Singh, and O. N. Srivastava, Supercond. Sci. Technol. 22, 015005 (2009).
- Yan et al. (2009a) J. Q. Yan, S. Nandi, J. L. Zarestky, W. Tian, A. Kreyssig, B. Jensen, A. Kracher, K. W. Dennis, R. J. McQueeney, A. I. Goldman, R. W. McCallum, and T. A. Lograsso, (2009a), arXiv.:0909.3510.
- Nitsche et al. (2010) F. Nitsche, A. Jesche, E. Hieckmann, T. Doert, and M. Ruck, Phys. Rev. B 82, 134514 (2010).
- (25) A. C. Larson and R. B. Von Dreele, ”General Structure Analysis System (GSAS)”, Los Alamos National Laboratory Report LAUR 86-748 (2000).
- Toby (2001) B. H. Toby, J. Appl. Crystallogr. 34, 210 (2001).
- (27) S. Probst, C-axis current injection into layered materials, Master Thesis, Universität Erlangen-Nürnberg (2011).
- Quebe et al. (2000) P. Quebe, L. J. Terb chte, and W. Jeitschko, J. Alloys Compd. 302, 70 (2000).
- Nomura et al. (2008) T. Nomura, S. W. Kim, Y. Kamihara, M. Hirano, P. V. Sushko, K. Kato, M. Takata, A. L. Shluger, and H. Hosono, Supercond. Sci. Technol. 21, 125028 (2008).
- Wang et al. (2009) C. Wang, S. Jiang, Q. Tao, Z. Ren, Y. Li, L. Li, C. Feng, J. Dai, G. Cao, and Zhu-anXu, Europhys. Lett. 86, 47002 (2009).
- Cao et al. (2009) G. Cao, S. Jiang, X. Lin, C. Wang, Y. Li, Z. Ren, Q. Tao, C. Feng, J. Dai, Z. Xu, and F.-C. Zhang, Phys. Rev. B 79, 174505 (2009).
- Qi et al. (2009) Y. Qi, L. Wang, Z. Gao, D. Wang, X. Zhang, Z. Zhang, and Y. Ma, Phys. Rev. B 80, 054502 (2009).
- Yan et al. (2009b) J.-Q. Yan, S. Nandi, J. L. Zarestky, W. Tian, A. Kreyssig, B. Jensen, A. Kracher, K. W. Dennis, R. J. McQueeney, A. I. Goldman, R. W. McCallum, and T. A. Lograsso, Appl. Phys. Lett. 95, 222504 (2009b).
- de la Cruz et al. (2008) C. de la Cruz, Q. Huang, J. W. Lynn, J. Li, W. R. II, J. L. Zarestky, H. A. Mook, G. F. Chen, J. L. Luo, N. L. Wang, and P. Dai, Nature 453, 899 (2008).
- Luo et al. (2009) Y. Luo, Q. Tao, Y. Li, X. Lin, L. Li, G. Cao, Z.-a. Xu, Y. Xue, H. Kaneko, A. V. Savinkov, H. Suzuki, C. Fang, and J. Hu, Phys. Rev. B 80, 224511 (2009).
- Krellner et al. (2008) C. Krellner, N. Caroca-Canales, A. Jesche, H. Rosner, A. Ormeci, and C. Geibel, Phys. Rev. B 78, 100504 (2008).
- Jesche et al. (2010) A. Jesche, C. Krellner, M. de Souza, M. Lang, and C. Geibel, Phys. Rev. B 81, 134525 (2010).
- Tian et al. (2010) W. Tian, W. Ratcliff, M. G. Kim, J.-Q. Yan, P. A. Kienzle, Q. Huang, B. Jensen, K. W. Dennis, R. W. McCallum, T. A. Lograsso, R. J. McQueeney, A. I. Goldman, J. W. Lynn, and A. Kreyssig, Phys. Rev. B 82, 060514 (2010).
- Zhao et al. (2008) J. Zhao, Q. Huang, C. de la Cruz, S. Li, J. W. Lynn, Y. Chen, M. A. Green, G. F. Chen, G. Li, Z. Li, J. L. Luo, N. L. Wang, and P. Dai, Nat Mater 7, 953 (2008).
- Kimber et al. (2008) S. A. J. Kimber, D. N. Argyriou, F. Yokaichiya, K. Habicht, S. Gerischer, T. Hansen, T. Chatterji, R. Klingeler, C. Hess, G. Behr, A. Kondrat, and B. Büchner, Phys. Rev. B 78, 140503 (2008).
- Fedorchenko et al. (2010) A. V. Fedorchenko, G. E. Grechnev, V. A. Desnenko, A. S. Panfilov, O. S. Volkova, and A. N. Vasiliev, Low Temp. Phys. 36, 230 (2010).
- Si and Abrahams (2008) Q. Si and E. Abrahams, Phys. Rev. Lett. 101, 076401 (2008).
- Abrahams and Si (2011) E. Abrahams and Q. Si, J. Phys. Condens. Matter 23, 223201 (2011).
- Tanatar et al. (2009) M. A. Tanatar, N. Ni, G. D. Samolyuk, S. L. Bud’ko, P. C. Canfield, and R. Prozorov, Phys. Rev. B 79, 134528 (2009).
- Ni et al. (2008) N. Ni, S. Nandi, A. Kreyssig, A. I. Goldman, E. D. Mun, S. L. Bud’ko, and P. C. Canfield, Phys. Rev. B 78, 014523 (2008).
- Rotter et al. (2008) M. Rotter, M. Tegel, D. Johrendt, I. Schellenberg, W. Hermes, and R. Pöttgen, Phys. Rev. B 78, 020503 (2008).