Effects of coupling between octahedral tilting and polar modes on the phase diagram of PbZr1-xTixO3
Abstract
The results are presented of anelastic and dielectric spectroscopy measurements on large grain ceramic PbZr1-xTixO3 (PZT) with compositions near the two morphotropic phase boundaries (MPBs) that the ferroelectric (FE) rhombohedral phase has with the Zr-rich antiferroelectric and Ti-rich FE tetragonal phases. These results are discussed together with similar data from previous series of samples, and reveal new features of the phase diagram of PZT, mainly connected with octahedral tilting and its coupling with the polar modes. Additional evidence is provided of what we interpret as the onset of the tilt instability, when is initially frustrated by lattice disorder, and the long range order is achieved at lower temperature. Its temperature prosecutes the long range tilt instability line up to , when drops. It is proposed that the difficulty of seeing the expected modulations in diffraction experiments is due to the large correlation volume associated with that type of tilt fluctuations combined with strong lattice disorder.
It is shown that the lines of the tilt instabilities tend to be attracted and merge with those of polar instabilities. Not only bends toward and then merges with it, but in our series of samples the temperature of the dielectric and anelastic maxima at the rhombohedral/tetragonal MPB does not cross , but deviates remaining parallel or possibly merging with . These features, together with a similar one in BaxTiO3, are discussed in terms of cooperative coupling between tilt and FE instabilities, which may trigger a common phase transition. An analogy is found with recent simulations of the tilt and FE transitions in multiferroic BiFeO3 [Kornev and Bellaiche, Phys. Rev. B 79, 100105 (2009)].
An abrupt change is found in the shape of the anelastic anomaly at when passes from to 0.48, possibly indicative of a rhombohedral/monoclinic boundary.
pacs:
77.80.B-, 77.84.Cg, 77.22.Ch, 62.40.+iI Introduction
The phase diagram of the most widely used ferroelectric perovskite PbZr1-xTixO3 (PZT) still has unclear features (for the phase diagram, see Fig. 7). It has been known since the fiftiesSaw53 ; Jaf62 ; JCJ71 and the major recent discovery was the existence of a monoclinic (M) phaseNCS99 in a narrow region at the morphotropic phase boundary (MPB) that separates the ferroelectric (FE) Zr-rich rhombohedral (R) region from the Ti-rich tetragonal (T) one. In the M phase the polarization may in principle continuously rotate between the directions in the T and R domains, so providing an additional justification for the well known and exploited maximum of the electromechanical coupling at the MPB. The existence of domains of M phase is actually still debated, the alternative being nanotwinned R and/or T domains that over a mesoscopic scale appear as M.Kha10 ; SSK07b Since experimental evidences for both types of structures exist, the possibility should be considered that genuine M domains and nanotwinning coexist at the MPB, being both manifestations of a free energy that becomes almost isotropic with respect to the polarization.145 The part of the MPB line below room temperature has been investigated only after the discovery of the M phase, and is reported to go almost straight to 0 K at .NCS00 ; SLA02
Recent studies are also revealing new features of how the TiO6 and ZrO6 octahedra tilt at low temperature. The instability of the octahedral network toward tilting is a common phenomenon in perovskites ABO3, usually well accounted for by the mismatch between the network of B-O bonds with that of A-O bonds which are softer and with larger thermal expansion.Bro92 ; BDM97 In these cases, lowering temperature or increasing the average B size sets the stiff B-O network in compression, which is relieved by octahedral tilting.Meg46 ; Woo97b ; RCS94 ; WKR05 In the case of PZT, Zr has a radius 19% smaller than Ti and one expects the tilt instability to occur below a line that encloses the low- and low- corner of the phase diagram. Indeed, the Zr-rich antiferroelectric compositions are tilted ( in Glazer’s notation,Gla72 meaning rotations of the same angle about two pseudocubic axes in anti-phase along each of them and no rotation around the third axis), below a line that goes steeply toward 0 K at . Also at higher Ti compositions tilting is observed ( compatible with the rhombohedral structure) below a line that presents a maximum at and whose prosecution to low temperature was not followed beyond until recently. The prediction from first principles calculations that octahedral tilting occurs also in the M and T phaseKBJ06 has been confirmed by anelastic and dielectric,127 structural,HSK10 RamanDFT11 and infra-redBNP11 experiments. The presence of a low-temperature monoclinic phase RSR05 with tilt pattern intermediate between tilted R and T has been excluded by a recent neutron diffraction experiment on single crystals,PLX10 where below coexistence was found of tilted and untilted phases. Yet, evidence for the phase has been subsequently reported on PZT where 6% Pb was substituted with smaller Sr, in order to enhance tilting.SKM11
Here we report the results of anelastic and dielectric experiments at additional compositions with respect to our previous investigations, which reveal new features of the phase diagram of PZT, mainly related to octahedral tilting and its coupling with the polar degrees of freedom.
II Experimental
Large grain (average sizes m) ceramic samples of PbZr1-xTixO3, with nominal compositions , 0.062, 0.08, 0.12, 0.40, 0.487, 0.494 have been prepared with the mixed-oxide method in the same manner as previous series of samples.127 ; 145 The starting oxide powders were calcined at 800 ∘C for 4 hours, pressed into bars and sintered at 1250 ∘C for 2 h, packed with PbZrO3 + 5wt% excess ZrO2 to prevent PbO loss during sintering. The powder X-ray diffraction did not reveal any trace of impurity phases and the densities were about 95% of the theoretical ones. The sintered blocks were cut into thin bars cm long and mm thick for the anelastic and dielectric experiments and discs with a diameter of 13 mm and a thickness of 0.7 mm were also sintered only for the dielectric measurements. The faces were made conducting with Ag paste.
The dielectric susceptibility was measured with a HP 4194 A impedance bridge with a four wire probe and an excitation of 0.5 V/mm, between 0.1 and 100 kHz. The heating and cooling runs were made at K/min between 100 and 800 K in a modified Linkam HFS600E-PB4 stage and up to 540 K in a Delta climatic chamber.
The dynamic Young’s modulus was measured between 100 and 770 K in vacuum by electrostatically exciting the flexural modes of the bars suspended on thin thermocouple wires.135 The reciprocal of the Young’s modulus, the compliance , is the mechanical analogue of the dielectric susceptibility. During a same run the first three odd flexural vibrations could be excited, whose frequencies are in the ratios . The angular frequency of the fundamental resonance isNB72 , and the temperature variation of the real part of the compliance is given by , where is chosen so that represents the compliance in the paraelectric phase. The imaginary parts of the susceptibilities contribute to the losses, which are presented as for the mechanical case and for the dielectric one.
III Results
For clarity, we will consider separately the anelastic and dielectric spectra with compositions in the range , and those in the MPB region. We will present the new data together with those already published in Ref. 127, (, 0.465, 0.48, and 0.53) and Ref. 145, (, 0.14, 0.17, 0.42, 0.45, 0.452).
III.1 Octahedral tilting below and :
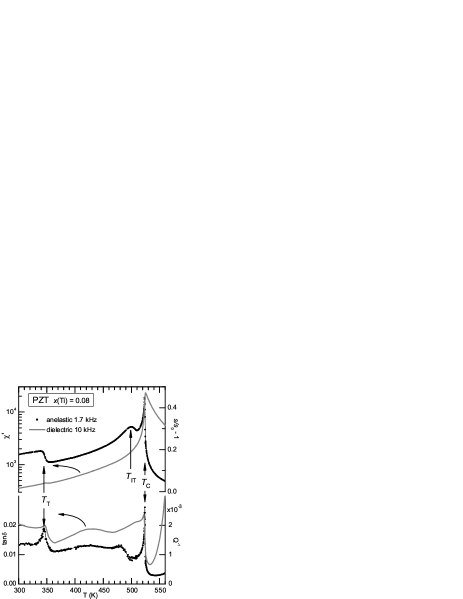
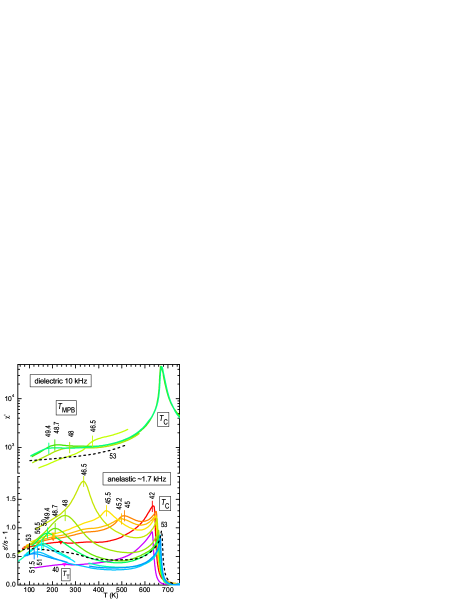
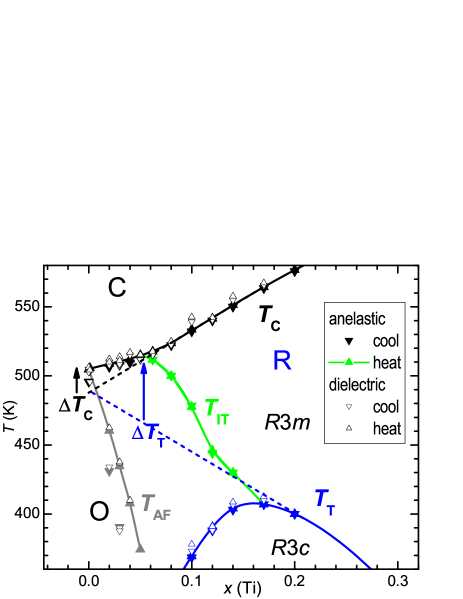
Figure 1 presents the dielectric and anelastic spectra measured during heating of PbZr0.92Ti0.08O3, a composition where also the new transition at is clearly visible in the elastic compliance . The comparison between the two types of susceptibilities puts in evidence their complementarity in studying combinations of polar and non polar modes. The dielectric susceptibility is of course dominated by the FE transition at (note the logarithmic scale), it has a very attenuated step below the well known tilt transition at , and practically nothing visible at , due to both the broader shape of the anomaly and the proximity to the Curie-Weiss peak. The dielectric losses provide an indirect but more clear mark of the non polar transition at , presumably through a change in the mobility and/or amplitude of charge and polar relaxations which are affected by octahedral tilting.
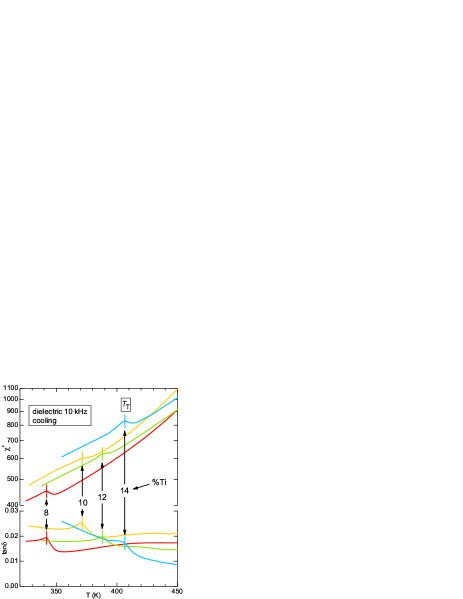
The effect of cooling through on the dielectric susceptibility is more convincingly shown to be a positive step in Fig. 2, and this fact will be discussed as a sign of cooperative coupling between tilt and polar modes.
The elastic compliance , on the other hand, is only indirectly affected by the FE transition, since strain is not an order parameter of the transition and is linearly coupled to the square of the polarization. The Landau theory of phase transitionsReh73 ; CS98 predicts a step in for this type of coupling, which is indeed observed at higher Ti compositions,127 but has a strong peaked component in Zr-rich PZT. We do not have an obvious explanation for this peaked response, which is frequency independent and intrinsic, but mechanisms involving dynamical fluctuations of the order parameter coupled with strain are possible.CS98 The advantage of a reduced anelastic response to the FE instabilities is that the other transitions are not as masked as in the dielectric case, so that not only is the tilt transition at clearly visible as a step in and peak in , but also the new transition can be detected at even very close to . As already discussed,145 this transition has all the features of the transition at but the associated anomaly is attenuated and broadened, so providing further support to an explanation in terms of a disordered precursor to the final long range tilt ordering below .
The broad peaks and steps in both the dielectric and anelastic losses below have scarce reproducibility, which indicates their extrinsic origin, namely the motion of domain walls and charged defects, whose state depends on the thermal history. Instead, all the features indicated by arrows are completely independent of the measuring frequency, temperature rate and thermal history, and therefore are recognizable as intrinsic effects due to the FE and tilt transitions. Hysteresis between heating and cooling is observed due to the first order character of the transitions and to the presence of domain walls relaxations. Examples of the differences between the features that are intrinsic and stable and those that present dispersion in frequency or are less reproducible have been reported previously127 ; 145 and are omitted here.
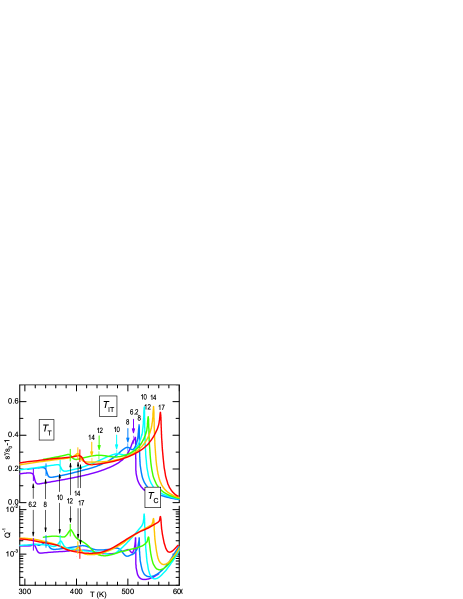
Figure 3 presents the anelastic spectra of PZT with , including compositions already present in Ref. 145, . All the curves are similar to the case of Fig. 1, with the three type of transitions at , and clearly visible in separate temperature ranges. Both the and curves have sharp peaks at the FE transitions, so that the ’s are simply labeled with the compositions in %Ti. The other transition temperatures are indicated by vertical bars centered on the curves and arrows labeled with the respective compositions. The features of in the temperature range are not labeled because are due to the extrinsic contributions mentioned above.
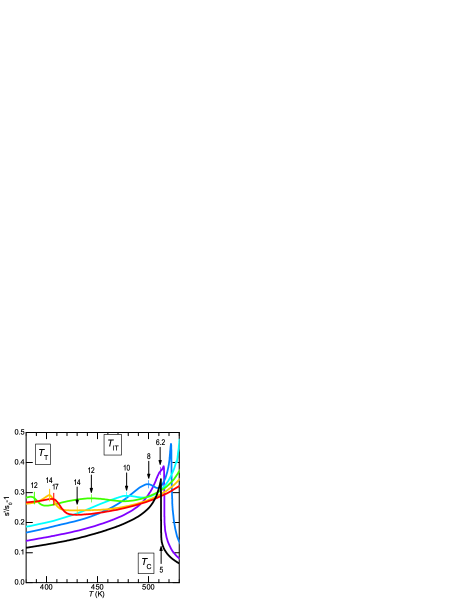
The temperatures of the tilt transition are identified with the upper edges of the steps in the real parts, which generally coincide with a spike or sharp kink in the losses. The rounded step and lack of reproducible anomaly in the losses increase the error on , which however remains small enough to not change the features of the phase diagram discussed later. Due to the importance of the behavior of in the Discussion, a detail of this anomaly in the curves, including 5% Ti, is shown in Fig 4. An anomaly corresponding to might be present slightly above for , but lacking a clear sign of it, it is assumed to coincide with . At low , the curve of does not present any clear shoulder below , and it is assumed .
The transition temperatures measured on both heating and cooling are reported in the phase diagram of Fig. 7, where the line departs from at , has a kink centered at and finally joins the line at . The new feature that will be the main focus of the present work is the kink and the merging with at . It is also noticeable that the anomaly at becomes more intense and sharper on approaching .
III.2 Compositions near the MPB
As discussed in the previous investigations,127 ; 145 the MPB in PZT is signaled by a maximum in the dielectric and above all elastic susceptibilities. Again, it is stressed that such maxima are almost independent of frequency and temperature rate, and therefore are intrinsic effects due to the evolution of the order parameter at the MPB and its coupling with strain. Also the losses are rather high in the region of the MPB, but no feature is found that is directly ascribable to the phase transition; rather, their dependence on frequency and thermal history show that they are due to the abundant twin walls and other domain boundaries, whose density and mobility depend on many factors and is maximal around the MPB. Instead, the losses contain clear cusps or steps at the tilt transitions,127 ; 145 so allowing to be determined also in the proximity with the MPB, where the real part is dominated by the peak at . We therefore discuss separately the real parts of and , containing information on the polar transition at the MPB, and the losses, containing information on the tilt transitions.
III.3 Maxima of the susceptibilities at the MPB
Figure 5 is an overview of and curves measured during cooling at all the compositions we tested so far.
We call the temperatures of the maxima in and , marked with vertical bars on the curves. These temperatures do not coincide exactly with each other, because and are two different response functions of polarization and strain respectively, but, once plotted in the phase diagram, they present an excellent correlation with the MPB determined by diffraction, at least in the middle of the MPB line (see Fig. 7). The dielectric maxima at are much smaller and broader than the Curie-Weiss peak at (note the logarithmic scale), whereas the anelastic maxima at have comparable or even larger intensities than the step at (part of the peaked component at has a frequency dispersion denoting relaxation of walls127 ; 145 ).
At there is no peak attributable to the MPB, but only a minor step below , which is indicated with triangles up to ; beyond that composition, the step at either disappears or is masked by the MPB peak. The other shallow anomaly centered at K in the curves up to is the counterpart of the domain wall relaxation appearing in the losses mentioned above and will be ignored. For the peak at the MPB shifts to lower temperature and develops its maximum amplitude at 0.465, which has been argued to correspond to the point of the phase diagram where the anisotropy of the free energy is minimum.145 The presence of a peak in at the MPB has also been argued to be evidence that the phase transition occurring at the MPB consists mainly in the rotation of the polarization, from the direction of the T phase toward the direction of the R phase. In fact, in that case the transverse (perpendicular to the original direction) component of acts as order parameter and is almost linearly coupled to a shear strain, inducing a peaked response also in the elastic susceptibility.127 ; 145 This would be an evidence that a monoclinic phase, and not only nanotwinned R and T phases, exists below the MPB. Yet, the smooth shape of the maximum is compatible with an inhomogeneous M phase coexisting and possibly promoted by nanotwinning.145 In fact, indications continue to accumulate of intrinsic phase heterogeneity near the MPB compositions also on single crystals.BBF12
Beyond , the peak at gradually decreases its amplitude and temperature, and, thanks to the great number of closely spaced compositions, is clearly recognizable as the signature of the MPB up to . The next composition, (dashed curves), still has a shallow maximum at a temperature that prosecutes the line, but its nature appears different. In fact, the dielectric at the same composition lacks any sign of a maximum, and the overall curve does not any more prosecute the trend of the preceding curves. For this reason, the temperature of this maximum at is reported in the phase diagram as but accompanied by a question mark. A is extracted also from the curve at , even though a separate maximum is not present. It is however the only composition where has no sharp feature at , and we assume that this is due to a rounded peak at very close to .
III.4 Tilt transition near the MPB
The best signatures of the tilt transition below are found in the anelastic losses. Figure 6 shows the curves at all the compositions we tested so far (only 45.2%Ti is omitted in order to not overcrowd the figure).
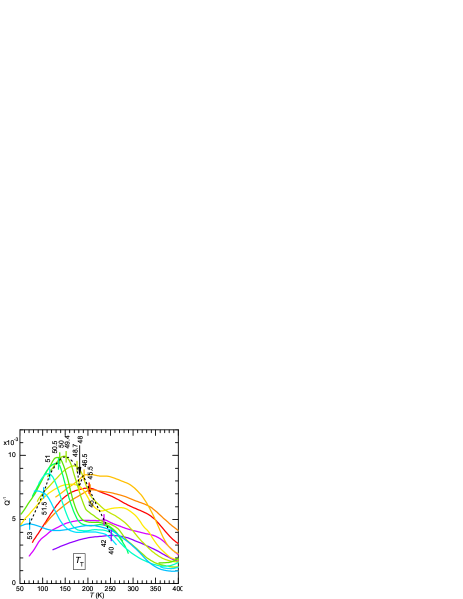
The ’s up to are the same as deduced from the step in the real part and indicated by triangles in Fig. 5. Up to is identified with the temperature of a spike in , which gradually becomes a cusp and starting from becomes a large step. As in the previous figures, the ’s are marked by vertical bars centered on the curves and joined by a dashed line, in order to better follow the evolution of the anomaly. The transition between the spike/cusp and the step anomaly is unexpectedly sudden, since it occurs within . Such a discontinuity appears also in the dashed line joining the anomalies, and is marked by an arrow. We emphasize again that the losses generally have a limited reproducibility, because depend on the status of domain walls and defects; therefore, the regularity of the dashed curve joining the tilt anomalies of so many different samples is remarkable and testifies the good and uniform quality of the samples.
IV Discussion
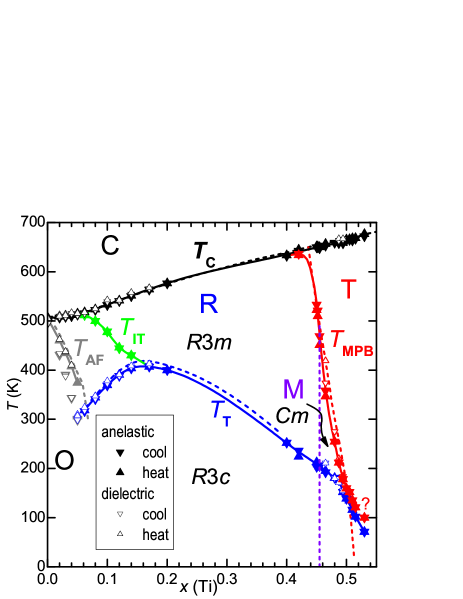
We refer to the phase diagram of PZT in Fig. 7. Below and with decreasing Ti content, one finds the following phases:YZT09 ; ZYG11b ; WKR05 ferroelectric (FE) tetragonal (T) with polarization along , monoclinic (M) with rotated toward , rhombohedral (R) with and antiferroelectric (AFE) orthorhombic (O) with staggered cations shifts along and tilt pattern. Below octahedral tilting occurs in all phases.
In Fig. 7, the solid lines join the transition temperatures deduced from our anelastic spectra measured during heating (filled triangles pointing upward), which are generally very close to the points deduced from the dielectric curves (empty triangles). The temperatures measured during cooling are also shown as triangles pointing downward. The figure contains all the data presented here and in Refs. 127, ; 145, and, for completeness, also points obtained at compositions , that will be discussed in a future paper.
The dashed lines are from the most widely published version of Jaffe, Cook and JaffeJCJ71 with modifications of Noheda et al.NCS00 around the MPB. In a different versionFES86 the line below does not prosecute straight up to join almost perpendicularly, but rapidly decreases its slope and joins at . At present we have indication of a much smaller deviation of from the datum at (Fig. 5), but already at there is no trace of a double transition.
IV.1 The octahedral tilt instability
The tendency of the BO6 octahedra in A2+B4+O3 perovskites to tilt has been widely studied and can be rationalized in terms of mismatch between a softer sublattice of longer A-O bonds that compresses a stiffer sublattice of shorter B-O bonds, until the incompressible octahedra tilt in order to accommodate a reduction of the cell and cuboctahedral volume without reducing their volume . In the majority of cases the A-O bonds are softer than the B-O bonds, because they are longer and the cation A shares its valence with 12 nearest neighbors O atoms while B with only 6 of them.Bro92
This effect is quantitatively expressed in terms of the Goldschmidt tolerance factor
which is 1 for the cubic untilted case. In order to predict a tendency to form a tilted phase, is written in terms of the ideal ionic radii of the appropriate valence and coordination, which are tabulated.Sha76 If then the equilibrium B-O bond lengths are too long to fit in a cubic frame of A-O bonds, and tilting occurs below some threshold value; for example, many Sr/Ba based perovskites are tilted when at room temperature.RCS94 Alternatively, the polyhedral volume ratio is defined,Tho89 which is 5 for the untilted case and becomes upon tilting. Of all the normal modes of a cubic perovskite, those that induce a decrease of are the combinations of rigid rotations of the octahedra about the cubic axes, while all other normal modes involve distortions of the polyhedra with little or no change in their volumes.WA11 Rotations with all the octahedra in phase along the axis are labeled , because the staggered shifts of the O atoms create a modulation with vector , the M point of the Brillouin zone, while rotations with successive octahedra in antiphase along the axis are labeled , because the modulation is , the R point of the Brillouin zone.HS98 These modes are also called antiferrodistortive (AFD), because of the staggered modulation of the atomic displacements, and do not cause the formation of electric dipoles. Most of the low temperature structures of perovskites can be described in terms of combinations of these rotations together with polar modes (shifts of the cations against the O anions). In particular, the low-temperature rhombohedral phase of PZT, is obtained from the high temperature ferroelectric R phase, by applying anti-phase rotations of the same angle about all three pseudocubic axes ( in Glazer’s notationGla72 ), while the O-AFE structure of PbZrO3 is a combination of staggered and hence AFE displacements of the Pb2+ and Zr4+ ions along , with anti-phase tilts along and ().
In spite of the considerable amount of research on the phase diagram of PZT, little use has been done of these concepts in order to interpret it. An indication that the mechanism governing tilting in PZT is indeed the A-O/B-O mismatch is the observation that the substitution of 6% Pb2+ with the smaller Sr2+ induces tilting in an originally untilted T phase of PZT, while when codoping with Sr2+ and Ba2+, the latter larger than Pb2+, the opposite effects of the two dopants on the average tolerance factor cancel with each other and no tilting is found.ZRL02 When the tilt boundary has been discussed in terms of , the incongruence of the deep depression near the border with the O-AFE phase has been pointed out,WKR05 and explained in terms of frustration of AFE displacements of the Pb ions perpendicularly to the average FE direction . Such displacements lack the long range order of the AFE-O structure, and their frustration would be transmitted to the octahedral tilting through the Pb-O bonds, so lowering the border in proximity with the AFE-O phase.WKR05 Certainly the sharp depression in the border to the long range ordering of tilts, the line, appears to be caused by some frustration, since it is a typical feature of the phase diagrams with competing states,BMM01b ; Dag05b and both the FE/AFE polar modes and different tilt patterns may be in competition.
Let us first consider the AFE/FE competition. The disordered displacements of Pb away from the average polarization have been proposed to occur over the whole R region of the phase diagram and particularly near the other MPB with the T phase, based on the large anisotropic displacement ellipsoids of Pb in Rietveld refinements according to the R structureCGW98 or to the coexistence of M and R structures.YZT09 ; PLX10 While in these cases the Pb displacements off-axis with respect to the direction may be imagined as having a FE correlation leading to a rotation of the polarization away from , recently a soft mode corresponding to AFE Pb displacements has been found near the MPB of PZT and in relaxor PMN and PZN-PT, suggesting that the AFE-like instability is a common feature of nanoscale domain structures of rhombohedral or pseudorhombohedral lead-based perovskites.HOK11 Considering that such displacements occur over the whole R region or particularly at the MPBs with the O and the T phases, if they are so strongly coupled with the tilts, one would expect a depression of also near the MPB with the T phase, which is not observed. There are some possible explanations for the different behavior of at the two MPBs. One is that the polar displacements away from might become static and with larger amplitude and AFE correlation only near the AFE border, so causing the frustration between FE and AFE patterns, while at the MPB to the T-FE phase the AFE correlations remain at the stage of an anomalous phonon softening.
On the other hand, it is possible that the main competition occurs between the two different tilt patterns in the R and O phases, since the approaching of the tilt instability to the FE one indicates that in the region of the phase diagram polar and tilt modes have comparable energetics. It is not evident, however, how the competition between and tilt patterns would cause frustration, since they can transform into each other just by switching on and off the anti-phase tilt about the pseudocubic axis . We believe that so strong a depression of the lines is possible because partial tilting has already occurred at .
IV.2 The intermediate tilt instability line
Before discussing the nature of the instability at , we emphasize the reasons why a positive step of the compliance during cooling like that at should indicate a phase transition and not some kinetic effect related to domain walls or defects: i) cooling causes pinning or freezing of domain walls and therefore decreases the susceptibility, while an increase is observed at ; ii) in the absence of tilting, the only conceivable walls just below would be between the R-FE domains; if some anomaly in their behavior occurred around , it would appear also, or mainly, in the dielectric susceptibility; iii) the shape of the anomaly is independent of the temperature rate, history and frequency,145 and therefore is an intrinsic lattice effect.
The line appears as the prosecution of the one toward the lowest , or equivalently lowest , and highest temperature, and hence it has been identified as the onset of precursor tilting.145 Presumably, between and tilting would be disordered due to the enhanced disorder in the O-Pb-O network near the AFE border, as suggested above.WKR05 The drastic depression of would then be due to the fact that most of the mismatch between the Pb-O and (Zr/Ti)-O sublattices is relieved at , and the final transition to a tilted phase with long range order requires the buildup of sufficient elastic energy in the disordered sublattice of tilted octahedra, that it is convenient to switch to the long range ordered phase. This is not alternative to the above discussion on the sharp minimum of in terms of competing phases. It is simply assumed that the frustration hinders tilting from reaching long range order but not from occurring on the local scale.
This interpretation has not yet been corroborated by a structural study where the onset of tilting below is actually observed and the tilt pattern is established. Actually, superlattice spots in electron diffraction have been interpreted in terms of in-phase -type tilts within the otherwise phase up to .Vie95 ; VLD96 That region roughly corresponds to the region delimited by the border, though a border was not seen.Vie95 ; VLD96 These in-phase tilts could not be confirmed by x-ray or neutron diffraction and considerable debate ensued over the interpretation of the electron diffraction spots in terms of AFE Pb displacements rather than -type tilts, due to the much weaker strength of the latter and the greater sensitivity of electron diffraction to the damaged surface.RCW98 ; WKR05
The tilts are in the first place in the search for a mechanism behind the phase transformation at , because they would cause weak superlattice peaks at positions coinciding with those from the disordered AFE Pb displacements, so explaining why their onset below has not yet been noticed. In fact, the disorder in the Pb sublattice, including AFE-like shifts, survives even in the cubic phase, as demonstrated by the observation of electron diffraction spotsVie95 ; VLD96 and the fact that EXAFS probes the same local environment of PbKTK05c and Zr/Ti,RS95 both in the FE and in the cubic phases. It seems reasonable to assume that the AFE cation displacements develop their short range order together with the FE order below , so producing superlattice peaks of the type, that mask those from subsequent octahedral tilting below , if this is of type. The difficulty with the last assumption is that the final tilting below is of type, and the in-phase tilting is an instability of different type rather than a precursor to it.
IV.3 reflections from hindered modulation of the tilts?
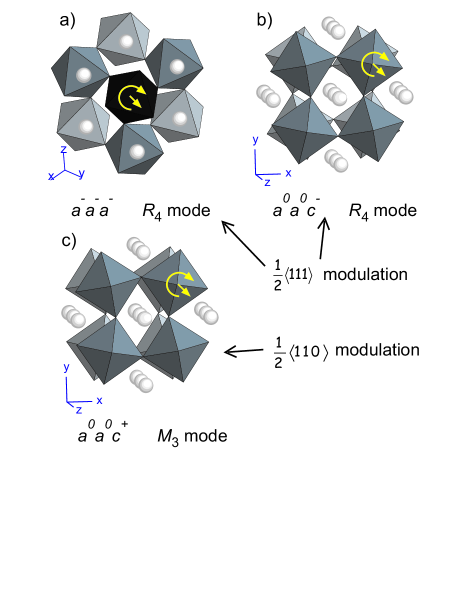
In order to reconcile the observation of -type modulation below with an expected short range -type modulation, we assume that the propagation of tilt fluctuations is hindered by the lattice disorder associated with Ti substituting Zr, with the consequent frustration of the Pb displacements, and possibly other defects. Therefore, rather than to consider fluctuations of infinitely extended normal modes, it is more appropriate to consider the fluctuations of small clusters of octahedra, whose size is limited by the local disorder. This makes the different types of tilting represented in Fig. 8 inequivalent, since they have different correlation volumes. In a first approximation consider a network of rigid octahedra, that, in order to comply with the mismatch with the Pb-O network, can only tilt without distortions. This is the so-called rigid unit model, whose implications on the anisotropy of the phonon dispersions has been analyzed.SHD94 Here we focus on the effects that the anisotropy of the correlation length might have on the diffraction patterns.
Consider first the rotation of a single octahedron about one of the cubic axes ( in Fig. 8b) or c)); this will cause a rotation of all the other octahedra in the same plane perpendicular to the axis in an AFD fashion, creating a modulation, with a correlation length , perpendicular to the rotation axis, which is an increasing function of the B-O bond strength. In the pure rigid unit model is infinite and there is no correlation at all with the other planes of octahedra, because they share corners of the tilting octahedra only through immobile O atoms. In practice there is an interaction with the adjacent planes through the less energetic B-O-B bond bending and the extensions of the longer and weaker A-O bonds, resulting in a finite correlation length along the rotation axis, however shorter than . This means that the correlation volume surrounding an octahedron tilting about a direction is a flat disc of diameter and thickness with , and this will create superlattice reflections more intense and sharp at than at . On the other hand, the rotation of an octahedron about a axis (Fig. 8a)), as the soft mode in the structure, will affect all the surrounding octahedra, which share shifted O atoms both above and below the plane containing the rotating octahedron. Therefore, for an octahedron rotating about a axis the correlation volume is a sphere with diameter , containing more octahedra than in the previous case. We therefore postulate that below the magnitudes of the tilts start becoming so large to cause their propagation through the correlation volume, as for any tilt instability, but this will occur first for those clusters where a deviation toward tilt, with smaller correlation volume, is favored by the local cation disorder. In this first stage between and , only superlattice peaks would appear, easily masked by those from AFE cation correlations. On further cooling below , the increased instability of the mode and long range elastic interactions trigger the long range tilt order of the phase. In other words, in the absence of disorder or frustration and would coincide and represent the temperature below which the propagation of the tilt instability starts. In the presence of disorder, local tilting about axes is favored because of its smaller correlation volume; the resulting disordered tilting partially relieves the mismatch between Pb-O and (Zr/Ti)-O bonds, and further cooling below is necessary in order to reach the long range ground state. This may explain the deep depression of below .
IV.4 The kink in the tilt instability line and the effect of coupling of different modes on the phase diagram
If octahedral tilts and polar modes were independent of each other, the and lines might approach and possibly cross each other in an independent manner. Instead, merges with at with a noticeable kink around . The line seems ”attracted” by , as if the tilt instability were favored by the ferroelectric one. On the other hand, also may feel some effect from the proximity with , since its slope slightly decreases after joining with below . It appears that both and increase with respect to the trend extrapolated from higher , when they are far from each other. This is shown in Fig. 9, where the dashed lines are the extrapolations (with no pretension of quantitative analysis) of and . The vertical arrows are the maximum deviations of the actual and lines from their extrapolations, K and K. A possible qualitative explanation of this observations is in terms of cooperation between a stronger FE instability and a weaker AFD tilt instability. The FE mode leaves the lattice unstable also below , since its restiffening is gradual, and also affects the modes coupled to it, in particular favoring the condensation of modes cooperatively coupled to it at a temperature higher than in the normal stiff lattice away from . The rotations of the octahedra are certainly coupled with the polar modes, as demonstrated by the polarizationWCG78 ; CNI97 and dielectricDXL95 ; 145 anomalies at the tilt transitions, and the issue whether this coupling is cooperative or competitive is discussed in Sect. IV.8. Assuming that the first eventuality is true, one has a mechanism that enhances in the proximity of , but the coupling works also in the other sense: the proximity of the tilt instability favors the condensation of the FE mode, enhancing . The energies involved in the FE instability are larger than those involved in tilting, as indicated by the fact that , and accordingly the perturbation of the FE mode on the tilt mode is larger: . A phenomenological modelHol73 that may be applied to explain these effects will be described in Sect. IV.7.
IV.5 Kinks in the and lines
Other new features of the PZT phase diagram that derive from the present data are the approaches of the line with and , and a distinct kink in when encounters . This is better seen in the detail of the MPB region in Fig. 10, where, besides the same data of Fig. 7, other points of and are reported from the literature. The data are from diffractionNCS00 () piezoelectric coefficientArl90 (), measured with piezoelectric resonanceSMR08 (o), RamanSLA02 (—), dielectric (+) and infrared () BNP11 spectroscopies.
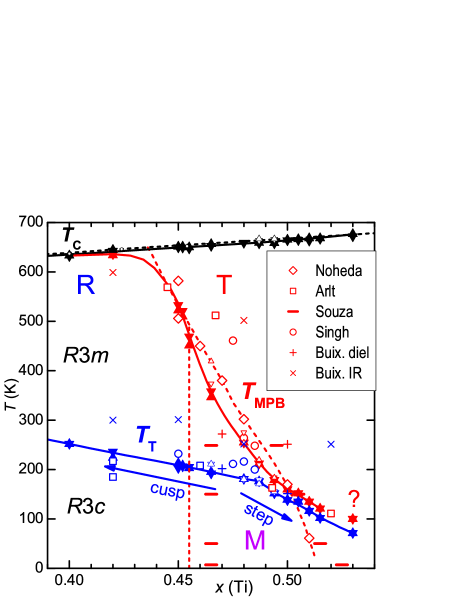
Let us first consider how enters the MPB region. The points from the literature, obtained from different techniques and samples, are rather sparse, but those from our anelastic and dielectric spectra have little dispersion, and show a clear change of slope of when it approaches at . This narrow composition range is close to but not the same over which the anomaly in changes between cusped and steplike (Fig. 6). In fact that change, marked by arrows in Fig. 10, occurs at , and therefore the two changes may depend on different mechanisms. We will discuss the transition in the shape of the anomaly in Sect. IV.9, and now we focus on the kink in the line, which we think is closely connected with the proximity to the MPB.
Also our points draw a curve with little dispersion, compared to the body of data in the literature, but in this case a difference emerges in the low temperature region: even though with only three points below 100 K, the data from diffractionNCS00 and RamanSLA02 define an almost straight MPB border that ends at at . Instead, our data define a curved line that never crosses . Our closely spaced points in the phase diagram and the regular evolution of the spectra from which they are obtained (Figs. 5 and 6) suggest that the effect is real and characteristic of good quality ceramic samples. The last point with the question mark, obtained from the dashed curve in Fig. 5, probably does not correspond to , but the difference remains at between our curve at 120 K, and two points at K from diffraction and Raman scattering. These discrepancies may depend on differences in the samples rather than on the experimental technique. In fact, the existence of the intermediate monoclinic phase and its nature are not yet unanimously accepted, and it is also proposed that, besides nanoscale twinning, defect structures like planes of O vacancies may have a role in defining the microstructure of PZT and act as nuclei for intermediate phases.RSR09 Hence, there is a range of microstructures that may well reflect in the position of the MPB, but, again, the consistency and regularity of the data encourage to consider the features presented here as intrinsic of the PZT phase diagram and not vagaries from uncontrolled defects.
It results that also and almost coincide over an extended composition range, with seemingly pushed up by . For , deduced from the maximum in and deduced from the step in run parallel and close to each other and it is difficult to assess whether they still represent two distinct transitions or instead they are the manifestations of a same combined polar and tilt transition.
IV.6 Merging of tilt and polar instabilities also in NBT-BT
Another example in which tilt instability lines merge with polar instability lines is (Na1/2Bi1/2)1-xBaxTiO3 (NBT-BT).139 This system has much stronger chemical disorder than PZT and a more complicated and less defined phase diagram, especially beyond the MPB composition , where the correlation lengths are so short to render the material almost a relaxor. In Fig. 11 the phase diagram of NBT-BT is presented together with that of PZT. The broken lines represent the borders between regions with different tilts, while the solid lines are polar instabilities ( in PZT is both tilt and polar). The regions were two types of instabilities merge are vertically hatched, while differently slanted hatches represent different tilt patterns. In NBT the tolerance factor is small due to the smallness of the mean A ion size of Na+ and Bi3+ combined, and is increased by substituting with Ba. Tilting occurs in two stages, first (T phase) below and then (R) below , and both and have negative , so enclosing the low temperature/low tolerance factor region of the phase diagram, as discussed in Sect. IV.1 (the line actually disappears into a highly disordered relaxor-like region). At variance with PZT, the polar instabilities occur at temperatures lower than those of tilting, and in two stages: first an almost AFE or ferrielectric region below a temperature signaled by a maximum in the dielectric susceptibility, and then FE below the so-called depolarization temperature . The intermediate AFE structure is due to shifts of the Ti and Bi cation along in opposite directions, so to make almost null, and therefore is not the result of coupling with the AFD tilting.JT02 The FE phase, however, appears below a at , which rises and merges with the decreasing at 0.02139 or .HWN07 . Beyond 6% Ba, the and , the latter ill defined, separate again. As a result, the border to the FE phase, instead of simply crossing , merges with it in the range , following a wavy path. This would not be the only instance in the NBT-BT phase diagram where the tilt modes trigger a mixed tilt-polar transition, since it has been recognized that in pure NBT both the transitions at and are of such a type.PKF04
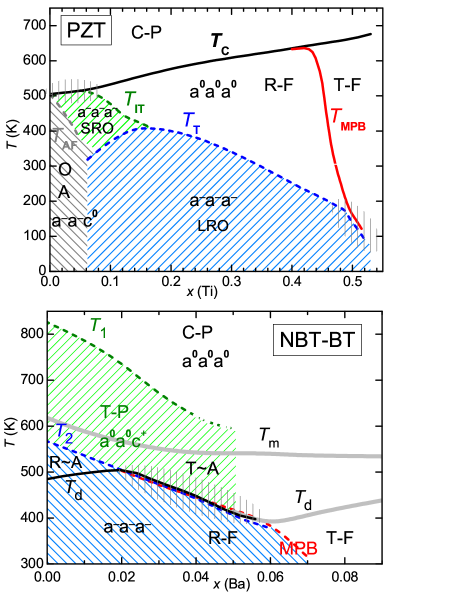
Similarly to the cases of and in PZT, the coincidence of and in the composition range may be interpreted as a manifestation of cooperative coupling between tilt and FE instabilities. Interestingly, like Pb2+ also Bi3+ has a lone pair electronic configuration, with the tendency to reduce its coordination number and form short bonds with covalent characterCLW96 ; JT02 which couple tilt and polar modes.GCW99
IV.7 Merging of tilt and polar instabilities seen as trigger type transitions
A possible mechanism for the merging of two transitions with order parameters (OPs) of different symmetries had been proposed by HolakowskýHol73 and carried on by Ishibashi;Ish94b This is also the case of octahedral tilting, whose OP is the rotation angle , and polar or antipolar modes with OP (all one-dimensional for simplicity). HolakowskiHol73 treated the case of a FE transition triggered by another OP, and we will adapt his arguments to a tilt transition triggered by the FE instability, referring to . In this case the minimal Landau expansion of the free energy is
| (1) |
where and represent the soft modes ideally vanishing at and . In the argument, the temperature dependence of is irrelevant, and Holakowski sets it constant; in our case it should be ). The coupling part contains mixed terms . Since and have different symmetries, not all the mixed terms are invariant under the allowed symmetry operations in the cubic phase, under which must be invariant; the lowest order term allowed by symmetry isHFJ89
| (2) |
Such a term is always possible but generally overlooked when mixed terms of lower order prevail. If this term lowers the free energy when both and , describing a cooperative polarization-tilting coupling. After solving the equilibrium condition , the equilibrium value of is expressed in terms of equilibrium , so that is written only in terms of , and renormalizes as . The reason why the tilting free energy cannot be truncated to is that the renormalized can become negative, in which case a positive 6th order term is needed to stabilize the free energy. We refer to the paper of Holakowsky for the details and only report the result adapted to our case. The occurrence of the FE transition promotes tilting through the biquadratic coupling term, resulting in a tilt transition at a temperature
t that can be also considerably higher than (which is zero in Ref. Hol73, ). Increasing the magnitude of the coupling constant , the onset of the tilt instability is shifted to higher temperature and the following cases are encountered. When the tilt transition is second order and occurs at
hence a temperature higher than if . If with then the transition is first order and occurs between and ; if the free energy may have minima at both and (distinct from those of the pure FE phase with ) already at and therefore a first order transition to a combined tilt/polar transition is possible at .
The above mechanism only requires that the tilt-polarization coupling is cooperative and enough strong, which is not forbidden by any constraint of symmetry or general principle, and we think that it can be at the basis of the anomalous rise and merging in temperature of the tilt and FE instabilities in Zr-rich PZT. The situation should actually be more complicated, since the triggered transition does not produce a phase with a clear symmetry of the polar and tilt OPs, apparently because the energy shifts from chemical disorder compete with the energies involved in the regular Landau expansion of a homogeneous crystal. This disorder would be responsible for preventing the complete tilt transition with long range order down to , and should somehow be included into in the Landau expansion. These considerations should prevent from applying the above simple formulas for deducing the magnitude of from the upward shift of . Yet, an independent indication that is indeed large and positive comes from the positive step in the dielectric susceptibility below , as shown in Sect IV.8.3.
The possibility should be explored that a similar mechanism accounts for the proximity, instead of crossing, of the and lines at , as we observe in our large grain ceramic samples. In this case, the FE OP might be the transversal component , responsible for the rotation of away from the tetragonal axis, and which takes a role in the peak of .
The mechanism of the trigger-type transition has been applied so far to very few cases, like Bi4Ti3O12Hol75 and recently proposed to explain the sequence of phase transitions of the multiferroic BiFeO3,KB09 and is therefore considered as very rare.KB09 The possibility that a trigger-type mechanism is also responsible for the particular features of the phase diagrams of PZT and NBT-BT suggests that it may be not so rare.
Finally, seems to join also smoothly, although the upper end of the line in the phase diagrams above is based on only one datum and largely hypothetical (but in line with the much more marked effect in Ref. FES86, ). This case is different from the previous ones, since the OP active below is not independent from that active at , both being the polarization, and a triggered phase transition as above would be meaningless. Nonetheless, the manner in which meets deserves further investigation.
IV.8 Competition or cooperation of tilt and polar modes?
The interpretation above contrasts with the widespread opinions that the coupling between tilt and polar modes is negligible or competitive, and therefore it is opportune to discuss the nature of the interaction between polar and tilt modes.
IV.8.1 Negligible tilt-polarization coupling
In the context of the general trends of the perovskite phase diagrams at different compositions, the coupling between tilting and deformation or polar modes has been considered negligible in rhombohedral perovskites.TB94 This assumption was based on the observation that in a large number of rhombohedral perovskites, including FE ones, the rotation angle of the octahedra and the polyhedral volume ratio mentioned in Sect. IV.1 are related by
| (3) |
which is valid in the absence of octahedral distortions. In other words, the tilt angles are independent of the distortions,TB94 which necessarily occur in the FE phases. This fact, however, shows that the mismatch between the bond lengths or polyhedral volumes is accommodated almost exclusively by the tilting mechanism, and this is understandable, since the only two normal modes producing a large change of are in-phase and anti-phase rotations of the octahedra, while all the other modes yield distortions with little change of .WA11 Therefore, while the validity of Eq. (3) is a manifestation of the fact that depends almost exclusively on the tilting angle , it does not imply a lack of coupling between tilting and the other distortion and displacement modes, for example influencing the type of tilt correlations.
IV.8.2 Competitive tilt-polarization coupling
The most widely accepted view is of a competition between FE and AFD instabilities, based on their opposite behavior under pressure.SSY75 ; KND09 ; FFZ09 ; FAH11 Indeed, in titanates and other perovskites pressure suppresses FE and promotes tilting, and this can be simplistically understood in terms of a steric mechanism: FE requires more space for cation off-centering while the octahedral rotation is promoted by a compression of the lattice that amplifies the mismatch between B-O and A-O sublattices. These observations, however, show that the two instabilities behave in opposite manner under pressure, but not necessarily that they compete against each other. It should also be noted that there are several exceptions to the ”rule” that pressure favors tilting, for example perovskites with trivalent B = Al,RZA04 Gd,ZRA04 and there are even studies that assume that the general rule is just the opposite: pressure induces the more symmetric cubic structure.MVJ02 These different behaviors under pressure depend on the relative compressibilities of the AO12 and BO6 polyhedra, which can be rationalized in terms of the bond valence sum concept.AZR05 It appears that in the zirconates and titanates the BO6 octahedra are stiffer than the AO12 cuboctahedra, which is the usual case when B has larger valence than A.
Another strong and widely acceptedFAH11 indication of competitive AFD-FE interaction comes from simulationsZV95 on SrTiO3 showing that the FE mode of cation displacements along and the AFD anti-phase tilt modes compete against each other. The simulations are done on SrTiO3, which actually is not ferroelectric due to quantum fluctuations, but their result is clear: neglecting quantum fluctuations, the temperature of the tilt instability is 25% higher if the FE mode is frozen, while is 20% higher if the AFD mode is frozen. This means that the two modes tend to cancel each other rather than cooperate, and the microscopic mechanism is identified in the mutual anharmonic interaction. The behavior of and in PZT or and in NBT-NT, however, seems the opposite. It is possible that the nature of interaction between AFD and FE modes is different when the A ion is Pb instead of Sr, since the difference is not only of ionic size but there is also a more strongly covalent character of the bond when Pb goes off center.CLW96 ; JT02 The other difference between the SrTiO3 and PZT case is that in the first only the component of the mode becomes unstable, leading to a T structure, while in PZT all three components yield the R structure. It is therefore unlikely that the simulation of SrTiO3 can be plainly generalized to Pb compounds. Rather, it may be more appropriate to refer to similar simulationsKB09 on multiferroic BiFeO3, where also Bi3+ has the stereoactive lone pair like Pb2+. Such simulations indicate that the sequence of FE and AFD transitions is indeed dominated by the trigger-type mechanism, and that the coupling between the two types of modes is strong and both competitive and cooperative, due to the fact that the order parameters are multicomponent.KB09
IV.8.3 Cooperative tilt-polarization coupling
That the tilts are coupled with polar modes is demonstrated by the fact that below there is a positive step in the real part of the dielectric susceptibility,VLD96 ; 127 ; 145 as clearly shown in Fig. 2, and in the polarization.WCG78 If the modes competed against each other, then the onset of tilting should depress rather than enhance the polarization and its derivative, and this becomes clear when considering the biquadratic coupling term, Eq. (2), the leading term allowed by symmetry. Below the equilibrium tilt angle starts growing, and renormalizes the term of the free energy as and hence the dielectric stiffness . Therefore, below a positive step is observed in if and a negative one if . From Fig. 2 it appears , namely the coupling between and is cooperative. In principle it would be simple to estimate the magnitude of from that of the step in at , the magnitude of from diffraction and from the Curie-Weiss peak. However, as noted in Sect. IV.6, the simple free energy (1) does not contain the effect of disorder that depresses , and the relevance of deduced in this manner would be questionable.
Additional indications of cooperative tilt-polarization coupling are the fact that the application of an electric field in PZT modified with Sn and Nb enhances of few degrees.YRB04 and its prediction in BiFeO3 from a first-principle simulation.KB09 The coupling between FE and AFD modes has also been discussed in relation with the appearance of new RamanWWB11 ; WWB12 and infra-redBNP11 modes below .
We think that the fact that tilt and polar instability lines merge over extended composition ranges instead of crossing each other are due to a cooperative coupling between polar/antipolar and tilt modes. It is interesting to note that a simulation of the PZT phase diagram including tilt degrees of freedom has already been done,KBJ06 and the line, though finally crosses , presents a marked bend on approaching it, exactly as appears from our anelastic and dielectric experiments.
IV.9 Transition in the shape of the anomaly at : a possible sign of R/M border
As already noted in Sect. IV.5, the kink in the line and the transition in the shape of the anomaly (Fig. 6) appear at slightly different compositions, suggesting that the latter may have a different origin from the proximity to the MPB and hence polarization-tilt coupling.
If this were the case, the most obvious explanation for the change of the anomaly would be the postulated border separating R and M phases.NCS00 ; SLA02 ; KBJ06 The existence of this border is one of the yet unsettled issues on the phase diagram of PZT, since there are various diffraction studies, also recent and on single crystals,YZT09 ; PLX10 whose Rietveld refinements strongly suggest that the R and M phases coexist at least down to , so excluding a definite phase border. In addition, according to the view that the M phase is actually a nanotwinned R or T phase,Kha10 ; SSK07b this border would not exist. Therefore, a R/M border would be highly significant: it would imply the existence of a long range M phase. A puzzling feature of this border would be its verticality. In fact, a truly vertical phase boundary in the phase diagram would be understandable at a specific composition that allows a phase to be formed with commensurate cation order. This is certainly not the case of the postulated R/M border in PZT, where no Zr/Ti ordering has ever been observed, and anyway is too far from the closest relevant composition . Indeed, the R/M boundary found by first principles based simulations is not vertical: it starts at a triple point with and at and ends at and .KBJ06 No experimental evidence exists so far of the crossing of such a border with change of temperature, and the change of the shape of the anomaly between 0.465 and 0.48 is not a conclusive evidence of its existence, since it might be associated with a change of the character of the transition through polarization-tilt coupling near the MPB. Further experiments at more closely spaced compositions are necessary to ascertain this point.
V Conclusions
Anelastic and dielectric measurements are reported at compositions of the phase diagram of PbZr1-xTixO3 near the two morphotropic phase boundaries (MPB) of the rhombohedral phase with the tetragonal and the orthorhombic phases. Several new features are found in both regions, and discussed in terms of octahedral tilting and cooperative coupling between the tilt and polar/antipolar modes.
We confirm the recent discovery145 of a new phase transition at a temperature that prosecutes the border of the tilt instability up to the Curie temperature , in the region where drops and meets the border with the orthorhombic antiferroelectric phase. The new phase is assumed to represent the initial stage of octahedral tilting, without long range order due to the enhanced cation disorder near the AFE border. Lacking evidence from diffraction for this intermediate tilt region, the rationale for the assumption that tilting is involved is discussed in terms of mismatch between the networks of Pb-O and (Zr/Ti)-O bonds, as usual for tilted perovskites. In addition, it is proposed that, due to the anisotropy of the correlation length of different types of tilts, the initial stage of tilting in the presence of disorder involves flat clusters of octahedra rotating about axes, so producing type modulations, even when the final long range modulation is of type.
The tilt instability line merges with the ferroelectric with an evident step and both temperatures appear enhanced with respect to the extrapolations from the region where they are far from each other. Also the line presents a clear kink when it meets the MPB and, contrary to previous experiments, is found to deviate and go parallel or even merge with , instead of crossing it. These observations of deviations and merging of tilt and polar instability borders are compared to a similar example in NBT-BT, and explained in terms of strong and cooperative interaction between the polar and the tilt modes, which causes a trigger type transition. Since the prevalent opinions are that tilt-polarization coupling is competitive or negligible, and the trigger-type transitions are extremely rare, the various indications of polar-tilt coupling in PZT are reviewed and discussed.
Another feature that is considered is a rather abrupt transition in the shape of the anomaly in the elastic losses at . The anomaly is a peak or cusp for and a step for . The possibility is discussed that between these two compositions there is an actual border between rhombohedral and monoclinic phases.
Acknowledgements.
The authors thank Mr. C. Capiani (ISTEC) for the skillful preparation of the samples, Mr. P.M. Latino (ISC) and A. Morbidini (INAF) for their technical assistance in the anelastic and dielectric experiments.References
- (1) E. Sawaguchi, J. Phys. Soc. Jpn. 8, 615 (1953).
- (2) H. Jaffe, Proc. IEE, B Electron. Commun. Eng. UK 109, 351 (1962).
- (3) B. Jaffe, W.R. Cook and H. Jaffe, Piezoelectric Ceramics. (Academic Press, London, 1971).
- (4) B. Noheda, D.E. Cox, G. Shirane, L.E. Cross and S.-E. Park, Appl. Phys. Lett. 74, 2059 (1999).
- (5) A.G. Khachaturyan, Phil. Mag. 90, 37 (2010).
- (6) K.A. Schönau, L.A. Schmitt, M. Knapp, H. Fuess, R.-A. Eichel, H. Kungl and M.J. Hoffmann, Phys. Rev. B 75, 184117 (2007).
- (7) F. Cordero, F. Trequattrini, F. Craciun and C. Galassi, J. Phys.: Condens. Matter 23, 415901 (2011).
- (8) B. Noheda, D.E. Cox, G. Shirane, R. Guo, B. Jones and L.E. Cross, Phys. Rev. B 63, 014103 (2000).
- (9) A.G. Souza Filho, K.C.V. Lima, A.P. Ayala, I. Guedes, P.T.C. Freire, F.E.A. Melo, J. Mendes Filho, E.B. Araújo and J.A. Eiras, Phys. Rev. B 66, 132107 (2002).
- (10) H.D. Megaw, Proc. Royal Soc. 58, 133 (1946).
- (11) P.M. Woodward, Acta Cryst. B 53, 44 (1997).
- (12) I.M. Reaney, E.L. Colla and N. Setter, Jpn. J. Appl. Phys. 33, 3984 (1994).
- (13) D.I. Woodward, J. Knudsen and I.M. Reaney, Phys. Rev. B 72, 104110 (2005).
- (14) I.D. Brown, Acta Cryst. B 48, 553 (1992).
- (15) I.D. Brown, A. Dabkowski and A.A. McCleary, Acta Cryst. B 53, 750 (1997).
- (16) A.M. Glazer, Acta Cryst. B 28, 3384 (1972).
- (17) I.A. Kornev, L. Bellaiche, P.-E. Janolin, B. Dkhil and E. Suard, Phys. Rev. Lett. 97, 157601 (2006).
- (18) F. Cordero, F. Craciun and C. Galassi, Phys. Rev. Lett. 98, 255701 (2007).
- (19) M. Hinterstein, K.A. Schoenau, J. Kling, H. Fuess, M. Knapp, H. Kungl and M.J. Hoffmann, J. Appl. Phys. 108, 024110 (2010).
- (20) M. Deluca, H. Fukumura, N. Tonari, C. Capiani, N. Hasuike, K. Kisoda, C. Galassi and H. Harima, J. Raman Spectr. 42, 488 (2011).
- (21) E. Buixaderas, D. Nuzhnyy, J. Petzelt, L. Jin and D. Damjanovic, Phys. Rev. B 84, 184302 (2011).
- (22) R. Ranjan, A.K. Singh, Ragini and D. Pandey, Phys. Rev. B 71, 092101 (2005).
- (23) D. Phelan, X. Long, Y. Xie, Z.-G. Ye, A.M. Glazer, H. Yokota, P.A. Thomas and P.M. Gehring, Phys. Rev. Lett. 105, 207601 (2010).
- (24) R. Singh Solanki, A. Kumar Singh, S.K. Mishra, S.J. Kennedy, T. Suzuki, Y. Kuroiwa, C. Moriyoshi and D. Pandey, Phys. Rev. B 84, 144116 (2011).
- (25) F. Cordero, L. Dalla Bella, F. Corvasce, P.M. Latino and A. Morbidini, Meas. Sci. Technol. 20, 015702 (2009).
- (26) A.S. Nowick and B.S. Berry, Anelastic Relaxation in Crystalline Solids. (Academic Press, New York, 1972).
- (27) W. Rehwald, Adv. Phys. 22, 721 (1973).
- (28) M.A. Carpenter and E.H.K. Salje, Eur. J. Mineral. 10, 693 (1998).
- (29) R. G. Burkovsky, Yu. A. Bronwald, A. V. Filimonov, A. I. Rudskoy, D. Chernyshov, A. Bosak, J. Hlinka, X. Long, Z.-G. Ye, S. B. Vakhrushev, arXiv:1204.5878v1 (2012).
- (30) H. Yokota, N. Zhang, A.E. Taylor, P.A. Thomas and A.M. Glazer, Phys. Rev. B 80, 104109 (2009).
- (31) N. Zhang, H. Yokota, A.M. Glazer and P.A. Thomas, Acta Cryst. B 67, 386 (2011).
- (32) E.G. Fesenko, V.V. Eremkin and V.G. Smotrakov, Sov. Phys. Solid State 28, 181 (1986).
- (33) R.D. Shannon, Acta Cryst. A 32, 751 (1976).
- (34) N.W. Thomas, Acta Cryst. B 45, 337 (1989).
- (35) D. Wang and R.J. Angel, Acta Cryst. B 67, 302 (2011).
- (36) C.J. Howard and H.T. Stokes, Acta Cryst. B 54, 782 (1998).
- (37) H. Zheng, I.M. Reaney, W.E. Lee, N. Jones and H. Thomas, J. Am. Ceram. Soc. 85, 2337 (2002).
- (38) J. Burgy, M. Mayr, V. Martin-Mayor, A. Moreo and E. Dagotto, Phys. Rev. Lett. 87, 277202 (2001).
- (39) E. Dagotto, New J. Phys. 7, 67 (2005).
- (40) D.L. Corker, A.M. Glazer, R.W. Whatmore, A. Stallard and F. Fauth, J. Phys.: Condens. Matter 10, 6251 (1998).
- (41) J. Hlinka, P. Ondrejkovic, M. Kempa, E. Borissenko, M. Krisch, X. Long and Z.- G. Ye, Phys. Rev. B 83, 140101 (2011).
- (42) D. Viehland, Phys. Rev. B 52, 778 (1995).
- (43) D. Viehland, J.-F. Li, X. Da and Z. Xu, J. Phys. Chem. Sol. 57, 1545 (1996).
- (44) J. Ricote, D.L. Corker, R.W. Whatmore, S.A. Impey, A.M. Glazer, J. Dec and K. Roleder, J. Phys.: Condens. Matter 10, 1767 (1998).
- (45) Y. Kuroiwa, Y. Terado, S.J. Kim, A. Sawada, Y. Yamamura, S. Aoyagi, E. Nishibori, M. Sakata and M. Takata, Jpn. J. Appl. Phys. 44, 7151 (2005).
- (46) B. Ravel and E.A. Stern, Physica B 208&209, 316 (1995).
- (47) P. Sollich, V. Heine and M.T. Dove, J. Phys.: Condens. Matter 6, 3171 (1994).
- (48) R.W. Whatmore, R. Clarke and A.M. Glazer, J. Phys. C: Solid State Phys. 11, 3089 (1978).
- (49) N. Cerereda, B. Noheda, T. Iglesias, J.R. Fernandez - del Castillo, J.A. Gonzalo, N. Duan, Y.L. Wang, D.E. Cox and G. Shirane, Phys. Rev. B 55, 6174 (1997).
- (50) X. Dai, Z. Xu, J.-F. Li and D. Viehland, J. Appl. Phys. 77, 3354 (1995).
- (51) G. Arlt, Proc. IEEE Ultrasonic Symposium, 733 (1990).
- (52) A.K. Singh, S.K. Mishra, agini, D. Pandey, S. Yoon, S. Baik and N. Shin, Appl. Phys. Lett. 92, 022910 (2008).
- (53) L.A. Reznichenko, L.A. Shilkina, O.N. Razumovskaya, E.A. Yaroslavtseva, S.I. Dudkina, O.A. Demchenko, Yu.I. Yurasov, A.A. Esis and I.N. Andryushina, Phys. Solid State 51, 1010 (2009).
- (54) F. Cordero, F. Craciun, F. Trequattrini, E. Mercadelli and C. Galassi, Phys. Rev. B 81, 144124 (2010).
- (55) G.O. Jones and P.A. Thomas, Acta Cryst. B 58, 168 (2002).
- (56) Y. Hiruma, Y. Watanabe, H. Nagata and T. Takenaka, Key Eng. Mater. 350, 93 (2007).
- (57) J. Petzelt, S. Kamba, J. F bry, D. Noujni, V. Porokhonskyy, A. Pashkin, I. Franke, K. Roleder, J. Suchanicz, R. Klein and G. E. Kugel, J. Phys.: Condens. Matter 16, 2719 (2004).
- (58) I.-W. Chen, P. Li and Y. Wang, J. Phys. Chem. Sol. 57, 1525 (1996).
- (59) Ph. Ghosez, E. Cockayne, U.V. Waghmare and K.M. Rabe, Phys. Rev. B 60, 836 (1999).
- (60) J. Holakovský, phys. stat. sol. (b) 56, 615 (1973).
- (61) Y. Ishibashi, J. Phys. Soc. Japan 63, 2082 (1994).
- (62) M.J. Haun, E. Furman, S.J. Jang and L.E. Cross, Ferroelectrics 99, 13 (1989).
- (63) J. Holakovský, phys. stat. sol. (b) 69, 615 (1975).
- (64) I.A. Kornev and L. Bellaiche, Phys. Rev. B 79, 100105 (2009).
- (65) N.W. Thomas and A. Beitollahi, Acta Cryst. B 50, 549 (1994).
- (66) G.A. Samara, T. Sakudo and K. Yoshimitsu, Phys. Rev. Lett. 35, 1767 (1975).
- (67) J. Kreisel, B. Noheda and B. Dkhil, Phase Trans. 82, 633 (2009).
- (68) J. Frantti, Y. Fujioka, J. Zhang, S.C. Vogel, Y. Wang, Y. Zhao and R.M. Nieminen, J. Phys. Chem. B 113, 7967 (2009).
- (69) G. Fraysse, A. Al-Zein, J. Haines, J. Rouquette, V. Bornand, P. Papet, C. Bogicevic and S. Hull, Phys. Rev. B 84, 144110 (2011).
- (70) N. L Ross, Zhao and R. J Angel, J. Solid State Chem. 177, 1276 (2004).
- (71) J. Zhao, N.L. Ross and R.J. Angel, Acta Cryst. B 60, 263 (2004).
- (72) B. Magyari-Köpe, L. Vitos, B. Johansson and J. Kollár, Phys. Rev. B 66, 092103 (2002).
- (73) R.J. Angel, J. Zhao and N.L. Ross, Phys. Rev. Lett. 95, 025503 (2005).
- (74) W. Zhong and D. Vanderbilt, Phys. Rev. Lett. 74, 2587 (1995).
- (75) P. Yang, M.A. Rodriguez, G.R. Burns, M.E. Stavig and R.H. Moore, J. Appl. Phys. 95, 3626 (2004).
- (76) D. Wang, J. Weerasinghe, L. Bellaiche and J. Hlinka, Phys. Rev. B 83, 020301 (2011).
- (77) J. Weerasinghe, D. Wang and L. Bellaiche, Phys. Rev. B 85, 014301 (2012).