Advances in the RXTE Proportional Counter Array Calibration: Nearing the Statistical Limit
Abstract
During its 16 years of service the Rossi X-ray Timing Explorer (RXTE) mission has provided an extensive archive of data, which will serve as a primary source of high cadence observations of variable X-ray sources for fast timing studies. It is, therefore, very important to have the most reliable calibration of RXTE instruments. The Proportional Counter Array (PCA) is the primary instrument on-board RXTE which provides data in 3-50 keV energy range with sub-millisecond time resolution in up to 256 energy channels. In 2009 the RXTE team revised the response residual minimization method used to derive the parameters of the PCA physical model. The procedure is based on the residual minimization between the model spectrum for Crab nebula emission and a calibration data set consisting of a number of spectra from the Crab and the on-board Am241 calibration source, uniformly covering the whole RXTE mission operation period. The new method led to a much more effective model convergence and allowed for better understanding of the PCA energy-to-channel relationship. It greatly improved the response matrix performance. We describe the new version of the RXTE/PCA response generator PCARMF v11.7 (HEASOFT Release 6.7)along with the corresponding energy-to-channel conversion table (verson e05v04) and their difference from the previous releases of PCA calibration. The new PCA response adequately represents the spectrum of the calibration sources and successfully predicts the energy of the narrow iron emission line in Cas-A throughout the RXTE mission.
Subject headings:
instrumentation: detectors — space vehicles: instruments1. Introduction
The Rossi X-ray Timing Explorer (RXTE) was launched on December 30, 1995 and successfully operated until January 4, 2012. RXTE is an X-ray observatory with a powerful and unique combination of large collecting area, broad-band spectral coverage, high time resolution, flexible scheduling, and ability of quick response and frequent monitoring of time-critical targets of opportunity. RXTE observations have led to breakthroughs in our understanding of physics of strong gravity, high density, and intense magnetic field environments found in neutron stars, galactic and extragalactic black holes and other sources. The mission combined two pointing instruments, the Proportional Counter Array (PCA) developed to provide data for energies between 3 and 50 keV, and the High Energy X-ray Timing Experiment (HEXTE; Rothschild et al., 1998) covering the 20-250 keV energy range. These instruments were equipped with collimators yielding a FWHM of one degree. In addition, RXTE carried an All-Sky Monitor (ASM; Levine et al., 1996) that scans about 80% of the sky every orbit, allowing monitoring at time scales of 90 minutes or longer. Data from PCA and ASM are processed on board by the Experiment Data System (EDS).
The PCA is array of five large-area proportional counter units (PCUs) designed to perform observations of bright X-ray sources with high timing and modest spectral resolution. The main chamber of each PCU is divided into three volumes or layers filed with xenon. In addition, all PCUs were initially equipped with a propane-filled ’”veto” layer in front of the top xenon layer. The calibration of the PCA, as well as the details of its design and operation, are described in Jahoda et al. (2006, J06 hereafter). The response generation software for the PCA is based on physical model of the instrument. The main components of the model are the quantum efficiency, which gives the probability of an X-ray photon to be absorbed in one of the detector volumes, and the redistribution matrix, which provides the probability for a photon to be detected in one of the PCU energy channels. The model has a complex dependence on many parameters, which have to be properly optimized to minimize a difference between the predicted model and the observed spectrum of one or more calibration sources, i.e. sources with well known spectral characteristics. Implementation of an effective parameter optimization procedure is vital in performing this task.
The set of PCA parameters describing the instrument response since the start of the mission and until 2004 has been calculated in J06. However, calibration observations of the Crab and other sources after 2004 suggested that the model and its parameters have to be updated to provide a consistent response for new science observations. In 2009 we revised the PCA model and the response minimization method. The new model provided significant response improvement for the entire mission span, and especially for the data collected after 2004.
In this paper we describe in detail the new fitting procedure and the results of the PCA response modeling. The paper is structured as follows. In the next section we provide a brief review of the PCA physical model and the response generation software. The calibration data is described in §3. In §4 we provide the details of our PCA model implementation and the response minimization fitting environment in XSPEC astrophysical fitting package. We describe and discuss the results in §5. Conclusions follow in §6.
2. The PCA detector model and the response generator PCARMF
For spectral analysis of PCA data with spectral modeling tools like XSPEC (Arnaud, 1996), one must supply a response matrix. This matrix describes the probability of a photon of a particular energy to be detected in a specific channel of a instrument detector. Response calculation for PCA is provided by the pcarmf tool, which is a part of FTOOLS astrophysical data analysis environment, maintained by HEASARC111http://heasarc.gsfc.nasa.gov/docs/software.html.
The pcarmf tool has several major components: quantum efficiency (i.e. effective area), redistribution matrix (i.e. the spectral resolution), and the energy-to-channel relationship (i.e. the gain). Different components of the response are controlled by various parameters. The quantum efficiency and redistribution parameters are stored in the task parameter file pcarmf.par. The energy-to-channel relationship is described by coefficients in a table which resides in calibration database CALDB, the so-called ”e2c” file (which can alternatively can be supplied as a stand-alone FITS file). The previous e2c relationship (released in 2004,J06) is referred to as e05v03, while a new e2c relationship described here is designated as e05v04.
The detailed description of the physical model of the PCA response is presented in J06. While the major design of the physical model is kept the same in the new response, some modifications are introduced to improve the model performance. During the process of response modeling to obtain a new PCARMF parameter set which best reproduces the calibration data, we have made necessary additions and modifications to the quantum efficiency and energy-to-channel models. We provide detailed description of differences between new and previous models below.
The PCA response physical model defines a secondary energy scale of the incoming photon, which is proportional to the number of electrons produced in the detector. It is related to the actual photon energy by a factor close to unity, experiencing small variations with energy (see J06 and references therefin). The relationship between and is adopted to the new PCA response without any changes. The new PCA e2c e05v04 now has an ”instantaneous” quadratic relationship between channel and (see J06):
| (1) |
where
| (2) |
and
| (3) |
where is time in days between the observation start time and a reference time , which is taken as December 20, 1997 00:00 UTC (50802.0 MJD). The above new e2c relationship has several major differences with respect to the previous response version. Namely, we drop the quadratic terms in time dependence of and , and we add a cubic term in the energy dependence (compare with Eq. 3-5 in J06).The energy-to-channel relationship (i.e. six coefficients ,,,, and ) is determined by various calibration-type observations.
Time dependent terms in the e2c relationship are due to gradual changes in density, pressure and volume of xenon gas in the detector chambers caused by slow interchange of gas between the PCU volumes, chamber walls bowing and other effects. While the leak of xenon from the top layer into the propane ”veto” layer seems to be the dominant factor, it is extremely difficult to account for every such effect in exact manner. Fortunately, allowing the linear time dependent trends in the linear and quadratic energy terms individually for each layer is sufficient to account for the cumulative effect. As a result the values of the parameters and differ significantly from layer to layer for a particular PCU.
In addition, abrupt shifts in the relationship are caused by such events as PCU high voltage change or propane layer loss. Planned voltage changes were made on March 21, 1996, April 15, 1996 and March 22, 1999 (J06). The propane layers of PCUs 0 and 1 were lost on May 12, 2000 and December 25, 2006 correspondingly, due to the sudden loss of a veto layer, presumably, because of a micrometeorite impact (we adopt 0-4 PCU numbering convention throughout the Paper). Due to these events the entire RXTE mission span is divided into epochs, each having an individual sets of e2c parameters. The previous e2c e03v04 had 5 epochs. The epochs 1,2,3,4 were divided by voltage changes, while the PCU0 propane pressure loss event defined the start of epoch 5 (see J06). We find that for e2c e05v04 the epoch 5 is required only for PCUs 0 and PCU 1 beginning on the propane layer loss event (see below). We, therefore, redefine epoch 5 as starting on veto layer loss event and we effectively drop epoch 5 for PCUs 2,3 and 4. These changes in e2c relationship are the most important ingredients of the response improvement.
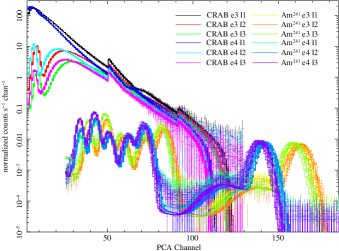
Another area where PCARMF v11.7 differs significantly from v11.1 is treatment of xenon L-escape lines. In the previous response version L-escape lines were ignored. While L-escape contribution for the PCU layer 1 is indeed negligible, this is not true for layers 2 and 3. Most probably, this can be explained by the following scenario. Almost all photons entering the detector with energies near the L-edge (5 keV) are absorbed in the top layer and most of L-escape photons produced in this layer are vetoed. However, a small fraction of L-escape photons in layer 1 do not get absorbed in the same layer and therefore are not vetoed. Some fraction of these photons is detected in layers 2 and 3. For these layers the contribution from these photons is not small. In fact, these L-escape photons from the top layer contribute significantly to the overall signal in these layers which can be seen by eye as apparent spikes in spectra of layer 2 and 3 below PCA channel 10. This effect was not accounted for in previous PCA calibration versions. It led to an artificial feature at about 45 keV, when data from all PCU layers were analyzed jointly, which is a common approach. In the PCARMF v11.7 The L-escape contribution is described for each layer individually. According to expectations, the normalization for L-escape line is effectively zero for the top layer and non-zero for the second and third layers. They are implemented as parameters and .
3. Calibration data
The PCA calibration relies on the data from the Crab nebula and the on-board Am241 calibration source. Each PCU is equipped with a radioactive Am241calibration source which produces six fixed-energy lines at 13.93, 17.53, 21.13, 26.35, 29.8, 59.54 keV. The Crab provides information on quantum efficiency, while the Am241 data constrain the energy redistribution and e2c relationship. The PCA ”calibration” data set is a collection of spectra for selected dates (given in Table 1), quasi-uniformly covering an entire RXTE mission span, beginning on April 15, 1996 (MJD 50188), i.e. the start time of the calibration epoch 3. Observations taken before this date during epoch 1 and 2, i.e. during the first few months of RXTE in-orbit performance, are regarded as a science validation and verification observations. Moreover, high voltage setting during this period may have resulted in non-linear effects which are not accounted for in the physical PCA response model. This can result in a systematic effects which would affect the response quality for the entire mission. To avoid this, we excluded observations taken before April 15, 1996 from the ”calibration” data.
The PCA calibration observations are collected in two different data modes. The Am241 data are available in GoodXenon PCA data mode, providing the most detailed event description in 256 energy channels. The Crab observations are packaged in Standard2 mode, having 129 energy channels. We implemented two XSPEC spectral models producing 129 bin spectrum for the absorbed power law input source spectrum and 256-bin spectrum for the sum of six Gaussian to model the Crab emission and the Am241 energy-to-channel calibration source spectra correspondingly.
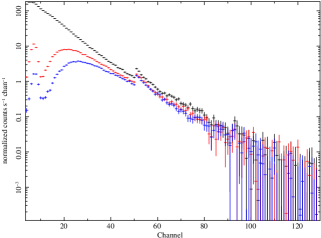
Calibration spectra were extracted using the following strategy. We first selected a sample of 20 longest pointed RXTE observations of the Crab roughly uniformly covering the period between 1996 and 2012 for which all five PCUs were active. Although the most clean Am241 data are available during the dedicated background observations, we found that using individual observations does not provide enough statistics to fit individual Am241 spectral lines. We, therefore, have taken the following path to generate Am241 calibration spectra. We identified the dates when optimal number of the background observations are accompanied by the observations of faint sources, for which the Am241 calibration data is not strongly contaminated by the signal from the observed source. For each selected date we generated good time intervals for an entire day by filtering out the periods when the total PCU count rate exceeds 1500 counts per second. This would exclude observations of very bright sources such as Sco X-1, GRS 1915+105, Cyg X-1. Using this selection criteria, spectra with exposure of a few tens of kiloseconds were produced for individual dates, so the evolution of the energy-to-channel relationship can be modeled. With these selections in place we extracted spectra for each individual layer of each PCUs, applying additional standard selection criteria to filter out episodes of Earth occultations, South Atlantic Anomaly passages, PCU breakdowns, etc. Examples of the Crab nebula and Am241 calibration spectra are shown in Figure 1. In Table 1 we show dates when the ”calibration” observations were taken.
4. The response minimization method
The pcarmf parameter minimization procedure implemented prior to the version v11.7 was divided into several steps. First, the e2c parameters were obtained by approximating the e2c relationship to best represent energies of the Am241 lines and the iron Kα lines derived from a set of Cas-A observations. Then, individual Crab observations were fitted with the response model. Because of lack of sensitivity of the fits to individual observations, only a subset of response parameters was allowed to vary in this approach. This required several subsequent runs to optimize different parameter subsets. As the last step, the results were averaged to get the final parameter values. This method provided a reliable PCA calibration for the data taken before 2004. However, for more recent observations calibration tests showed degrading quality of the energy-to-channel relationship as well as representation of the Crab nebula spectrum by the calibration model. To produce a reliable response for the entire RXTE performance period of more than 15 years, a new, more effective method of response parameter minimization was required.
To optimize a response modeling procedure we created a new RXTE/PCA calibration environment within XSPEC astrophysical fitting software. First, we implemented the PCA response model as an XSPEC model. Because the e2c-relationship is a part of the model, it operates in a raw PCA instrumental channel space. Namely, assuming a particular source spectrum (e.g. power law or sum of Gaussians), it convolves the spectral shape with the PCA response, defined by a set of parameters identical to pcarmf parameters, and yields the expected number of counts in each spectral channel for a given input energy spectrum. The model has the same set of parameters as pcarmf task plus normalization, which is effectively a PCU area modified by a PCU offset factor (see below).
A set of PCA response parameters describing one particular PCU unit is obtained by fitting a ”calibration” set of the Crab and Am241 spectra.
After data selection and extraction ”calibration” spectra are loaded in one XSPEC session and a separate response model is assigned to each spectrum, convolved with an appropriate source spectrum (e.g. absorbed power law for Crab or a sum of six Gaussians for the Am241 source). In the Crab spectra we ignore PCA Standard2 mode channels 1-3, which corresponds to the first seven channels of the raw PCU 256 channels. The Am241 data below PCU channel 25 do not contain any information on the e2c relationship and are also ignored in our fits. Despite the enormous number of total parameters for all model components (several thousands per fitting session), the number of independent parameters is less then a hundred as most parameters are interlinked with each other.
The following parameter linking has been implemented:
-
•
all spectra have their source spectral parameters (i.e. power law index and normalization for the Crab spectra and parameters describing six gaussians for the Am241 data) interlinked and fixed, except for the Gaussian normalizations which are free but interlinked for spectra from the same layer
-
•
all spectra had the parameters describing xenon and propane amounts and parameters describing PCU geometry (i.e. normalization, thickness of mylar and aluminum windows) linked for all spectra
-
•
parameters of physical model describing quantum efficiency and redistribution are the same for all ”calibration spectra”
-
•
energy-to-channel parameters are the same for all spectra belonging to the same layer and gain epoch
As a spectral model for the Crab emission spectra we used a standard absorbed power law model with the same Crab spectral properties which were assumed for previous PCA response versions: the index , normalization and cm-2. Recent analyses of X-ray multi-mission data show evidence for the departure of the Crab spectral shape from a simple power in a broad band spectral range Kirsch et al. (2005); Weisskopf et al. (2010). However, there is no reliable alternative beyond this model has been identified yet. We therefore tentatively follow the Weisskopf et al. (2010) conclusion that the approach where response parameters are tuned to approximate a smooth shape for the Crab spectrum is justified. The PCA response minimization procedure described above can be easily modified to accommodate any spectral form of the calibration target. It will be straightforward to recalibrate the PCA to a new shape of the Crab spectrum, when it becomes available.
We note, that in recent analysis of multi-mission lightcurve from the Crab nebula (including major contribution from RXTE) Wilson-Hodge et al. (2011) identified a quasi-periodic modulation in the Crab flux with a period of approximately 3 year and amplitude of a several percent. Our analysis of the Crab pulsed emission, also reported in Wilson-Hodge et al. (2011), have strongly suggested the nebula as a origin of the modulation. This result would undermine validity of the calibration obtained by fitting the Crab data collected over periods much smaller than the observed periodicity. However, we model the RXTE/PCA response based on the data collected for 15 years. We, therefore, assume that any variations in Crab spectrum are averaged out. In §5 we provide a check for this assumption by fitting the absorbed power law to the individual Crab observations throughout the entire mission span. The power law parameters show small, mostly short-term variations around the calibration values, which are expected by have a small effect on the overall fit.
As a first step, we determined response parameters for PCU 2 we used data for 20 Crab observations and Am241 spectra for 15 days totaling in 105 individual spectra. The model have 5445 parameters in total from which 74 are free. After a minimum fit statistic is achieved for the session including both Crab and Am241 data, we perform an additional fit on a reduced data set using the Crab data only with the e2c coefficients fixed. This is done to remove any possible contribution from the unmodeled residuals from Am241 data to the response parameter values. The resulting parameter values are given in Tables 2 and 3. Then, this procedure is repeated for other PCUs, although this time we fixed the PCA parameters universal for all PCUs, i.e. ,, etc., (see Table 2). This implies that the universal PCA parameters obtained by the fit to PCU2 data are valid for all other PCUs. This is a good assumption as the PCA universal parameters describe PCU physics and geometry which are quite similar for all PCUs.
5. Results
As a zeroth approximation for our fits we use have used parameter values from the previous release of PCA calibration, i.e. PCARMF v11.1 and e2c e05v03. We remind that the previous e2c table has 5 epochs, with the fifth epoch starting on May 13, 2000 00:00 (MJD 51677). As described below, in the new e2c table the fifth epoch is retained for PCUs 0 and 1 only with individual start dates corresponding to the moments of a propane layer loss.
Major improvements in performance was achieved as a result of the following modifications to the PCA response model and e2c relationship:
-
•
First, we observed that the non-linear terms of the time dependence in the e2c relationship, namely, coefficients and in Equations 4 and 5 of J06 are not required to account for the e2c relationship evolution . This is consistent with a slow linear time evolution as a result of a small leak of xenon from the first layer to the propane veto layer. Fixing these parameters at zero led to a dramatic improvement in the convergence speed and fit quality. Subsequent thawing of these parameters did not improve the statistic and showed that their values are consistent with being effectively zero.
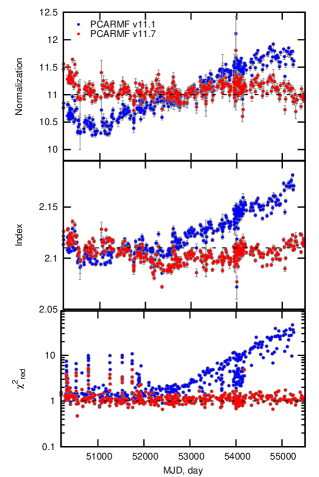
Figure 3.— The Index (top), normalization (middle) and the reduced (bottom) of the absorbed power law fit to the Crab nebula RXTE spectra throughout the mission. The spectra from the top layer of the PCU 2 are used for fits. Blue data points show fit results using the PCARMF v11.1, while red points show results of the new response (PCARMF v11.7). -
•
The next important observation concerning the behavior of e2c relationship was that the e2c parameters obtained for epoch 5 were statistically identical to the best-fit values for corresponding parameters of e2c epoch 4. This effectively showed that, in accordance with expectations, a new e2c epoch is required only when an abrupt change in e2c relationship occurs either due to the PCU anode voltage change or due to the loss of the PCU propane layer. This renders the epoch 5 obsolete for PCUs 2,3 and 4. Epoch 5 is retained for PCUs 0 and 1 starting at the corresponding date of propane layer loss.
-
•
The energy resolution in channel space is modeled as
(4) where B is defined in Equation 3. In e2c energy resolution coefficients are set to and to formally satisfy the ground test which showed resolution at 6 keV and at 22 keV (J06). We note, however, that two values are generally not constrained by two measurements. Our fits to the Am241 data showed that resolution coefficients have quite different values, i.e. and (see below), which are dictated by Am241 line widths and are also consistent with the ground prelaunch data.
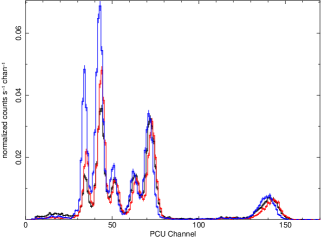
We show PCU 2 calibration spectra fitted with the PCA response model in Figure 2. The final set of best fit parameters is given in Table 2. In Table 3 we also present a complete set of e2c parameters. The quality of the model fit which includes the Crab data only is .
This quite impressive, taking the fact that we did not assume any systematic error in the data. In light of the evidence of the multi-year periodicity in the Crab emission at a level of a few per cent presented by Wilson-Hodge et al. (2011), which is not modeled in our fits, the achieved fit quality may indicate that we are nearing the statistical limit and that the further attempts to improve the fit will not lead to actual improvement of the PCA instrument response. This however, allow us to estimate the range of systematic error to use in spectral fitting of RXTE/PCA spectra. Namely, if we assume systematic error of 0.5%,1% and 1.5% we get the corresponding fit quality of 1.9 and 1.6 and 1.3. This illustrates the range of systematic errors to use for RXTE spectral analysis. For the most observations, the systematic error of 0.5% is sufficient, while for the extreme cases it can be raised up to 1.5%.
The response model fits quality achieved for the PCUs 3 and 4 are similar to that achieved for the PCU2 indicating that the determining the PCA universal response parameters using the PCU2 data only is justified. The data for the PCUs 0 and 1 after the propane layers loss events are contaminated by particle flux and therefore show slightly worse fit quality as expected. For reliable spectral analysis it is recommended to exclude the data from PCUs 0 and 1 after the propane layer loss.
To check the consistency and the quality of the resulting response we fitted the complete set of RXTE observations of Crab throughout the mission with the absorbed power law model keeping the frozen at cm-3 and keeping the index and normalization free. We performed the fits with both the previous and the new response versions. We show the results of the test fits of the Crab nebula data from PCU 2 in Figure 3. It can be clearly seen that the quality of the PCA calibration provided by the PCARMF v11.1 is degrading exponentially starting around MJD 52500. On the other hand PCARMF v11.7 combined with e2c e03v05 are showing uniform fit quality with the reduced 1.0 throughout the entire period of RXTE performance. The variations in the power law index and normalization seen in Figure 3 are consistent with the variations in the count rates from the Crab reported in Wilson-Hodge et al. (2011). While in the power law fit parameters the variations are less visible, a closer examination of their time dependence beginning from MJD 52000 (the start date of the Wilson-Hodge et al. (2011) analysis), especially the index, reveals the correlation. Namely, the index shows the upward trend along with superimposed variations with peaks at MJD 53000 and 54000 in agreement with the downward trend and minima around the same dates seen in the lightcurves shown in Wilson-Hodge et al. (2011). While the global trend for the data shown in Fig. 3 breaks around MJD 52500, the hint for the variations is still present before this date in support of the main claim of the Wilson-Hodge et al. (2011) that the Crab nebular exhibits the long term variations.
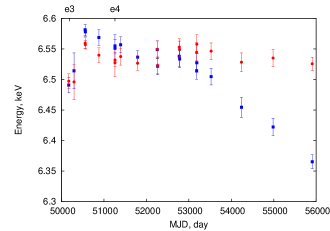
In the PCA response versions prior to the PCARMF v11.7 the data from the supernova remnant Cas A, which shows multiple emission lines in soft X-rays (Holt et al., 1994), was used to constrain e2c relationship by utilizing the energy of the iron line complex at 6.5 keV. We took a slightly different approach by not using the Cas A iron line in the response minimization. Instead, as we fit the Crab data letting both quantum efficiency and e2c parameters change free, we expect that information in the Crab spectrum at the low energies due to xenon L-edges would constrain the energy scale. The Cas A data thus provide a means to check the consistence of the energy scale below 10 keV. Cas A was observed by RXTE on a yearly basis. We fit the Cas A spectrum for the PCU 2 layer 1 between 5 and 14 keV with the model consisting of a power law and two gaussians for the emission line features at 6.5 keV and 8.1 keV. In Fig. 4 we show the results for the new and old PCARMF versions, which clearly show that the PCARMF v11.7 e2c relationship is much more reliable giving a stable energy for the 6.5 keV complex line energy at about 6.54 keV. The old response shows a departure from the 6.5 keV region towards lower energies.
6. Conclusions
We present a new RXTEPCA response version v11.7. This response is based on data set presenting the entire RXTE mission span. While the new response is largely based on the physical model developed in J06, some significant modifications are made, especially for energy-to-channel conversion relationship. The new response shows a superior performance with respect to the previous RXTE response versions.
References
- Arnaud (1996) Arnaud, K. A. 1996, Astronomical Data Analysis Software and Systems V, 101, 17
- Kirsch et al. (2005) Kirsch, M. G., Briel, U. G., Burrows, D., et al. 2005, Proc. SPIE, 5898, 22
- Jahoda et al. (2006) Jahoda, K., Markwardt, C. B., Radeva, Y., Rots, A. H., Stark, M. J., Swank, J. H., Strohmayer, T. E., & Zhang, W. 2006, ApJS, 163, 401
- Holt et al. (1994) Holt, S. S., Gotthelf, E. V., Tsunemi, H., & Negoro, H. 1994, PASJ, 46, L151
- Levine et al. (1996) Levine, A. M., Bradt, H., Cui, W., et al. 1996, ApJ, 469, L33
- Rothschild et al. (1998) Rothschild, R. E., Blanco, P. R., Gruber, D. E., et al. 1998, ApJ, 496, 538
- Weisskopf et al. (2010) Weisskopf, M. C., Guainazzi, M., Jahoda, K., et al. 2010, ApJ, 713, 912
- Wilson-Hodge et al. (2011) Wilson-Hodge, C. A., Cherry, M. L., Case, G. L., et al. 2011, ApJ, 727, L40
| The Crab Nebula aaThe chosen observations of the Crab nebula have all 5 PCUs active | The Am241Source | |||
|---|---|---|---|---|
| ObsID | Start, MJD | ExposurebbThe Crab exposures are the same for all PCUs , s | Date, MJD | Total exposure ccThe exposure is given for PCU2. The Am241 exposures vary for different PCUs and are usually shorter than for the PCU2., ks |
| 10202-02-01-00 | 50191.82 | 2692 | 50200 | 60.9 |
| 10203-01-01-00 | 50318.01 | 9816 | 50800 | 42.0 |
| 20804-01-06-00 | 50793.45 | 13031 | 51000 | 37.6 |
| 30133-01-11-00 | 51021.92 | 1077 | 51210 | 35.2 |
| 30133-01-18-00 | 51120.44 | 884 | 51300 | 53.0 |
| 30133-01-26-00 | 51233.08 | 822 | 51810 | 60.2 |
| 40093-01-03-00 | 51273.51 | 953 | 52400 | 75.2 |
| 50804-01-17-00G | 51937.40 | 5753 | 53200 | 69.4 |
| 60069-01-09-00 | 52273.20 | 869 | 53960 | 27.0 |
| 70802-01-08-00 | 52683.31 | 923 | 54531 | 29.4 |
| 80802-02-09-01 | 52954.69 | 722 | 54861 | 46.85 |
| 90802-02-05-00 | 53273.07 | 430 | 54991 | 37.0 |
| 91802-02-01-00 | 53583.04 | 446 | 55128 | 35.07 |
| 92802-03-06-00 | 54180.24 | 7745 | 55309 | 35.33 |
| 93802-02-12-00 | 54523.10 | 936.0 | 55576 | 38.53 |
| 94802-01-03-00 | 54856.40 | 1322 | ||
| 94802-01-08-00 | 54929.98 | 1167 | ||
| 94802-01-22-00 | 55170.75 | 922 | ||
| 95802-01-03-00 | 55228.32 | 968 | ||
| 95802-01-22-00 | 55548.60 | 998 | ||
| Parameter | Units | Domain | Value | Description |
|---|---|---|---|---|
| xe_gmcm2_l1 | gm/cm2 | PCU Layer 1 | (6.921 0.029) | Xenon amount |
| xe_gmcm2_l3 | gm/cm2 | PCU Layer 2 | (5.739 0.026) | Xenon amount |
| xe_gmcm2_l3 | gm/cm2 | PCU Layer 3 | (5.799 0.024) | Xenon amount |
| xe_gmcm2_pr | gm/cm2 | PCU Propane Layer | (1.312 0.056) | Xenon amount at the reference date |
| xe_gmcm2_dl | gm/cm2 | PCU Dead Layer | (4.41 0.27) | Xenon amount |
| pr_gmcm2 | gm/cm2 | PCU Propane Layer | (2.646 5.272) | Propane amount |
| my_gmcm2 | gm/cm2 | PCU | (6.893 5.3) | Mylar window thickness |
| al_gmcm2 | gm/cm2 | PCU | (1.204 4.23) | Aluminum window thickness |
| xe_pr_daily | gm/cm2/day | PCU | (3.93 0.02) | Xenon Leak Rate |
| kEdge_veto | PCA | 0.813 0.007 | ||
| lEdge_veto | PCA | 0.934 0.005 | ||
| EscFracKa | PCA | 0.399 0.004 | ||
| EscFracKb | PCA | 0.298 0.003 | ||
| EscFracL2 | PCA Layer 2 | (5.61 0.60) | ||
| EscFracL3 | PCA Layer 3 | (2.028 0.60) | ||
| EscNormKb | PCA | 0.404 0.022 | ||
| EscNormL2 | PCA Layer 2 | 5.44 0.62 | ||
| EscNormL3 | PCA Layer 3 | 126.6 12.6 | ||
| epoint | PCA | 18.4 | ||
| track_coeff | PCA | (3.72) | ||
| track_exp | PCA | 3.320.04 | ||
| pcc_coeff | PCA | (1.370.06) | ||
| wxef | PCA | 0.4920.007 | ||
| resp1 | PCU | 0.17330.0003 |
| Parameter | Epoch 3 | Epoch 4 |
|---|---|---|
| 04/15/96-03/22/99 | 03/22/99-Present | |
| Layer 1 | ||
| A0 | -0.7610.009 | -0.6580.007 |
| A1 | (-5.330.52) | (-9.121.22) |
| B0 | 2.8950.001 | 2.4760.001 |
| B1 | (6.220.08) | (1.050.01) |
| C0 | (-6.840.06) | (-5.170.04) |
| D0 | (5.570.09) | (4.100.06) |
| Layer 2 | ||
| A0 | -0.5600.005 | -0.5770.005 |
| A1 | (2.610.78) | (-1.81.5) |
| B0 | 2.8150.001 | 2.4340.001 |
| B1 | (4.690.10) | (1.040.01) |
| C0 | (-1.320.06) | (-1.710.04) |
| D0 | (-7.680.94) | (6.95.5) |
| Layer 3 | ||
| A0 | -0.3740.008 | -0.2170.008 |
| A1 | (2.71.7) | (-5.353.25) |
| B0 | 2.8100.001 | 2.3910.001 |
| B1 | (4.350.16) | (1.000.02) |
| C0 | (-5.450.06) | (-3.460.04) |
| D0 | (4.240.09) | (2.460.05) |