Using the Bright Ultra-Hard XMM-Newton Survey to define an IR selection of luminous AGN based on colours
Abstract
We present a highly complete and reliable mid-infrared (MIR) colour selection of luminous AGN candidates using the 3.4, 4.6, and 12 m bands of the survey. The MIR colour wedge was defined using the wide-angle Bright Ultra-Hard XMM-Newton Survey (BUXS), one of the largest complete flux-limited samples of bright () “ultra-hard” (4.5-10 keV) X-ray selected AGN to date. BUXS includes 258 objects detected over a total sky area of 44.43 deg2 of which 251 are spectroscopically identified and classified, with 145 being type-1 AGN and 106 type-2 AGN. Our technique is designed to select objects with red MIR power-law spectral energy distributions (SED) in the three shortest bands of and properly accounts for the errors in the photometry and deviations of the MIR SEDs from a pure power-law. The completeness of the MIR selection is a strong function of luminosity. At , where the AGN is expected to dominate the MIR emission, and of the BUXS type-1 and type-2 AGN meet the selection. Our technique shows one of the highest reliability and efficiency of detection of the X-ray selected luminous AGN population with amongst those in the literature. In the area covered by the BUXS survey our selection identifies 2755 AGN candidates detected with SNR5 in the three shorter wavelength bands of WISE with 38.5% having a detection at 2-10 keV X-ray energies. We also analyzed the possibility of including the 22m band to select AGN candidates, but neither the completeness nor the reliability of the selection improves. This is likely due to both the significantly shallower depth at 22m compared with the first three bands of and star-formation contributing to the 22m emission at the 22m sensitivity.
keywords:
galaxies: active-quasars: general-infrared: galaxies1 Introduction
There is strong observational evidence that active galactic nuclei (AGN) play an important role in the formation and growth of galaxies (e.g. Magorrian et al. 1998). Most supermassive black hole growth takes place during an obscured quasar phase, as suggested by the integrated energy density of the cosmic X-ray background (Fabian & Iwasawa, 1999). To understand the evolution of galaxies and to trace the energy output due to accretion and its cosmological evolution, it is critical to map the history of obscured accretion.
X-ray surveys with XMM-Newton and Chandra at energies 10 keV are sensitive to all but the most heavily obscured AGN (e.g. Della Ceca et al. 2008). In Compton-thick AGN (rest-frame column densities exceeding ) the observed flux below 10 keV can be as low as a few % of the intrinsic nuclear flux. In the Compton-thick regime the high energy photons that survive the photoelectric absorption get scattered in the absorber losing part of their energy (Compton down-scattering). This is an important effect that can significantly suppress the transmitted continuum (Matt 2002; Murphy & Yaqoob 2009; Yaqoob et al. 2010). The ongoing Swift/BAT and INTEGRAL/IBIS all-sky surveys at energies 15-200 keV are providing the least biased samples of absorbed AGN in the local Universe (e.g. Bird et al. 2007; Tueller et al. 2008; Winter et al. 2009; Burlon et al. 2011). However, even these surveys are biased against the most heavily absorbed Compton-thick AGN (Burlon et al., 2011).
Surveys at mid-infrared (hereafter MIR) wavelengths (5m) are much less affected by extinction since the obscuring dust re-emits the nuclear optical-to-X-ray radiation at infrared wavelengths. Clumpy torus models predict nearly isotropic emission in the MIR at wavelengths 12m (Nenkova et al. 2008). Thus, MIR-based surveys (or the combination of MIR and data at shorter wavelengths) can potentially trace the elusive obscured accretion missed by hard X-ray surveys (e.g. Daddi at al. 2007; Fiore at al. 2008; Georgantopoulos et al. 2008; Fiore at al. 2009; Severgnini et al. 2012). For example, it has been claimed that objects showing excess emission at 24m over that expected from star formation, termed ”infrared-excess galaxies”, might host heavily obscured and Compton-thick AGN (e.g. Fiore at al. 2008; Fiore at al. 2009). However the exact contribution of heavily obscured AGN to the infrared-excess galaxy population remains an open issue (e.g. Alexander et al. 2011). Several MIR-based AGN selection techniques have been developed with data from the Spitzer Space Telescope Infrared Array Camera (IRAC; Fazio et al. 2004) using colours and power-law selection (Lacy et al. 2004; Stern et al. 2005; Alonso-Herrero et al. 2006; Donley et al. 2008, 2012). These techniques are very effective and reliable. Galaxies dominated by AGN emission typically exhibit a characteristic red power-law spectral energy distribution (SED) in the MIR ( with 0.5; Alonso-Herrero et al. 2006). Thus, MIR power-law selection provides the cleanest samples of luminous AGN (e.g. Donley et al. 2008). However, this technique is very sensitive to the reliability of the estimated photometric errors (Donley et al., 2012).
The Wide-field Infrared Survey Explorer (WISE) has now completed the first sensitive (100-1000 deeper than IRAS) coverage of the entire sky in the MIR111https://ceres.ipac.caltech.edu/(Wright et al., 2010). Several colour-based regions, aimed at identifying luminous AGN, have already been proposed. These works have shown that can robustly separate AGN from normal galaxies and stars (e.g. Assef et al. 2010; Jarrett et al. 2011; Stern et al. 2012). will be extremely efficient in identifying the rare highly luminous AGN up to the crucial epoch when the accretion power of the Universe peaked (1-2). The all-sky survey will complement the deep Spitzer surveys, aimed to characterize the accretion phenomenon in the distant Universe.
This paper presents a highly reliable and complete MIR-based colour selection of AGN with WISE. Our technique is designed to select objects with red MIR power-law SEDs and properly accounts for the estimated typical errors in the photometry and deviations of the MIR SEDs from a pure power-law. The AGN wedge is defined using the wide-angle Bright Ultra-hard XMM-Newton Survey (BUXS; Mateos et al. 2012c, in preparation). This survey is one of the largest complete flux-limited samples of bright “ultra-hard” (4.5-10 keV) X-ray selected AGN to date. Surveys such as BUXS are extremely efficient in selecting AGN bright enough for reliable optical identifications and for detailed studies of their properties and evolution (e.g. HBS28, Caccianiga et al. 2004; HBSS, Della Ceca et al. 2008). BUXS covers the region of the AGN redshift-luminosity parameter space that will sample. Thus, BUXS offers a unique opportunity to define a highly complete and reliable MIR-based AGN selection with WISE. Thanks to the optical spectroscopic identifications available for 97% of the BUXS objects, and the high quality X-ray spectra, we have maximized the completeness of our MIR selection without compromising its reliability. In a forthcoming paper we will present and discuss the main properties of the optical/near-IR/MIR SEDs of the AGN in BUXS (Mateos et al. 2012c, in preparation).
This paper is organized as follows. Sections 2 and 3 briefly summarize the data sets. In Section 4 we present our MIR selection of AGN candidates using the three shorter wavelength bands of and the complete four bands, respectively and we discuss the completeness of the selection. We show the reliability of our AGN selection in Section 5. The results are summarized in Section 6. Throughout this paper errors are 90% confidence for a single parameter and we assume , and .
2 The Infrared Survey
observed the entire sky in the MIR, achieving 5 point source sensitivities better than 0.08, 0.11, 1, and 6 mJy at 3.4, 4.6, 12, and 22 m, respectively. The angular resolution is 6.1, 6.4, 6.5, and 12.0(FWHM), respectively, and the astrometric precision for high signal-to-noise (hereafter SNR) sources is better than 0.15(Wright et al. 2010). We use here the March 2012 publicly available All-Sky Data Release that covers 99% of the sky and incorporates the best available calibrations and data reduction algorithms (Cutri et al. 2012).
In what follows we compute flux densities in the bands using profile fitting photometry and the magnitude zero points of the Vega system: =309.124 Jy, 171.641 Jy, 30.988 Jy, and 8.346 Jy for 3.4, 4.6, 12, and 22 m, respectively. These values are computed with the flux correction factors that correspond to a power-law spectrum () with spectral index =1 presented in Wright et al. (2010). We note that using the flux correction factors that correspond to constant power-law spectra the difference in the computed flux densities would be less than 0.2% at 3.4, 4.6, and 22 m and 2% at 12 m. We added a 1.5% uncertainty to the catalogued flux errors in all bands to account for the overall systematic uncertainty from the Vega spectrum in the flux zeropoints. To account for the existing discrepancy between the red and blue calibrators used for the conversion from magnitudes to Janskys, an additional 10% uncertainty was added to the 12m and 22m fluxes (Wright et al. 2010). Throughout this paper we use monochromatic MIR flux densities () in Janskys, unless otherwise specified.
 |
 |
3 The Bright Ultra-hard XMM-Newton Survey
BUXS is one of the largest, amongst the existing XMM-Newton and Chandra surveys, complete flux-limited samples of bright () “ultra-hard” (4.5-10 keV) X-ray selected sources to date. BUXS is based on a subset of 381 high Galactic latitude () observations from the second XMM-Newton serendipitous source catalogue (2XMM; Watson et al. 2009). The sample is drawn from EPIC-pn observations with clean exposure times 10 ks and having good quality for serendipitous source detection (i.e. free of bright and/or extended X-ray sources). These observations were used to derive extragalactic source count distributions at intermediate fluxes, and therefore we have a good knowledge of the survey completeness (Mateos et al., 2008). The total sky area of BUXS is 44.43 deg2.
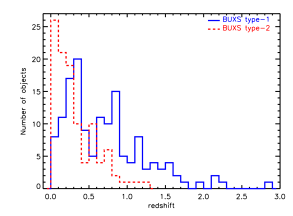
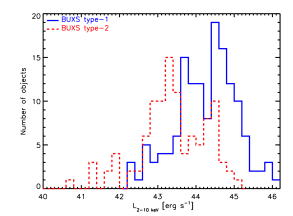
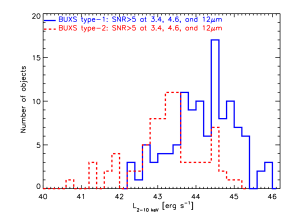
The selection of sources in the 4.5-10 keV energy band was motivated by the need to reduce the strong bias against heavily absorbed AGN affecting surveys conducted at softer energies. The BUXS bright flux limit was intended to include only objects for which a reliable classification and redshift could be derived from optical spectroscopy. This also ensures that we can derive accurate X-ray properties such as absorption and intrinsic luminosities from high-quality X-ray spectra ( few hundred counts). In this way we remove uncertainties associated with photometric redshifts and poor X-ray data quality ( a hundred counts). BUXS contains 258 sources after removal of Galactic stars (2%) and known BL Lacs (1%). Optical spectroscopic identifications have been obtained from the Sloan Digital Sky Survey (Abazajian, 2009), the literature, and our ongoing follow-up campaign. At the time of writing, the spectroscopic identification completeness is 97.3%. Of the 258 BUXS sources, 145 objects (56.2%) are identified as type-1 AGN (UV/optical emission line velocity widths 1500 ) and 106 (41.1%) as type-2 AGN (UV/optical emission line velocity widths 1500 or no emission lines). Seven sources (2.7%) remain unidentified. BUXS covers four decades in X-ray luminosity (), where the luminosities are computed in the ‘standard’ 2-10 keV rest-frame energy band and are corrected for intrinsic absorption. BUXS identifies sources out to 2. Type-1 and type-2 AGN have mean 2-10 keV luminosities of and , and mean redshifts of 0.7 and 0.3, respectively. Redshift and luminosity distributions are shown in Fig. 1. We note that BUXS samples absorbed AGN in the Compton-thin regime (rest-frame intrinsic absorption ).
To find the MIR counterparts of the sources in BUXS we used the cross-matching algorithm of Pineau et al. (2011). The algorithm, which is based on the classical likelihood ratio, computes the probability of a spatial coincidence of the X-ray sources with their MIR candidate counterparts. MIR counterparts were found for 255 out of 258 (98.8%) sources (detection with SNR5 in at least one of the bands). The mean X-ray–MIR separation is 2 arcsec. The three objects without detection in the MIR are type-1 AGN with 0.6-0.8. For one of these sources a blend of two objects prevents us from identifying a unique MIR counterpart. For the other two sources, the expected MIR fluxes, from analysis of their optical/near-IR SEDs, suggest that they are too faint to be detected with WISE.
In order to assess the completeness of our MIR selection technique with respect to the overall AGN population we built a clean AGN parent sample by extracting all catalogued sources in the BUXS survey area, and we identified the objects detected in the 2-10 keV band again using the cross-matching algorithm of Pineau et al. (2011). Here we assume that a detection in hard X-rays is a good tracer of unabsorbed and mildly absorbed AGN activity. We used the 2-10 keV source lists from Mateos et al. (2008) that were derived with the source detection pipeline used in the 2XMM catalogue. The total number of objects in the BUXS area detected in the 2-10 keV X-ray band is 10265. The faintest sources have 2-10 keV fluxes of .
We estimate a fraction of spurious matches of X-ray and MIR sources of 1% from the cross-matching of X-ray and sources using a large offset in MIR coordinates (3 arcmin in either RA or dec).
| MIR wedge | ||||
|---|---|---|---|---|
| (1) | (2) | (3) | (4) | (5) |
| 3-band | 25206 | 1659 (6.6) | 2755 | 1062 (38.5) |
| 4-band | 2476 | 409 (16.5) | 516 | 245 (47.5) |
Column 1: MIR AGN selection wedge identifier; Column 2: number of catalogued sources in the BUXS survey area with significance of detection 5 in the relevant bands; Column 3: number (fraction) of sources with an X-ray detection in the 2-10 keV band; Column 4: number of sources in AGN wedge; Column 5: number (fraction) of sources in AGN wedge and detected in X-rays.
| MIR wedge | Opt. class | ||
|---|---|---|---|
| (1) | (2) | (3) | (4) |
| 3-band | Type-1 | 114 | 105 |
| Type-2 | 81 | 38 | |
| No ID | 4 | 3 | |
| 4-band | Type-1 | 63 | 55 |
| Type-2 | 55 | 21 | |
| No ID | 2 | 1 |
Column 1: MIR AGN selection wedge identifier; Column 2: Optical class; Column 3: number of sources that are used to define the AGN wedge; Column 4: number of objects in AGN wedge.
 |
 |
4 selection of AGN candidates in the BUXS fields
To avoid spurious detections and objects with poorly constrained photometry, in what follows we restrict ourselves to sources detected with SNR5 in all relevant bands (3.4, 4.6, and 12m in Sec. 4.1; 3.4, 4.6, 12, and 22m in Sec. 4.2).
4.1 three-band AGN wedge
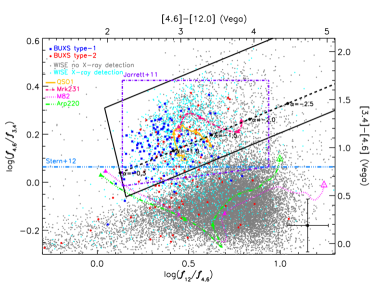
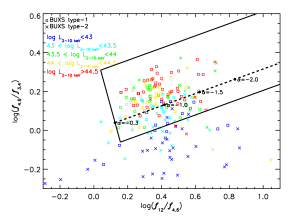
In the BUXS survey area there are 25206 sources detected with SNR5 in the three shorter wavelength bands of WISE, of which 1659 have X-ray detections (see Table 1). Out of the latter, 114 are associated with BUXS type-1 AGN and 81 with BUXS type-2 AGN (see Table 2). Fig. 2 shows the MIR log() vs. log() diagram for objects with and without an X-ray counterpart as small cyan and grey symbols, respectively. We also marked with large blue and red symbols spectroscopically classified type-1 and type-2 AGN in the BUXS survey. The dashed line illustrates the MIR power-law locus and the values for different spectral indices. Most BUXS objects, especially type-1 AGN, are clustered near the power-law locus, in a region in the MIR colour-colour plane well separated from the stellar locus (colours near zero magnitude) and the horizontal sequence of normal galaxies (lower right part of the diagram). Furthermore, AGN have, on average, redder log() colours than a pure power-law. This suggests some curvature in the observed 3.4m to 12m SEDs (e.g. Elvis et al. 1994; Richards et al. 2006; Assef et al. 2010).
 |
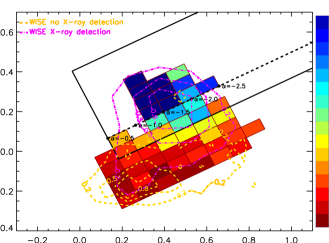 |
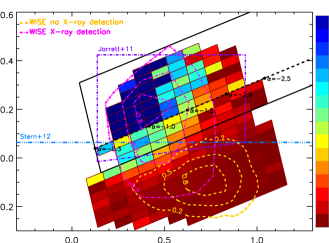
Fig. 2 (bottom) shows the fraction of sources detected in X-rays across the colour-colour diagram and the distribution of objects with and without detection in X-rays (contours). There is a clear separation between these distributions. The bulk of the MIR population not detected in X-rays overlaps with the horizontal sequence of normal galaxies, while the great majority of X-ray detected objects cluster near the power-law locus.
Our MIR-based AGN selection technique is designed to identify objects with red MIR power-law SEDs. The AGN wedge is defined to include all objects with MIR colours expected for power-law SEDs with spectral index 0.3, properly accounting for the typical errors in the photometry at the faintest MIR fluxes (error bars in Fig. 2, top). We then increase the size of the wedge towards red log() colours (upper boundary) to include all BUXS AGN and the X-ray detected objects throughout the BUXS survey area with such colours. In this way we account for deviations of the 3.4m to 12m SEDs from a pure power-law. Our three-band AGN wedge is shown with the thick solid box in Fig. 2. The MIR power-law locus is defined by
| (1) |
where and . The top and bottom boundaries of the wedge are obtained by adding y-axis intercepts of +0.297 and 0.110, respectively. The MIR power-law =0.3 bottom-left limit corresponds to
| (2) |
These are the limits we have used throughout this paper. However, for most practical purposes using instead a bottom-left vertical limit, corresponding to 0.120, produces very similar results.
In Vega magnitudes (in the source catalogue magnitudes are reported in the Vega system), the AGN locus is defined by
| (3) |
where ’ and ’. The top and bottom boundaries of the wedge are obtained by adding y-axis intercepts of +0.796 and 0.222, respectively. In this case, the MIR power-law =0.3 bottom-left limit corresponds to
| (4) |
The bottom-left vertical limit of the AGN wedge in magnitudes
corresponds to ’2.157.
Our three-band AGN wedge identifies 2755 AGN candidates in the BUXS area, of which 1062 (38.5%) are detected in X-rays (see Table 1). Out of the latter, 105 are associated with BUXS type-1 AGN and 38 with BUXS type-2 AGN (see Table 2). We note that the X-ray detection fraction in the wedge increases with the depth of the X-ray observations as shown in Table 3. For example, in the BUXS area where the X-ray observations have exposures 40 ks, the X-ray detection fraction rises to 49.8%. For comparison, in the 1Ms CDF-S survey the X-ray detection fraction of IRAC power-law AGN candidates was 50% (Alonso-Herrero et al., 2006) while this fraction increased to 85% in the deeper 2Ms CDF-N survey (Donley et al., 2007). Furthermore, Donley et al. (2012) found that the X-ray detection fraction of IRAC MIR AGN candidates in COSMOS increased from 38% to 52% in the regions of deep Chandra coverage (X-ray exposures 50-160 ks). This is as expected, as long X-ray exposures are required to detect intrinsically less luminous and/or heavily obscured AGN (see e.g. Mateos et al. 2005; Tozzi et al. 2006; Comastri et al. 2011; Brightman et al. 2012). Still, a substantial fraction of our MIR AGN candidates are undetected at 2-10 keV energies with the typical exposures in the 2XMM catalogue. These objects that have the reddest overall log() colours in the AGN wedge, are the best candidates to account for the most heavily obscured/absorbed luminous AGN missed by hard X-ray surveys. Lacy et al. (2007) presented the optical spectroscopic followup of a sample of luminous AGN candidates selected on the basis of their IRAC MIR colours. They confirmed the AGN nature of 91% of the sources, with the majority of the objects being identified as dust-reddened type-1 quasars and type-2 AGN. Furthermore, a detailed study of the MIR SEDs of [OIII]5007Å-selected QSO2s (Reyes et al., 2008) strongly supports our hypothesis that many of the X-ray undetected sources in the wedge are heavily-obscured very-luminous AGN (Mateos et al. 2012b, in prep.).
| (1) | (2) | (3) |
|---|---|---|
| 1020 | 1225 | 400 (32.7%) |
| 2030 | 723 | 298 (41.2%) |
| 3040 | 347 | 135 (38.9%) |
| 4050 | 210 | 110 (52.4%) |
| 50 | 250 | 119 (47.6%) |
| Total | 2755 | 1062 (38.5) |
Column 1: EPIC-pn exposure time interval of the X-ray observations in units of ks; Column 2: number of catalogued sources in AGN wedge with significance of detection 5 in the three shorter wavelength bands of . Column 3: number (fraction) of sources in AGN wedge with an X-ray detection in the 2-10 keV band.
4.2 four-band AGN wedge
Due to the significantly shallower depth at 22m compared with the first three bands, a selection that uses the 22m survey will be restricted by necessity to the brightest MIR objects. We have investigated, however, whether we can gain any additional information on AGN selection by using the complete four bands. The number of MIR sources detected with SNR5 in all four bands in the area of BUXS is 2476, of which 409 are detected in X-rays. Out of the latter, 63 are associated with BUXS type-1 AGN and 55 with BUXS type-2 AGN (see Tables 1 and 2). Fig. 3 (top) shows the distribution of log() vs. log() colours. The solid lines illustrate the four-band AGN selection wedge as in Sec. 4.1. In this case we increase the size of the wedge that would be required to account for the typical photometric errors (error bars in Fig. 3) towards both redder log() and log() colours. In this way we increase the completeness of the selection without compromising the reliability. The MIR power-law locus is defined by
| (5) |
where and . The top and bottom boundaries of the wedge are obtained by adding y-axis intercepts of +0.421 and 0.130, respectively. In this case we use a MIR power-law bottom-left limit of =0.5 that corresponds to
| (6) |
These are the limits we have used in Sec. 4.3. Using instead a bottom-left vertical limit, corresponding to 0.13, produces very similar results.
In Vega magnitudes the AGN locus is defined by
| (7) |
where ’ and ’. The top and bottom boundaries of the wedge are obtained by adding y-axis intercepts of +0.979 and 0.405, respectively. In this case, the MIR power-law =0.5 bottom-left limit corresponds to
| (8) |
The bottom-left vertical limit of the AGN wedge in magnitudes
corresponds to ’1.76.
Our four-band AGN wedge identifies 516 AGN candidates in the BUXS area detected with SNR5 in all four bands, of which 245 (47.5%) are detected in X-rays. Out of the latter, 55 are associated with BUXS type-1 AGN and 21 with BUXS type-2 AGN (see Table 2).
 |
 |
4.3 AGN selection completeness
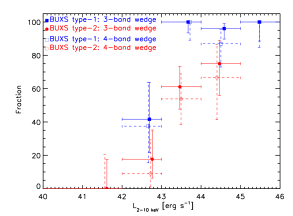
Fig. 4 (top) and Table 4 show the fraction of BUXS AGN that meet our three-band MIR colour cuts as a function of their intrinsic 2-10 keV luminosity (filled symbols). The symbols indicate the mean luminosity of the sources in the bin. Rest-frame luminosities were derived from a detailed X-ray spectroscopic analysis and are corrected for Galactic and any intrinsic absorption. The completeness of our selection criteria is a strong function of luminosity for both type-1 and type-2 AGN. This result reflects the fact that objects with MIR colours not dominated by the thermal emission from the AGN will be missed by our selection. This effect is more important for low-luminosity AGN, especially if these sources are affected by large dust extinction at the shortest wavelengths of WISE. In these objects the starlight from the host galaxy will dominate their MIR emission. Thus, it should be emphasized that the comparison of an MIR colour selection completeness for different classes of objects is only meaningful if the objects span the same range of luminosities. Taking this into account, at , and of the type-1 and type-2 AGN, respectively meet the selection. At the MIR selection efficiency increases to and for type-1 and type-2 AGN, respectively. We estimated the most probable value for these fractions using a Bayesian approach and the binomial distribution from Wall & Jenkins (2008). The quoted errors are the narrowest interval that includes the mode and encompasses 90% of the probability (S. Andreon, private communication). It is important to note that the significantly smaller value of the selection completeness obtained for type-2 AGN at compared to that for type-1 AGN is mainly due, as indicated above, to the different luminosity distributions of the two classes of AGN. The type-2 AGN population in BUXS is dominated by objects with (79% vs. 39% for type-1 AGN; see Fig. 4 bottom). At such luminosities many AGN have relatively blue colours at the shortest wavelengths (i.e. host-dominated) and thus lie outside the MIR AGN wedge. We expect this effect to be more important for type-2 AGN, as this class of objects is expected to show a higher degree of extinction at the shortest wavelengths of WISE. For example, the clumpy torus models of Nenkova et al. (2008) predict nearly isotropic emission at wavelengths 12m. This could explain that even if we use the same luminosity range (as in Fig. 4) we obtain a selection completeness that is, within the uncertainties, still marginally lower for type-2 AGN than for type-1 AGN. This result still holds at luminosities , where the relative contribution of the host galaxy to the MIR emission should be small. However, as the number of type-2 AGN in BUXS at such luminosities is small (16 objects), the difference could be due in part to small number statistics. Thus, we conclude that our 3-band AGN wedge is highly complete for both X-ray selected luminous type-1 and type-2 AGN.
| (1) | (2) | (3) | (4) | (5) |
|---|---|---|---|---|
| [4042] | - | - | 11 | |
| [4243] | 12 | 17 | ||
| [4344] | 33 | 36 | ||
| [4445] | 51 | 16 | ||
| [4546] | 18 | 1 | - | |
| Total | 114 | 81 |
Column 1: X-ray luminosity range in units of (logarithmic units, 2-10 keV in rest-frame and corrected for any intrinsic absorption); Column 2: number of BUXS type-1 AGN in luminosity bin; Column 3: fraction of BUXS type-1 AGN in the 3-band AGN wedge; Column 4: number of BUXS type-2 AGN in luminosity bin; Column 5: fraction of BUXS type-2 AGN in the 3-band AGN wedge.
| (1) | (2) | (3) | (4) | (5) |
| [4042] | - | - | 9 | |
| [4243] | 8 | 11 | ||
| [4344] | 19 | 26 | ||
| [4445] | 23 | 9 | ||
| [4546] | 13 | - | - | |
| Total | 63 | 55 |
Column 1: X-ray luminosity range in units of (logarithmic units, 2-10 keV in rest-frame and corrected for any intrinsic absorption); Column 2: number of BUXS type-1 AGN in luminosity bin; Column 3: fraction of BUXS type-1 AGN in the 4-band AGN wedge; Column 4: number of BUXS type-2 AGN in luminosity bin; Column 5: fraction of BUXS type-2 AGN in the 4-band AGN wedge.
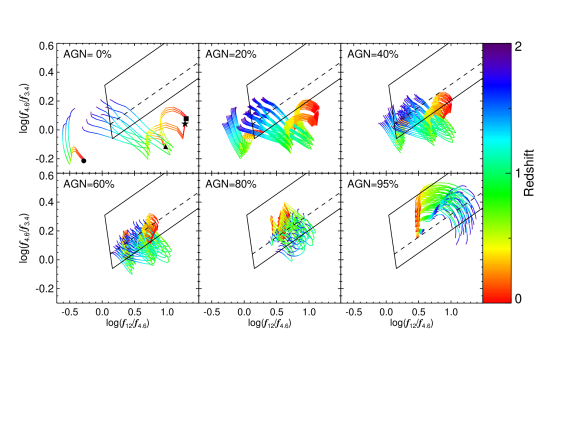 |
Fig. 4 (top) and Table 5 show the fraction of BUXS AGN that meet our four-band colour cuts as a function of their intrinsic 2-10 keV luminosity (open symbols). The completeness of the four-band wedge is somewhat smaller but comparable, within the uncertainties, to that achieved with the three-band selection for both type-1 and type-2 AGN. Indeed, 76 out of the 118 BUXS AGN detected in the four bands meet the four-band selection, while this number increases to 88 if the three-band selection is used instead. All the 15 three-band selected BUXS AGN that miss the four-band selection have log() colours significantly redder than those expected for a pure power-law SED. These objects lie outside the four-band AGN wedge, in the region of the colour-colour plane occupied by normal star-forming galaxies. They likely miss the four-band selection because their 22m emission comes from both AGN activity and intense star formation. On the other hand, only three BUXS AGN from the four-band selection lie outside the three-band wedge. We note that we obtain the same result if we include all BUXS AGN with a lower significance of detection at 22m (open symbols and arrows in Fig. 3, top). Therefore, by requiring 22m detections we are not biased against AGN with pure power-law SEDs (i.e. the faintest objects at 22m). Thus, by including the 22m band to select AGN candidates neither the completeness nor the reliability of the selection improves.
We have checked that using non-contiguous bands to define the MIR colours does not increase the completeness of a three-band or a four-band selection.
5 Reliability of the three-band AGN wedge
In the following we restrict ourselves to the three-band AGN wedge which, as shown in the previous section, provides the most complete selection of AGN candidates in the BUXS fields with WISE.
5.1 Comparison with templates
A known limitation of MIR selection techniques is the contamination from galaxies without AGN activity where the major contributor to the MIR emission is the stellar population or strong star formation (e.g. Lacy et al. 2004; Stern et al. 2005; Jarrett et al. 2011; Donley et al. 2012; Stern et al. 2012). To assess the reliability of our three-band AGN wedge we show in Fig. 5 the expected colours of AGN with varying host-galaxy contributions following Donley et al. (2012). The composite SEDs were constructed using the library of Polletta et al. (2008) and the normal star-forming spiral galaxy template from Dale at al. (2002). The solid and dashed lines illustrate the AGN wedge along with the power-law locus, respectively. We also applied additional extinctions of =0-2 and =0-20 to the star-forming and AGN components, respectively, using the Draine et al. (2003) extinction curve. The colour tracks of pure star-forming galaxies would enter our selection wedge at 1.3. At such redshifts, however, most galaxies are too faint to be detected at the relatively shallow flux density limits (Wright et al. 2010; Jarrett et al. 2011). Indeed, in the region of the AGN wedge where we would expect contamination from normal star-forming galaxies, there is no clear excess of MIR X-ray undetected sources and the X-ray detection fraction remains high (see Fig. 2). Thus it seems that at the adopted SNR5 limit our AGN selection suffers from minimal contamination from high redshift pure star-forming galaxies. It is interesting to note that an important fraction of the X-ray detected sources has log( colours bluer than those expected for a pure AGN SED. The colour tracks of composite galaxies suggest that this is most likely due to both AGN and their host galaxies contributing to the observed emission in the bands. On the other hand, we find a sharp decrease in the X-ray detection fraction of objects at log(0.7-0.8. At such red MIR colours we expect many objects to be heavily obscured AGN. However, the colour tracks of pure AGN indicate that there is a strong dependence of the observed log( colour with redshift. This suggests that the population of objects with log(0.7-0.8 could be a mixture of heavily absorbed AGN and objects at high redshifts (1-1.5).
| MIR wedge | ||
|---|---|---|
| (1) | (2) | (3) |
| Mateos 3-band | 2755 | 1062 (38.5%) |
| Jarrett+11 | 3301 | 1102 (33.4%) |
| Stern+12 | 3946 | 1254 (31.8%) |
Column 1: MIR AGN selection criteria; Column 2: number of catalogued AGN candidates in the BUXS survey area. For the Jarrett et al. (2011) wedge we selected only MIR objects with significance of detection 5 in the three shorter wavelength bands of as in our analysis. The Stern et al. (2012) selection only requires an MIR detection at 4.6 m, brighter than 160 Jy (see Sec. 5.2 for details). Column 3: number (fraction) of sources in AGN wedge with an X-ray detection in the 2-10 keV band.
5.2 Comparison with other selection techniques
Within the BUXS survey area our three-band MIR colour selection identifies 2755 AGN candidates, of which 1062 sources (38.5%) are detected in X-rays. For comparison, the X-ray detection fraction of objects that meet the Jarrett et al. (2011) colour-based AGN selection (indicated in Fig. 2) is 33.4% (see Table 6). At red MIR colours their selection enters the sequence of low redshift normal galaxies increasing the expected number of contaminants.
Stern et al. (2012) proposed an AGN selection using a [3.4][4.6] colour cut ([3.4][4.6]0.8 or log() and a 4.6m flux threshold of 160Jy. Their argument was that the inclusion of the longer wavelength data would increase the reliability of the AGN selection but at the cost of reducing the completeness. Fig. 2 and Fig. 5 show that the [3.4]-[4.6] colour cut proposed by Stern et al. (2012) also enters the locus of low redshift normal galaxies at red log( colours. This could reduce the reliability of their selection as suggested by the lower X-ray detection fraction of sources in the BUXS area that meet their criteria (31.8%; see Table 6). On the other hand, using the deep (60-160 ks) Chandra data available in the COSMOS field, Stern et al. (2012) find that 87% of of their AGN candidates are detected at X-ray energies, suggesting minimal contamination from normal galaxies.
The XMM-Newton pointings used to build BUXS span a broad range of ecliptic latitudes and thus the depth of the survey varies across the BUXS fields. The Stern et al. (2012) AGN selection was defined using the COSMOS field located at low ecliptic latitude and thus, the MIR data are close to the minimum depth of the survey. At such shallow depths and using the Stern et al. (2012) 160Jy flux threshold at 4.6m, many of the star-forming contaminants will be too faint to be detected, thereby increasing the reliability of the Stern et al. (2012) selection. Although BUXS likely samples fainter objects than those best targeted at the shallow depth of WISE, we find that 98% of the AGN have MIR detections with SNR5 at 3.4m and 4.6m. This fraction only decreases to 77% if we require 12m detections with SNR5. In conclusion, over the range of MIR depths of the survey in the BUXS fields, our proposed selection suffers less contamination from star-forming galaxies than provided by a simple [3.4][4.6] color cut, while only marginally reducing completeness.
We have investigated the impact of increasing the MIR significance of detection of the AGN candidates. If we require 3.4m and 4.6m detections with SNR10, 44% of our MIR AGN candidates with log()0.6 will be missed (21% of the objects with an X-ray detection), while this fraction is only 0.7% at log()0.6 (and zero for objects with an X-ray detection). Therefore, the effect of increasing the threshold in SNR of the detections is that the resulting MIR selection becomes increasingly similar to a hard X-ray selection. By using SNR5 sources, we gain in the identification of AGN candidates with the reddest MIR colours, while we do not reduce the reliability.
It is clear that our MIR colour selection is a good compromise between completeness and the crucial high reliability required to obtain a clean sample of powerful AGN at the different depths of the survey. Furthermore, going down to detections with SNR5, we reach a much higher efficiency of detection of the AGN population in the reddest MIR colours, many of which could be heavily obscured/extincted AGN.
 |
5.3 Trends in the wedge with the AGN luminosity
In the previous sections we presented the expected colours for AGN/star-forming galaxies derived from a library of templates. Here we investigate in more detail the colour trends in the three-band AGN wedge for the BUXS type-1 and type-2 AGN. Fig. 6 shows the MIR colours of the AGN in BUXS as a function of their X-ray luminosity. As expected, there is a strong dependence of log() on the X-ray luminosity, with less luminous sources having the bluest MIR colours. For less powerful AGN the host galaxy can substantially contribute to the MIR emission (e.g. Buchanan et al. 2006; Alonso-Herrero et al. 2008). Host galaxy dilution is expected to be more important in type-2 AGN, especially at low luminosities, as type-2 AGN should show a higher degree of extinction at the shortest wavelengths of WISE. These objects, with MIR colours consistent with normal galaxies, lie outside of the AGN wedge and thus, they are missed from a pure MIR selection. Fig. 2 and Fig. 6 both show that most AGN in BUXS missed by the 3-band wedge are type-2 AGN. As noted in Sec. 4.3, in flux-limited X-ray surveys, such as BUXS, type-2 AGN are overall intrinsically less luminous than type-1 AGN (see Fig. 1, bottom). Thus, due to the strong dependence of the MIR selection completeness on the luminosity of the objects (see Fig. 4, top), our AGN wedge will preferentially pick out BUXS type-1 AGN. However, at luminosities , where the AGN is expected to dominate the MIR emission (unless it is heavily absorbed), the completeness of the selection of type-1 and type-2 AGN is comparable within the uncertainties. At such luminosities both type-1 and type-2 AGN are preferentially located above the power-law locus (see also Fig. 5). This indicates that the observed 3.4m to 12m MIR SEDs of powerful AGN deviate from a pure power-law.
We do not find a strong dependence of the log() colour on the X-ray luminosity. However, we find a large scatter in the distribution of log() colours, especially for objects at low luminosities, where the host galaxy significantly contributes to the MIR emission. A broad range of log() colours is expected for AGN with an important host galaxy contribution as the very wide 12m filter of is very sensitive to both prominent PAH emission features and silicate absorption (10m) in star-forming galaxies over a broad range of redshifts.
6 SUMMARY
We present a MIR power-law based selection of luminous AGN candidates
using the 3.4, 4.6, and 12 m bands of the survey. We defined
an AGN wedge in the log()
vs. log() colour-colour
diagram using the Bright Ultra-Hard XMM-Newton Survey
(BUXS). This is one of the largest complete flux-limited
samples of bright () “ultra-hard” (4.5-10 keV) X-ray selected AGN to
date. BUXS includes 258 objects detected over a total sky area of
44.43 deg2: 251 (97.3%) are spectroscopically identified and
classified, with 145 being type-1 AGN and 106 type-2 AGN. Our
technique is based on a MIR power-law selection and properly accounts
for the errors in the photometry and deviations of the MIR spectral
energy distributions from a pure power-law. In flux-limited X-ray
surveys, such as BUXS, type-2 AGN are intrinsically less
luminous than type-1 AGN. Thus, due to the strong dependence of the
MIR selection completeness on the luminosity of the objects, a MIR AGN
wedge necessarily picks out BUXS type-1 AGN. However, at 2-10 keV
luminosities above the completeness of our MIR
selection of type-1 and type-2 AGN is high and comparable for both
types within the uncertainties. Our selection is highly complete at
luminosities where our MIR
wedge recovers 97% and 77% of the BUXS type-1 and
type-2 AGN, respectively. We identify 2755 AGN candidates in the 44.43
deg2 BUXS survey area of which 38.5% have detection in X-rays. In
the BUXS area where the X-ray observations have exposures 40 ks,
the X-ray detection fraction rises to 49.8%. This is reasonable, as
long X-ray exposures are required to detect intrinsically less
luminous and/or heavily obscured AGN. A substantial fraction of the
MIR AGN candidates remain undetected at 2-10 keV energies with the
typical exposures in the 2XMM catalogue. These objects are the
best candidates to account for the most heavily obscured/absorbed
luminous AGN missed by hard X-ray surveys. Assuming that a 2-10 keV
X-ray detection is a good tracer of AGN activity we demonstrate that
our selection shows one of the highest reliability amongst those
in the literature. This is crucial to obtain a clean MIR selection
of powerful AGN. Furthermore, going down to a SNR5 limit in the
flux densities, we substantially increase the efficiency of
detection of AGN with the reddest MIR colours. We also investigate a
four-band AGN selection. We show, however, that by including the
22m band neither the completeness nor the reliability of the
selection improves. This is likely due to both the significantly
shallower depth at 22m compared with the first three bands of and star-formation contributing to the 22m emission at the 22m sensitivity.
Acknowledgments
This work is based on observations obtained with XMM-Newton, an ESA science mission with instruments and contributions directly funded by ESA Member States and NASA. Based on data from the Wide-field Infrared Survey Explorer, which is a joint project of the University of California, Los Angeles, and the Jet Propulsion Laboratory/California Institute of Technology, funded by the National Aeronautics and Space Administration. Funding for the SDSS and SDSS-II has been provided by the Alfred P. Sloan Foundation, the Participating Institutions, the National Science Foundation, the U.S. Department of Energy, the National Aeronautics and Space Administration, the Japanese Monbukagakusho, the Max Planck Society, and the Higher Education Funding Council for England. The SDSS Web Site is http://www.sdss.org/. Based on observations collected at the European Organisation for Astronomical Research in the Southern Hemisphere, Chile, programme IDs 084.A-0828, 086.A-0612, 087.A-0447. Based on observations made with the William Herschel Telescope -operated by the Isaac Newton Group-, the Telescopio Nazionale Galileo -operated by the Centro Galileo Galilei and the Gran Telescopio de Canarias installed in the Spanish Observatorio del Roque de los Muchachos of the Instituto de Astrofísica de Canarias, in the island of La Palma. SM, FJC and XB acknowledge financial support by the Spanish Ministry of Economy and Competitiveness through grant AYA2010-21490-C02-01. A.A.-H. acknowledges support from the Universidad de Cantabria through the Augusto G. Linares program. A.B. acknowledges a Royal Society Wolfson Research Merit Award. J.L.D. acknowledges support from the LANL Director’s Fellowship. P.S. acknowledges financial support from ASI (grant No. I/009/10/0). The authors wish to thank the anonymous referee for constructive comments.
References
- Abazajian (2009) Abazajian, K. N., Adelman-McCarthy, J. K., Agüeros, M. A., et al. 2009, ApJS, 182, 543
- Alexander et al. (2011) Alexander D.M., Bauer F.E., et al. 2011, ApJ, 738, 44A
- Alonso-Herrero et al. (2006) Alonso-Herrero A., Pérez-González P. G., Alexander D. M., et al. 2006, ApJ, 640, 167
- Alonso-Herrero et al. (2008) Alonso-Herrero A., Pérez-González P. G., Rieke G.H., et al. 2008, ApJ, 677, 127
- Assef et al. (2010) Assef R. J., Kochanek C. S., et al. 2010, ApJ, 713, 970
- Bird et al. (2007) Bird A.J., Malizia A., et al. 2007, ApJS, 170, 175
- Brightman et al. (2012) Brightman M., Ueda Y., et al. 2012, MNRAS, 423, 702
- Buchanan et al. (2006) Buchanan C. L., Gallimore J. F., et al. 2006, AJ, 132, 401
- Burlon et al. (2011) Burlon D., Ajello M., Greiner J., et al. 2011, ApJ, 728, 58
- Caccianiga et al. (2004) Caccianiga A., Severgnini P., et al. 2004, MNRAS, 416, 901
- Comastri et al. (2011) Comastri A., Ranalli P., Iwasawa K., et al. 2011, A&A, 526, 9
- Cutri et al. (2012) Cutri R. M., Wright E. L., Conrow T., et al. 2012, Explanatory Supplement to the WISE All-Sky Data Release Products
- Daddi at al. (2007) Daddi E., Alexander D.M., et al. 2007, ApJ, 670, 173
- Dale at al. (2002) Dale D. A. & Helou G. 2002, ApJ, 576, 159
- Della Ceca et al. (2008) Della Ceca R., Caccianiga A., et al. 2008, A&A, 487, 119
- Donley et al. (2007) Donley J. L., Rieke G.H., Pérez-González P.G., et al. 2007, ApJ, 660, 167
- Donley et al. (2008) Donley J. L., Rieke G.H., et al. 2008, ApJ, 687, 111
- Donley et al. (2012) Donley J. L., Koekemoer A.M., et al. 2012, ApJ, 748, 142
- Draine et al. (2003) Draine B.T. 2003, ARA&A, 41, 241
- Elvis et al. (1994) Elvis M., Wilkes B.J., McDowell J.C., et al. 1994, ApJS, 95, 1
- Fabian & Iwasawa (1999) Fabian A.C., Iwasawa K. 1999, MNRAS, 303, L34
- Fiore at al. (2009) Fiore F., Puccetti S., et al. 2008, ApJ, 693, 447
- Fiore at al. (2008) Fiore F., Grazian, A., et al. 2008, ApJ, 672, 94
- Fazio et al. (2004) Fazio G.G., Hora J.L., Allen L.E., et al. 2004, ApJS, 154, 39
- Georgantopoulos et al. (2008) Georgantopoulos I., Georgakakis A., et al. 2008, A&A, 484, 671
- Glikman et al. (2006) Glikman E., Helfand D.J., White R.L. 2006, ApJ, 640, 579
- Hernán-Caballero & Hatziminaoglou (2011) Hernán-Caballero A. & Hatziminaoglou E., 2011, MNRAS, 414, 500
- Jarrett et al. (2011) Jarrett T.H., Cohen M., Masci F., et al. 2011, ApJ, 735, 112
- Lacy et al. (2004) Lacy M., Storrie-Lombardi L.J., et al. 2004, ApJS, 154, 166
- Lacy et al. (2007) Lacy M., Petric A. O., Sajina A., et al. 2007, AJ, 133, 186
- Magorrian et al. (1998) Magorrian J., Tremaine S., et al. 1998, AJ, 115, 2285
- Mateos et al. (2005) Mateos S., Barcons X., Carrera F. J., et al. 2005, A&A, 444, 79
- Mateos et al. (2008) Mateos S., Warwick R. S., et al. 2008, A&A, 492, 51
- Matt (2002) Matt G. 2002, MNRAS, 337, 147
- Murphy & Yaqoob (2009) Murphy K.D. & Yaqoob T. 2009, MNRAS, 397, 1549
- Nenkova et al. (2008) Nenkova M., Sirocky M.M., et al. 2008, ApJ, 685, 160
- Pineau et al. (2011) Pineau F.-X., Motch C., Carrera F., et al. 2011, A&A, 527, A126
- Polletta et al. (2008) Polletta M., Weedman D., Hönig S., et al. 2008, ApJ, 675, 960
- Reyes et al. (2008) Reyes R., Zakamska N. L., Strauss M. A., et al. 2008, AJ, 136, 2373
- Richards et al. (2006) Richards G.T., Lacy M., Storrie-Lombardi L.J., et al. 2006, ApJS, 166, 470
- Severgnini et al. (2012) Severgnini P., Caccianiga A. & Della Ceca R. 2012, A&A, 542, 46
- Stern et al. (2005) Stern D., Eisenhardt P., Gorjian V., et al. 2005, ApJ, 631, 163
- Stern et al. (2012) Stern D., Assef R.J., Benford D.J., et al. 2012, ApJ, 753, 30
- Tozzi et al. (2006) Tozzi P., Gilli R., Mainieri V., et al. 2006, AJ, 451, 457
- Tueller et al. (2008) Tueller J., Mushotzky R.F., et al. 2008, AJ, 681, 113
- Wall & Jenkins (2008) Wall J.V. & Jenkins C.R., 2008, Practical Statistics for Astronomers, Cambridge University Press
- Watson et al. (2009) Watson M. G., Schröder A. C., et al. 2009, A&A, 493, 339
- Winter et al. (2009) Winter, L.M., Mushotzky R.F., et al. 2009, ApJ, 690, 1322
- Wright et al. (2010) Wright E. L., Eisenhardt P. R. M., Mainzer A. K., et al. 2010, AJ, 140, 1868
- Yaqoob et al. (2010) Yaqoob T., Murphy K.D., et al. 2010, MNRAS, 401, 411