SN 2002bu – Another SN 2008S-like Transient
Abstract
We observed SN 2002bu in the near-IR with the Hubble Space Telescope, the mid-IR with the Spitzer Space Telescope and in X-rays with Swift 10 years after the explosion. If the faint HST near-IR source at the transient position is the near-IR counterpart of SN 2002bu, then the source has dramatically faded between 2004 and 2012, from to . It is still heavily obscured, in graphitic dust models, with almost all the energy radiated in the mid-IR. The radius of the dust emission is increasing as and the optical depth is dropping as . The evolution expected for an expanding shell of material, , is ruled out at approximately while the to optical depth scaling for a shock passing through a pre-existing wind is consistent with the data. If the near-IR source is a chance superposition, the present day source can be moderately more luminous, significantly more obscured and evolving more slowly. While we failed to detect X-ray emission, the X-ray flux limits are consistent with the present day emissions being powered by an expanding shock wave. SN 2002bu is clearly a member of the SN 2008S class of transients, but continued monitoring of the evolution of the spectral energy distribution is needed to conclusively determine the nature of the transient.
Subject headings:
stars: evolution – stars: supergiants – supernovae:individual (SN 2002bu)1. Introduction
Supernova (SN) 2002bu was discovered on 2002 March 28 by Puckett & Gauthier (2002) in the galaxy NGC 4242, with a fairly low peak magnitude (Hornoch, 2002). The last pre-discovery observations on 2001 February 21 and March 14 placed a unfiltered magnitude limit at the location of the SN of 20.5 mag. A low resolution spectrum taken by Ayani et al. (2002) on April 1 showed a flat continuum and strong, narrow Balmer emission lines (FWHM 1100 km/s) that led to a Type IIn classification of the SN. The early (80 days post peak) light curve presented by Foley et al. (2007) and Smith et al. (2011) showed a plateau and a slower rise and decline as compared to other Type II SNe, with the color becoming redder with time.
Thompson et al. (2009) proposed that SN 2002bu may be a member of a new class of stellar transients, with the prototypes being SN 2008S (Arbour & Boles, 2008) and the 2008 optical transient (OT) in NGC 300 (Monard, 2008). The class is characterized by a transient–progenitor pair, where the transient is mag fainter than a regular core collapse SN (ccSN), with narrow emission lines and evidence of internal extinction in the spectrum, while the progenitor is a dust enshrouded, low luminosity (5) star with little variability in the years before the outburst (Prieto et al. 2008, Prieto 2008). In mid–IR color–magnitude diagrams (CMD), the progenitors occupy the extreme end of the asymptotic giant branch (AGB) sequence and the obscuring dust is graphitic rather than silicate (Prieto et al. 2009, Wesson et al. 2010). Thompson et al. (2009) further showed that these transients are relatively common among ccSNe (20%), but their progenitors are extremely rare ( of massive evolved stars), which implies that many massive stars go through this dust obscured phase shortly ( yrs) before the explosion. The rarity of the progenitor stars was further confirmed in the survey of additional galaxies by Khan et al. (2010).
Since the main characteristic of the new class is a dust enshrouded progenitor, it is impossible to unambiguously classify SN 2002bu as a member, as there are no pre–explosion IR observations of the region. However, Thompson et al. (2009) found a bright, red mid-IR source at the location of SN 2002bu in Spitzer Space Telescope (SST) data taken 2 years after the explosion, which indicates dust formation. This, together with the transient characteristics (low luminosity, dust and narrow emission lines visible in the spectrum), make SN 2002bu a likely member of the new class. In addition, Smith et al. (2011) analyzed 5 spectra taken between 11 and 81 days after discovery, and they show that the spectrum of SN 2002bu becomes redder with time and evolves from a spectrum resembling an LBV in outburst at early times, to one more similar to the spectra of SN 2008S and the NGC 300 OT 81 days later. The evolution of the H line from a Lorentzian profile to an asymmetric, blueshifted Gaussian profile, is suggestive of newly formed dust. In Kochanek et al. (2012) we argued that the early light curve also indicates dust formation, albeit with some ambiguities.
In Kochanek et al. (2012) we analyzed archival Hubble Space Telescope (HST) and SST data from approximately two years after the transient peak. As previously reported by Thompson et al. (2009), SN 2002bu was a luminous mid-IR source in 2004, but Kochanek et al. (2012) also found that it was invisible in archival HST data from 2005 in the BVRI bands to limits of mag. The spectral energy distribution (SED) in 2004 was well fit by surrounding a K, source with an optically thick () shell of dust located at a radius of approximately cm.
Broadly speaking, there are three possible explanations of the observations, as we discussed in our mid-IR survey of the “supernova impostors”(Kochanek et al. 2012). The first, “traditional”, view of these events is that a shell of material is ejected during the optical transient and forms dust once the ejected material becomes cool enough. As the shell expands, its optical depth drops as and the characteristic temperature drops as because the shell expands with the ejecta velocity . The dust radius at the time of the previous SST observations of SN 2002bu was consistent with a shell expanding at the velocity of km/s adopted by Smith et al. (2011). The second possibility is that the optical transient is a signal that the star is entering a high mass loss phase with a dense wind that forms dust and obscures the source. While the wind is steady, the optical depth is roughly constant with a dust temperature close to the dust destruction temperature K unless the wind becomes optically thick in the mid-IR. When the high mass loss phase ends, the evolution quickly resembles the first scenario (see Kochanek et al. 2012). The third scenario is the one introduced by Kochanek (2011) to explain SN 2008S and the NGC 300 OT. Here the progenitors are already shrouded by a very dense wind when an explosive transient occurs that destroys most of the dust to leave the transient little obscured at peak. The wind is so dense, however, that the dust reforms and re-obscures the transient. The present day luminosity is a combination of a surviving star (if any, nothing in the data requires one) and the luminosity generated by the shock propagating through the wind. At later times, the optical depth outside the shock is dropping as and, once the optical depth is low enough, the X-rays produced in the shock should be observable.
These scenarios make different predictions for the time evolution of the transient, so monitoring the evolution of SN 2002bu as a function of wavelength should reveal the nature of the event. Here we report near-IR HST, mid-IR SST and Swift X-ray observations of SN 2002bu taken roughly 10 years after the transient peak and 8 years after the the last HST and SST observations. Section 2 presents the new observational data. We discuss the results in Section 3, and consider their broader implications in Section 4.
2. Observations and Data Analysis
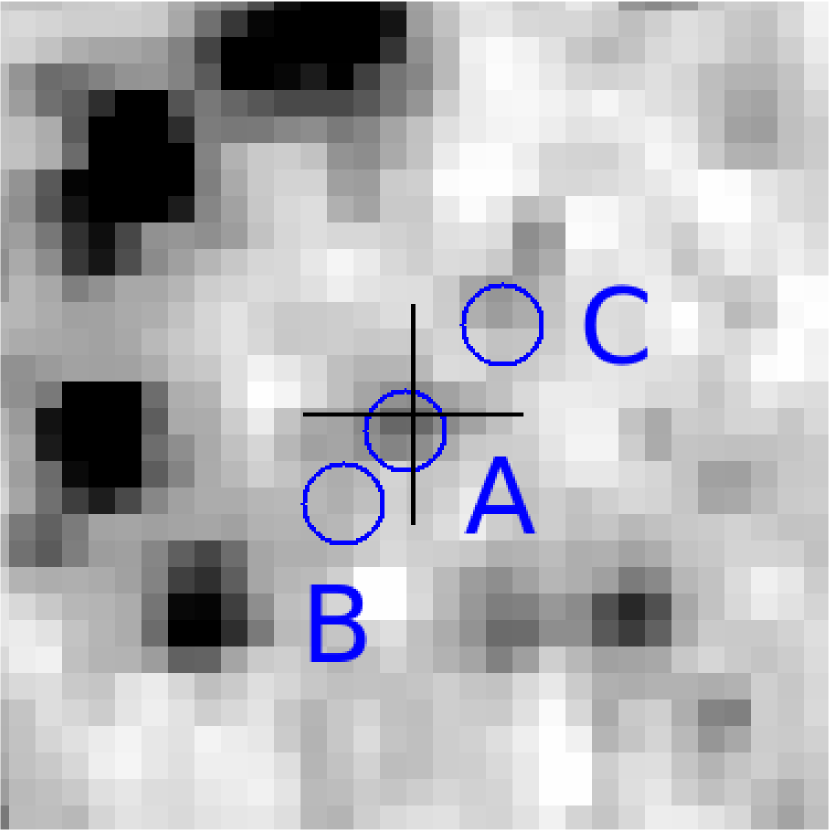
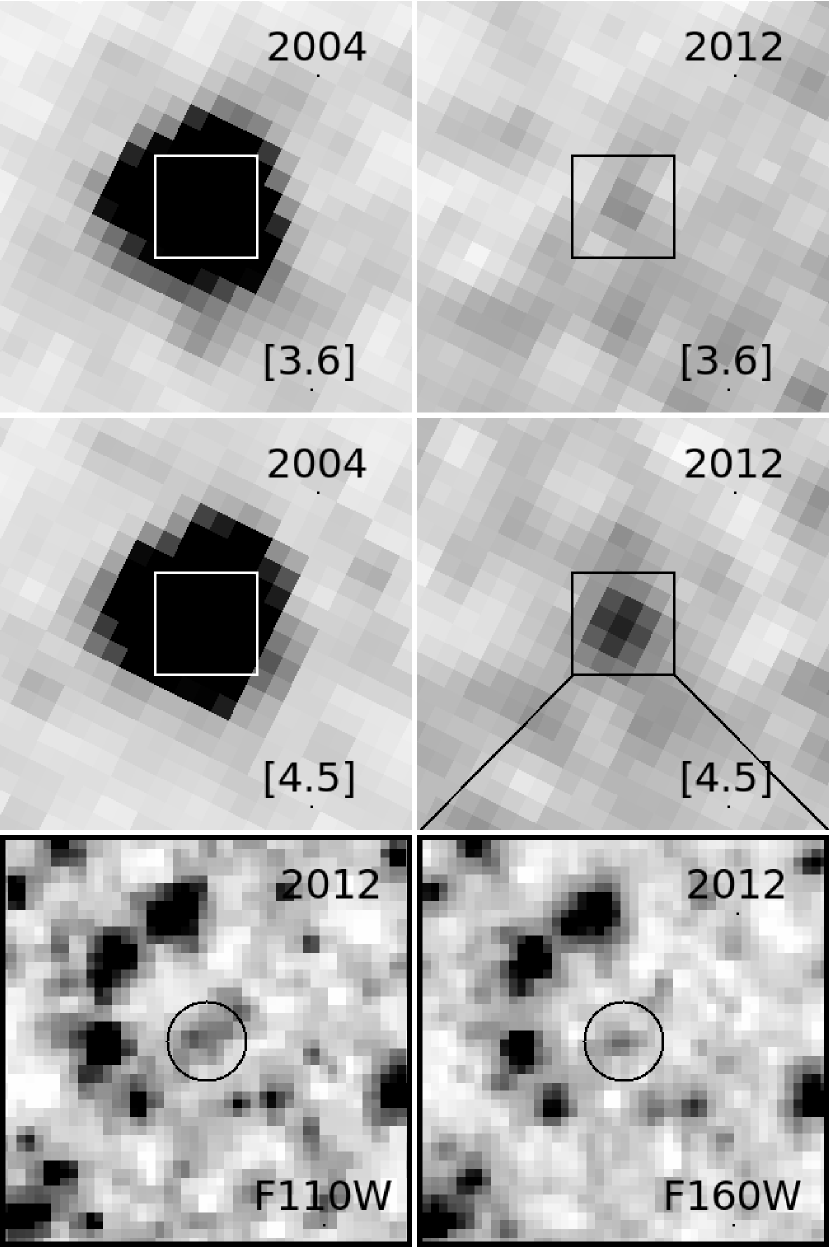
We observed SN 2002bu with SST in June 2011 and January 2012, in both the [3.6] and [4.5] m bands (program ID 80015) with exposure times of 240 sec (8 dithered 30 sec exposures) for both bands. We also observed it with HST in February 2012 using the WFC3/IR camera and the F110W () and F160W () filters (proposal ID 12450) with exposure times of 2700 s for each band. Figure 1 shows the changes in the [3.6] and [4.5] images between 2004 and 2012 as well as a zoomed in view of the region in the and -band HST images. The source has become significantly fainter in the mid-IR, more so at [3.6] than at [4.5], but any near-IR counterpart must still be very faint. Figure 2 shows a close-up view of the region in the F160W image. We identified 12 reasonably isolated stars in the HST images that could be matched to the SST images using the IRAF immatch package. Using the 2004 m image as the reference frame, we obtain the estimated SN position in the HST data shown by the circle in Figure 1 and a cross in Figure 2. The uncertainty in the position is approximately 1.5 HST pixels or .
The Spitzer fluxes were measured with aperture photometry (apphot package in IRAF), following the procedure described in Kochanek et al. (2012). We measure the flux of the source using a range of source and sky apertures (with appropriate aperture corrections) and then combine the individual results taking into account both the formal statistical and the systematic uncertainties implied by the scatter in the fluxes found for different aperture combinations. We analyzed the HST images using the DOLPHOT (Dolphin, 2000) photometry package with its standard WFC3 parameter files. DOLPHOT identifies three sources within a radius three times larger than our estimated astrometric uncertainties. We label these sources A, B and C in order of their distance from the estimated position (see Figure 2). The photometric results are presented in Table 1 together with the previous HST and SST flux measurements from Kochanek et al. (2012).
We adopt a distance to NGC 4242 of 5.8 Mpc based on Tully et al. (2009) and a foreground Galactic extinction of (Schlegel et al. 1998). We note, however, that the distance to NGC 4242 is uncertain. There is a second Tully-Fisher distance estimate of 10.4 Mpc by Springob et al. (2007) (erratum in Springob et al. 2009), and if we associate NGC 4242 with the group containing NGC 4258 it lies at the intermediate distance of Mpc (Herrnstein et al. 1999). Our qualitative conclusions are unaffected by these uncertainties. Quantitatively, luminosities increase proportional to , dust radii increase as , and the velocities implied by the dust radii increase as . The actual photometric models are essentially distance independent other than these scalings. We comment on the effects of distance changes as necessary.
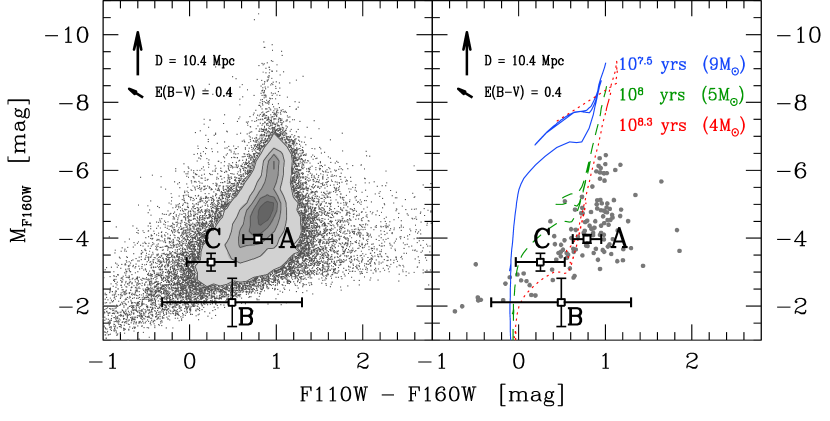
Figure 3 shows near-IR H/JH CMDs constructed from the DOLPHOT catalogs for a large (2320) and a small 35 (100 pc) radius region around the SN. We required the signal-to-noise ratio in both filters to be greater than 4 for a detection (see Dalcanton et al. 2011), and a sharpness parameter to exclude non-stellar sources. The CMDs are corrected for Galactic extinction ( mag, Schlegel et al. 1998) and assume a distance of Mpc (Tully et al., 2009). We mark the locations of sources A, B and C in both CMDs. The right panel in Figure 3 also shows the Padova (Marigo et al. 2008) isochrones for , and years, that have ZAMS masses corresponding to their end points of , and , respectively. The isochrones are moderately bluer than the stars, which could be evidence for mag (for 5.8 Mpc, mag for Mpc) of local extinction. Unfortunately, the optical detection limits are not strong enough to constrain these possibilities. For all these distances and extinctions, the local stellar population is only consistent with the older isochrones, ages closer to years and a maximum mass of than years and a maximum mass of . Since adding these extinctions have little effect on our near/mid-IR models, we add no additional extinction beyond Galactic to the models in §3.
We also observed SN2002bu with Swift (Gehrels et al., 2004) between April
26–30 2011, for a net exposure of 15 ks. We reprocessed the XRT data using the
xrtpipeline tool provided by the Swift team and reprojected the
observations into a single image. We chose the source region to be a circle
centered on the SN with a radius of 10 pixels (236) and a nearby
background region without any sources. We did not detect the source either in
the full (0.2–10 keV) or the 0.2–0.5 keV, 0.5–2 keV, and 2–10 keV bands.
We obtained 1 limits of , , , and
cnt s-1, respectively, for these bands, where we
corrected the small aperture used in the analysis based on the Swift PSF
(Moretti et al., 2005).
Assuming thermal bremsstrahlung emission with keV and Galactic
absorption of (Dickey & Lockman, 1990),
we obtained a flux limit of in the 0.5–2 keV band
that roughly corresponds to a luminosity limit of . More
generally, we model the emission as thermal brehmsstrahlung emission at a
temperature obscured by an additional column density associated
with the source. We use the PIMMS model for the Swift/XRT to estimate
the absorbed soft, medium and hard-band count rates and constrain the
unabsorbed total luminosity to be consistent with the observed upper limits
for the three energy bands.
3. Results and Discussion
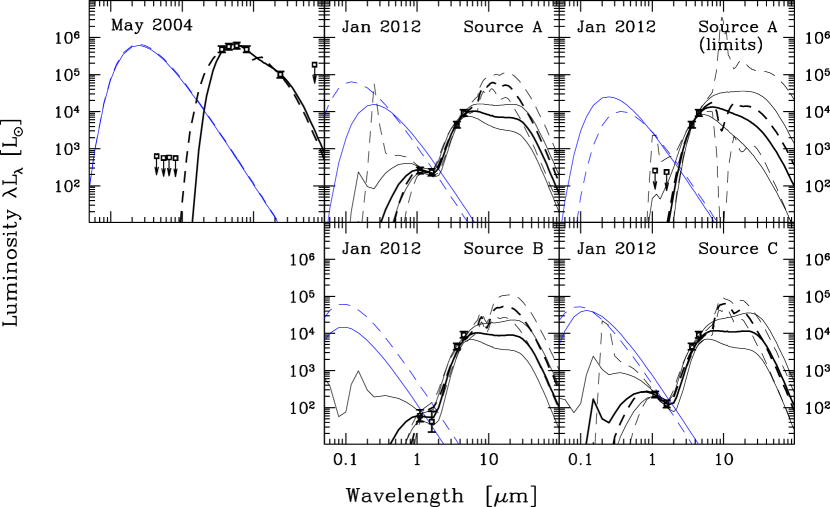
We used DUSTY (Ivezic & Elitzur 1997; Ivezic et al. 1999) to fit the SEDs of the sources detected in HST near-IR data. Figure 4 shows the probability averaged SEDs of SN 2002bu in May 2004 and January 2012 (for sources A, B and C, treating near-IR HST measurements of source A either as detections or upper limits). The best fit model to the 2004/2005 data is taken from Kochanek et al. (2012) and corresponds to a K, star surrounded by an optically thick () shell of dust expanding at 900 km/s. Both graphitic and silicate models give similarly good fits to the data.
We also embedded DUSTY in a Markov Chain Monte Carlo engine to model the SEDs, varying the dust temperature, , optical depth, , and stellar temperature, , with either a fixed 2:1 ratio between the inner and outer radii of the shell or allowing the ratio to vary between 1.1 and 10. We included a weak prior on the stellar temperature, , (and restricted its range to ) and on the expansion velocity implied by the inner radius of the shell, . For the 2012 epoch we ran models considering star A as either a detection or an upper limit. The results allowing for variations in the shell thickness were little different from those with a fixed thickness and no particular thickness was preferred, so we only report the results for the fixed thickness in Table 2.
The results for the 2004 epoch are the same as in our earlier models from Kochanek et al. (2012). The source must be quite luminous, , but with an indeterminate source temperature because of the heavy obscuration. The optical depth in graphitic models is (scattering plus absorption), and it is moderately higher in the silicate models because of the higher scattering opacities of silicate dusts (see the discussion in Kochanek et al. (2012)). Significantly higher optical depths begin to have significant opacity even for the shorter wavelength IRAC bands, inconsistent with the shape of the SED. The dust temperatures at the inner edge of K are roughly in the range expected for newly forming dust. The dust radius is estimated to be , implying a velocity of that is consistent with the velocity prior taken from the line widths cited by Smith et al. (2011). Note, however, the uncertainties are much smaller than those of the prior, so the data are in fact determining this radius and velocity rather than the prior. Despite the reasonable coverage of the mid-IR SED, graphitic and silicate dusts fit the data equally well. As discussed earlier, the primary effect of distance uncertainties is simply to rescale the luminosities, velocities and distances. In particular, adopting the distance to NGC 4258 ( Mpc) raises the velocity from km/s to km/s, while using the Springob et al. (2009) distance of Mpc raises it to km/s. One reason we adopted the smaller distance is that the larger distances begin to require significantly larger mean expansion velocities than implied by spectroscopic observations during the transient (see Smith et al. 2011).
The interpretation of the SED in 2012 depends critically on whether any source in the HST images corresponds to SN 2002bu. If source A (or B/C) is a detection, then the present day source must be a relatively hot, K, star. For graphitic dust, the star is relatively low luminosity , with moderate obscuration, at a relatively large radius that corresponds to a lower average expansion velocity but is uncertain enough to be consistent with no change in velocity. The dust temperature at the inner edge is much cooler, K. In the silicate models the source is more luminous, with greater optical depth, , located at a smaller radius , that now requires a slower expansion rate . The dust temperature at the inner edge is moderately warmer, K. There is no basis for choosing between the two dust types. If the association with source A is simply a coincidence and we instead treat the HST fluxes as upper limits, then solutions with cool stars are allowed, but they require increasingly high optical depths for lower temperatures, for the coolest ( K) models. This is essentially the limit of the fully obscured progenitors of SN 2008S and the NGC 300-OT (Prieto et al. 2008, Prieto 2008, Thompson et al. 2009, Kochanek 2011).
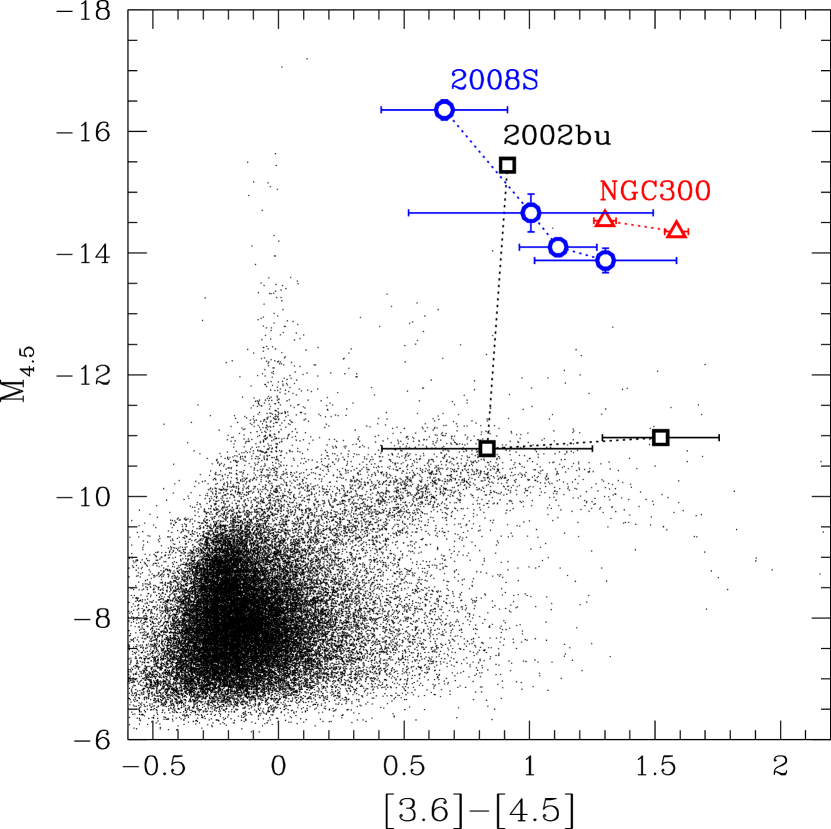
The current position of the source in the mid-IR CMD (see Figure 5), close to the tip of the AGB sequence, is similar to that of the SN 2008S or NGC 300-OT progenitor stars (Prieto et al. 2008, Prieto 2008). This is simply a coincidence driven by the present luminosity and dust radius, because in steady state a surviving star could not support the necessary optical depths given the velocities needed to have new material at such large distances. The population studies by Thompson et al. (2009) and Khan et al. (2010) imply a lifetime in the obscured phase of order years. The mass loss rate is related to the optical depth by
| (1) |
for visual opacity cm2/g, mass loss rate and wind speed , which implies a total mass loss of
while the star is in its obscured phase. No star could sustain this for km/s, so the current state cannot represent a long lived period and must be a transient phase. The progenitors, under the super-AGB star hypothesis of Thompson et al. (2009), can have the necessary lifetimes because dust driven wind velocities of - km/s are so low (e.g. Ivezić & Elitzur 2010). However, such a slow wind commencing after the transient would not even have started to form dust at this point in time.
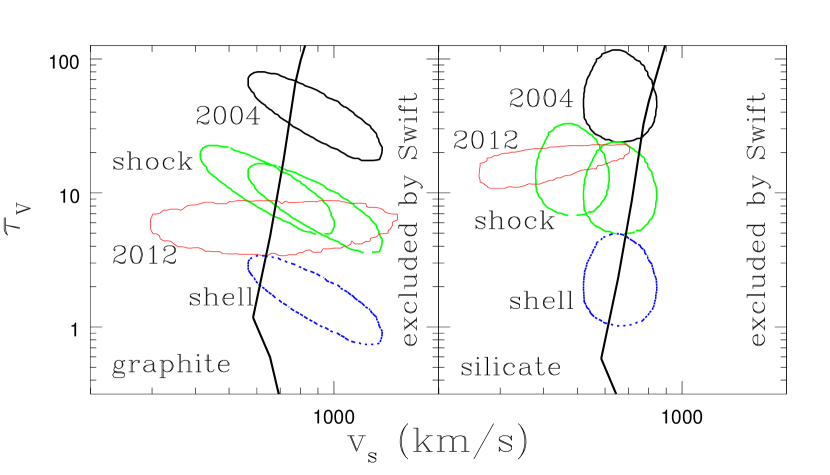
The second possibility is the traditional view of the supernova impostors as stars that briefly enter a high mass loss state during the transient to produce a shell of ejected material that then forms dust. As discussed in Kochanek et al. (2012), SN 2002bu probably started forming dust too soon after the transient peak to have formed it in ejected material. The more serious problem is that between 2004 and 2012 an expanding, dense shell should have a radius growing as and an optical depth dropping as . If we take the elapsed time from discovery to the IRAC observations in 2004 (736 days) and 2012 (3566 days), the radius should have increased by a factor of and the optical depth should have dropped by a factor of . Fig. 6 illustrates this by comparing the mean expansion velocities and optical depths for the two epochs and both grain types. If we scale the values in 2004 to their expected values in 2012 simply using the expected temporal scalings, we see that the observed properties in 2012 have a significantly higher optical depth and may require some deceleration of the expansion rate.
This leaves the scenario developed by Kochanek (2011) for SN 2008S and the NGC 300-OT, where the absorption is due to a dense pre-existing wind. In this scenario, the progenitors were obscured by a dense, dusty wind where the dust is destroyed by the shock breakout luminosity from the explosive transient so as to leave the transient with little obscuration at peak. The densities are so high, however, that the dust can then reform and re-obscure the system, consistent with the early dust formation suggested by the spectra and photometry. In the SN 2008S scenario, the material already exists at these distances and so dust can begin (re-)forming very rapidly. If the luminosity is then powered by a combination of any surviving star and an expanding shock wave, the optical depth to the shock front is only dropping as . The resulting drop in the optical depth by only a factor of is far more compatible with the observations, as shown in Fig. 6. Arguably, the shock should also be slowing as it expands through the dense wind. Self-similar solutions (e.g. Chevalier (1983)) give expansion rates of and where for ejecta with an effective density profile expanding into a wind. The typical approximations for the structure of the ejecta are () and (), leading to a modest slowing with time. In Fig. 6 we show the scaling of the conditions in 2004 to 2012 for this shock scenario (, , ).
If a significant part of the present day luminosity is driven by X-rays from an expanding shock, inferences about the temperature of the illuminating source and the exact value of the optical depth become somewhat problematic. In the shock scenario, the X-rays are absorbed by the dense gas and remitted as a complex, non-thermal (mainly) emission line spectrum, which is then absorbed and reradiated by the dust. While the shock emission models of Allen et al. (2008) do not extend to the regimes considered here, they generally have relatively low near-IR emission compared to optical/UV emission and so would resemble a hot star model. The estimates of the optical depth, which are driven by the near-IR detections, should also be viewed as being only logarithmically correct in this scenario. The overall luminosity, dust temperature and dust radius, which are largely determined by the mid-IR emissions from the dust, should still be accurate.
If we fit the expansion of the dust radius as a power law, , we find (, ) for the graphitic models and (, ) for the silicate models. The silicate models are consistent with linear expansion only at . Similarly, if we fit the evolution of the optical depth as a power law, , we find (, ) and (, ) for the graphitic and silicate models, respectively. The scaling of expanding shells is ruled out at roughly . We can also fit the evolution of the optical depth as a power law in radius, , finding () and () for the two models. While this appears to be consistent with the scaling for an expanding shell, there is a strong covariance between this exponent and the expansion rate of the shell – a solution with must also roughly have . Essentially, for the same change in optical depth there is considerable uncertainty in the radius because we lack a complete dust SED in 2012 for constraining the dust temperature. In the two-dimensional probability distribution of the and exponents, the expanding shell solution with and is still ruled out at roughly . The evolution is consistent with the and evolution of the expanding shock model.
A shock moving through a wind at velocity has a characteristic X-ray energy of
| (3) |
where the mean molecular weight is , and produces luminosity
| (4) |
where is the efficiency with which the shock energy is radiated as X-rays (e.g. Chevalier 1982, Chugai 1992, Chugai & Danziger 1994, Chevalier & Fransson 1994). The radius of the shock cm is simply related to its velocity, where days is the elapsed time from the transient to the X-ray observation. This means that the hydrogen column density outside the shock radius is
Combining these three equations with the PIMMS models for absorbed thermal bremsstrahlung, we can determine the range of shock velocities and wind density parameters () that would violate the Swift limits, as shown in Fig. 6. If the shock velocity is as high as the km/s FWHM reported by Smith et al. (2011), then there are allowed solutions for low wind densities (where the X-ray luminosity is low but little absorbed), and high wind densities (where the X-ray luminosity is high but heavily absorbed). If the shock velocity km/s, then the X-ray emission limits are satisfied for any wind density. The parameters derived from the photometric fits broadly satisfy these limits on the X-ray emission. Half the graphitic solutions violate the limit in Fig. 6, but the limit as drawn is for 100% conversion of the shock energy into soft X-rays and a detection threshold, which is a rather optimistic representation of the detection threshold. The basic picture of Fig. 6 is little changed if we use the larger distances to NGC 4242, with all solutions and limits simply shifting to higher velocities. While this increases the shock luminosity, the net effect is limited because the X-ray luminosity limits from the observations become correspondingly weaker.
4. Summary
Combining Spitzer, Hubble and Swift observations of SN 2002bu, we confirm the arguments in Thompson et al. (2009) and Kochanek et al. (2012) that this source is a member of the SN 2008S class of transients. While we have no direct evidence that the progenitor was self-obscured, dust appears to have begun forming before any ejecta would be cool enough to do so and the optical depth of the dust is dropping significantly more slowly than the scaling of an expanding shell of material. The evolution is broadly consistent with the expanding shock model of Kochanek (2011) for SN 2008S and the NGC 300-OT. It is not consistent with an expanding shell of ejected material or a reformed, slow wind around a surviving dusty star. Unfortunately, our Swift X-ray observations only constrain the allowed parameter space since we failed to detect X-ray emission from the shock.
Gogarten et al. (2009) argued from an analysis of the stellar populations near the NGC 300-OT that the progenitor could be as massive as , while Prieto et al. (2008) argued for because the progenitor appeared to be an extreme AGB star based on its location in mid-IR CMDs. The ambiguity is possible because the most luminous AGB stars have luminosities comparable to evolved stars. Formally, however, these population analyses only provide upper mass limits, so it is entirely possible to have a transient (even a supernova) from a star in a region containing stars. However, the local stellar environment of SN 2002bu, like that of SN 2008S (Szczygieł et al. 2012), appears to contain no stars more massive than . In fact, the environment of SN 2002bu appears to favor still lower masses, closer to than . This strongly favors the interpretation of Prieto et al. (2008) and Thompson et al. (2009) that the SN 2008S class of transients is associated with AGB stars. The very low mass scale implied by the environment of SN 2002bu does not, however, favor the possibility that the transients are electron capture supernovae (Thompson et al. 2009, Botticella et al. 2009), as these are only expected for masses of - (e.g. Poelarends et al. 2008). Obtaining deep optical images of the SN 2008S and 2002bu fields to better constrain the extinction and temperatures of the nearby stars would greatly improve the characterization of the stellar populations over our present near-IR results.
As with all the “supernova impostors”, the only way to determine their natures is to continue to track the evolution of their spectral energy distributions. It is clear from our survey in Kochanek et al. (2012) that there are at least two classes of sources and that no sources with adequate data were consistent with a brief period of high mass loss during the transient leading to the formation of a dusty expanding shell that obscured the source. The strength of this conclusion is strongly limited by the fragmentary nature of the data in both wavelength and time. Here we see that the SN 2008S transient class can remain dust-obscured for long periods of time, primarily because the optical depth is not evolving like that of an expanding shell. However, if object A is the near-IR counterpart of SN 2002bu, the veil is beginning to thin.
References
- Allen et al. (2008) Allen, M. G., Groves, B. A., Dopita, M. A., Sutherland, R. S., & Kewley, L. J. 2008, ApJS, 178, 20
- Arbour & Boles (2008) Arbour, R., & Boles, T. 2008, Central Bureau Electronic Telegrams, 1234, 1
- Ayani et al. (2002) Ayani, K., Kawabata, T., & Yamaoka, H. 2002, IAU Circ., 7864, 4
- Botticella et al. (2009) Botticella, M. T., Pastorello, A., Smartt, S. J., et al. 2009, MNRAS, 398, 1041
- Chevalier (1982) Chevalier, R. A. 1982, ApJ, 258, 790
- Chevalier (1983) Chevalier, R. A. 1983, ApJ, 272, 765
- Chevalier & Fransson (1994) Chevalier, R. A., & Fransson, C. 1994, ApJ, 420, 268
- Chugai (1992) Chugai, N. N. 1992, Soviet Ast., 36, 63
- Chugai & Danziger (1994) Chugai, N. N., & Danziger, I. J. 1994, MNRAS, 268, 173
- Dalcanton et al. (2011) Dalcanton, J. J., et al. 2012, ApJS, 198, 6
- Dickey & Lockman (1990) Dickey, J. M., & Lockman, F. J. 1990, ARA&A, 28, 215
- Dolphin (2000) Dolphin, A. E. 2000, PASP, 112, 1383
- Foley et al. (2007) Foley, R. J., Smith, N., Ganeshalingam, M., Li, W., Chornock, R., & Filippenko, A. V. 2007, ApJ, 657, L105
- Gehrels et al. (2004) Gehrels, N., Chincarini, G., Giommi, P., et al. 2004, ApJ, 611, 1005
- Gogarten et al. (2009) Gogarten, S. M., Dalcanton, J. J., Murphy, J. W., et al. 2009, ApJ, 703, 300
- Herrnstein et al. (1999) Herrnstein, J. R., Moran, J. M., Greenhill, L. J., et al. 1999, Nature, 400, 539
- Hornoch (2002) Hornoch, K. 2002, IAU Circ., 7923, 5
- Ivezic & Elitzur (1997) Ivezic, Z., & Elitzur, M. 1997, MNRAS, 287, 799
- Ivezic et al. (1999) Ivezic, Z., Nenkova, M., & Elitzur, M. 1999, User Manual for DUSTY, University of Kentucky Internal Report http://www.pa.uky.edu/moshe/dusty/
- Ivezić & Elitzur (2010) Ivezić, Ž., & Elitzur, M. 2010, MNRAS, 404, 1415
- Khan et al. (2010) Khan, R., Stanek, K. Z., Prieto, J. L., et al. 2010, ApJ, 715, 1094
- Marigo et al. (2008) Marigo, P., Girardi, L., Bressan, A., et al. 2008, A&A, 482, 883
- Monard (2008) Monard, L. A. G. 2008, IAU Circ., 8946, 1
- Puckett & Gauthier (2002) Puckett, T., & Gauthier, S. 2002, IAU Circ., 7863, 1
- Kochanek (2011) Kochanek, C. S. 2011, ApJ, 741, 37
- Kochanek et al. (2012) Kochanek, C. S., Szczygiel, D. M., Stanek, K. Z. 2012, arXiv1202.0281K
- Moretti et al. (2005) Moretti, A., Campana, S., Mineo, T., et al. 2005, Proc. SPIE, 5898, 360
- Poelarends et al. (2008) Poelarends, A. J. T., Herwig, F., Langer, N., & Heger, A. 2008, ApJ, 675, 614
- Prieto et al. (2008) Prieto, J. L., Kistler, M. D., Thompson, T. A., et al. 2008, ApJ, 681, L9
- Prieto (2008) Prieto, J. L. 2008, The Astronomer’s Telegram, 1550, 1
- Prieto et al. (2009) Prieto, J. L., Sellgren, K., Thompson, T. A., & Kochanek, C. S. 2009, ApJ, 705, 1425
- Schlegel et al. (1998) Schlegel, D. J., Finkbeiner, D. P., & Davis, M. 1998, ApJ, 500, 525
- Smith et al. (2011) Smith, N., Li, W., Silverman, J. M., Ganeshalingam, M., & Filippenko, A. V. 2011, MNRAS, 415, 773
- Springob et al. (2007) Springob, C. M., Masters, K. L., Haynes, M. P., Giovanelli, R., & Marinoni, C. 2007, ApJS, 172, 599
- Springob et al. (2009) Springob, C. M., Masters, K. L., Haynes, M. P., Giovanelli, R., & Marinoni, C. 2009, ApJS, 182, 474
- Szczygieł et al. (2012) Szczygieł, D. M., Prieto, J. L., Kochanek, C. S., et al. 2012, ApJ, 750, 77
- Thompson et al. (2009) Thompson, T. A., Prieto, J. L., Stanek, K. Z., Kistler, M. D., Beacom, J. F., & Kochanek, C. S. 2009, ApJ, 705, 1364
- Tully et al. (2009) Tully, R. B., Rizzi, L., Shaya, E. J., et al. 2009, AJ, 138, 323
- Wesson et al. (2010) Wesson, R., Barlow, M. J., Ercolano, B., et al. 2010, MNRAS, 403, 474
| Date (UT) | MJD | PI/Program | Comments | ||||||||||||
|---|---|---|---|---|---|---|---|---|---|---|---|---|---|---|---|
| [mag] | [mag] | [mag] | [mag] | [mag] | [mag] | [Jy] | [Jy] | [Jy] | [Jy] | [Jy] | [Jy] | ||||
| 2004-04-25 | 53120 | Fazio/69 | 1 | ||||||||||||
| 2004-05-02 | 53128 | Fazio/69 | 1 | ||||||||||||
| 2005-03-20 | 53456 | Filippenko/10272 | 1 | ||||||||||||
| 2011-06-23 | 55735 | Kochanek/80015 | |||||||||||||
| 2012-01-31 | 55958 | Kochanek/80015 | |||||||||||||
| 2012-02-15 | 55972 | Kochanek/12450 | A | ||||||||||||
| B | |||||||||||||||
| C |
| MJD | Comment | ||||||
|---|---|---|---|---|---|---|---|
| (K) | () | (K) | (cm) | (km/s) | |||
| 53128 | Graphitic | ||||||
| 53128 | Silicate | ||||||
| 55972 | Graphitic | ||||||
| 55972 | Silicate |
Note. — All the magnitude upper limits are . The date of discovery of the transient is MJD . (1) From Kochanek et al. (2012); (A) measurement for Source A; (B) measurement for Source B; (C) measurement for Source C.
Note. — These include a weak prior on the stellar temperature, (), and the velocity at which expands. These models all assume that source A is the near-IR counterpart of SN 2002bu. If it is a chance coincidence, then the optical depth scale can be significantly higher.