THE PHYSICS OF PROTOPLANETESIMAL DUST AGGLOMERATES. VII. THE LOW-VELOCITY COLLISION BEHAVIOR OF LARGE DUST AGGLOMERATES
Abstract
We performed micro-gravity collision experiments in our laboratory drop-tower using 5-cm-sized dust agglomerates with volume filling factors of 0.3 and 0.4, respectively. This work is an extension of our previous experiments reported in Beitz et al. (2011) to aggregates of more than one order of magnitude higher masses. The dust aggregates consisted of micrometer-sized silica particles and were macroscopically homogeneous. We measured the coefficient of restitution for collision velocities ranging from to , and determined the fragmentation velocity. For low velocities, the coefficient of restitution decreases with increasing impact velocity, in contrast to findings by Beitz et al. (2011). At higher velocities, the value of the coefficient of restitution becomes constant, before the aggregates break at the onset of fragmentation. We interpret the qualitative change in the coefficient of restitution as the transition from a solid-body-dominated to a granular-medium-dominated behavior. We complement our experiments by molecular dynamics simulations of porous aggregates and obtain a reasonable match to the experimental data. We discuss the importance of our experiments for protoplanetary disks, debris disks, and planetary rings. The work is an extensional study to previous work of our group and gives a new insight in the velocity dependency of the coefficient of restitution due to improved measurements, better statistics and a theoretical approach.
Subject headings:
coefficient of restitution — fragmentation — dust —planetary rings —debris disks — impact — solar system: formation1. INTRODUCTION
There is observational evidence that cm-sized particles exist in protoplanetary disks (PPDs) (see e.g. Wilner et al., 2005). A recent model of the protoplanetary-dust growth, based on laboratory experiments, has shown that cm-sized particles can be formed by direct collisional sticking (Güttler et al., 2010; Zsom et al., 2010). Güttler et al. (2010) also found that collisional compaction can lead to filling factors of up to 0.57. Compaction in fragmenting collisions with mass transfer was also found by Kothe et al. (2010), who confirmed the model by Güttler et al. (2010).
If there were even larger solid particles available in PPDs, then the growth could commence through a fragmentation-coagulation cycle, leading to dust-aggregates sizes in the planetesimal size range (Windmark et al., 2012). As the dust growth in PPDs starts with (sub-) dust grains, it is natural to assume that the resulting macroscopic bodies are agglomerates of the microscopically small dust grains. Many bodies in debris disks and planetary rings are also expected to consist of such granular material. Therefore, it is interesting and important to know the collision behavior of very large dust aggregates. A first approach to the cm size range was established by Beitz et al. (2011), who investigated collisions among 2-cm-sized dust aggregates. Here, we present follow-up experiments with 5-cm-sized dust aggregates, which are more than an order of magnitude larger in mass.
In Section 2 and 3, we describe our experimental approach and the experimental results. Section 4 explains the numerical model to understand the physics in dust-aggregate collisions, and Section 5 gives some astrophysical applications for low-velocity collisions of granular bodies. Finally, Section 6 summarizes our results.
2. EXPERIMENTAL APPROACH
In this Section, we describe the experimental methods applied for the determination of the coefficient of restitution and the fragmentation threshold of 5-cm-sized dust agglomerates.
2.1. Preparation of the Dust Agglomerates
The dust material for the production of large aggregates was pure SiO2 powder, consisting of 0.1-10m sized irregular grains. Owing to the fact that direct growth can commence through the mm-size range, upon which new growth process (e.g., fragmentation with mass transfer) occur, we expect that large dust agglomerates in PPDs possess a hierarchic structure and are agglomerates of agglomerates. Therefore, prior to the compression into large dust aggregates, the dust powder was being sieved through a mesh with a width of 0.5 mm to avoid larger aggregates. As shown by Weidling et al. (2012), the sieving process produces dust agglomerates with a filling factor of 0.35. The sieved dust was then filled into a hollow steel cylinder with 5 cm diameter and was then slowly compressed with a brass piston. The volume filling factor of the compressed dust aggregates was adjusted by filling the cylinder with a defined dust mass and by compressing the sample to a pre-determined height of 5 cm. After the compression, the bottom of the steel cylinder was removed and the dust agglomerate was pushed out of the cylinder using the piston.
2.2. Morphology of the Dust Agglomerates
To examine the inner structure of our dust agglomerates, we performed x-ray tomography (XRT) measurements. Figure 1 shows a plane perpendicular to the cylinder axis of 5 cm diameter and shows granularity, which represents the original sieved dust aggregates. This sub-structure is not visible in some areas of a few mm in radius. We think that this is caused by slightly inhomogeneous compression. To increase the resolution of the XRT, we cut a mm-sized piece out of a larger dust aggregate, which included the cylinder mantle, and repeated the XRT measurements with a voxel size of 17m 17m 17m. In the inset of Figure 1, a cut through the center of the sample is displayed, with the former cylinder mantle at the top of the inset picture. On the cylinder mantle, the agglomerate-of-agglomerates structure is not present. The material has obviously formed a slightly densified mantle of about 85m thickness with a filling factor of 0.35. We do not think that this slight density increase by about 10 percent has a considerable effect on the impact behavior of the dust agglomerates.
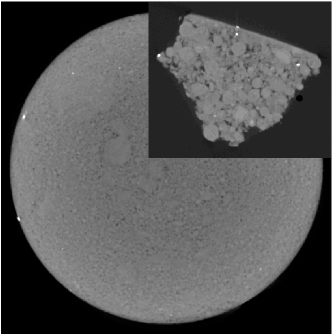
Figure 2 shows the density distribution inside the dust agglomerate. In the top graph, the mean density of planes perpendicular to the cylinder axis is shown over the full height of the agglomerate. The median volume filling factor of the dust agglomerate is . At the top 6 mm of the dust-agglomerate cylinder, the mean density is increased to a filling factor of up to 0.38. This is the place where the piston has pushed against the agglomerate during compression. In the lower 5mm of the dust aggregate, the density of the agglomerate rapidly decreases to a volume filling factor of about 0.15. The lower graph of Figure 2 shows the radial density distribution averaged over the azimuth and over 20% of the cylinder height for each curve. The upper curve was averaged over the upper 20% of the dust agglomerate. The three curves in the center were averaged over the central 20%-40%, 40-60% and 60%-80% slices of the dust agglomerate. Mind that these three curves have basically the same values and overlap in Figure 2. The lower curve was averaged over the lower 20% of the dust-agglomerates height. The lower graph of Figure 2 shows that the density of the central part of the dust agglomerate is slightly increasing from the axis to the mantle by about 5% in volume filling factor. Here, the top and bottom curves are of no particular importance, because the dust agglomerates collide close to their midplanes. Within the accuracy of the XRT measurements (m), only slightly densified material on the dust-agglomerate’s cylinder mantle is found, which we believe does not dramatically influence the collisional outcome.

2.3. Collision Experiments
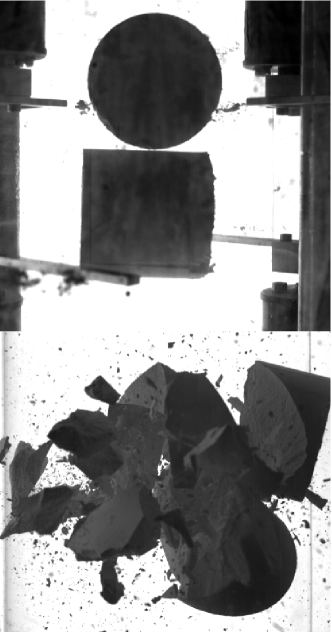
The collision experiments using the dust aggregates described above are performed in our 1.5-m laboratory drop tower described in Beitz et al. (2011). The agglomerates were placed above each other with their symmetry axes rotated by 90 degrees (see Figure 3 top). Each dust agglomerate is supported by two brackets, which can be rapidly pulled away by solenoid magnets. The upper dust agglomerate is released slightly earlier than the lower one (see Figure 3). The time difference between the release of the upper and lower dust agglomerate results in a relative velocity between the two bodies, where is the surface acceleration of the Earth. As the drop tower is evacuated to a residual gas pressure of 100 Pa, air drag can be neglected during the 0.5 s free-fall time.
The resulting impacts are observed by two cameras (one high-speed camera, one camera with a normal frame rate) with 90 degrees angular distance. The cameras, which are outside the drop tower, are released such that they fall in the center-of-mass frame of the two dust aggregates.
The release mechanisms of the two dust agglomerates cause a slight rotation of the two bodies. Furthermore, the collisions were not always perfectly central, which also causes rotation. To account for these effects, we calculated the coefficient of restitution from the ratio of the square root of the total kinetic energies of the two dust agglomerates in their center-of-mass frame before and after the collision,
| (1) |
Here, and are the relative translational velocities of the two dust aggregates before (index 1) and after (index 2) the collision, , , , and are the mutually perpendicular angular velocity components of the colliding cylinders (the first index refers to before and after the collision, the second index describes, which component of the angular velocity is meant), and and are the reduced mass and the moment of inertia of the two dust aggregates. Please note, that we only consider rotation of the dust cylinders around axes perpendicular to their symmetry axis. A rolling motion of the dust aggregates, which is both difficult to observe and possesses a much smaller moment of inertia, is neglected here. The effective relative velocity, including rotation effects, of the agglomerates prior to the collision is then given by
| (2) |
This rotation of the dust aggregates is only important at the very lowest impact velocities; at higher relative velocities, the rotational motion prior to the impact is negligible with respect to the rotation after the impact.
At velocities lower than , the statistical scattering of the single measurement was very high. This was due to the fact that the free-fall time of the dust aggregates was limited to 0.5 s, which allows for a 1 impact velocity a maximum distance between the dust agglomerates prior and after the impact of only 2.5 mm. This is both from the preparatory point of view and for data-analysis reasons a limiting value so that lower impact velocities were not achievable. Therefore, more experiments have been performed at the lower velocities to get a reasonable mean value for the coefficient of restitution.
3. EXPERIMENTAL RESULTS
In this Section, we will present our data on the low-velocity coefficients of restitution as well as on the fragmentation velocities of dust aggregates of two different volume filling factors.
3.1. Coefficient of Restitution
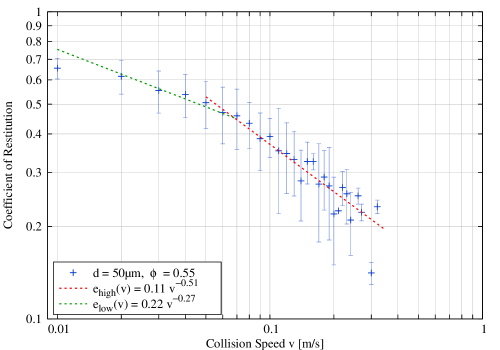
In Figure 4, the coefficient of restitution of our 5-cm sized cylindrical agglomerates, according to the definition in Eq. 1, is plotted as a function of the effective impact velocity, according to Eq. 2, for volume filling factors of and , respectively. Each data point is the mean of four measurements; the error bars denote the 2- error of the mean value.

We can clearly distinguish different velocity regions: (1) At the very lowest velocities (), the coefficient of restitution follows the solid-state model by Thornton & Ning (1998) within the measurement uncertainties as shown by the error bars in Figure 4 (see Section 4.1). (2) At higher velocities () for a filling factor of 0.3 and for a filling factor of 0.4), the coefficient of restitution decreases steeply to values of for and for , respectively. (4) At even higher velocities, we observe fragmentation (see Section 3.2).
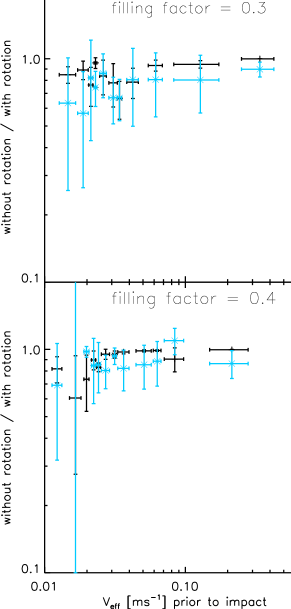
The coefficient of restitution was measured by considering translational and rotational velocity changes. Because translational and rotational velocities are transformed into one another, depending on the impact parameter, it is not possible to split the coefficient of restitution into components of rotation and translation. To show the contribution of rotation in our measurements, we display in Figure 5 the ratio of the translational velocity to the effective velocity prior to the impact as well as the ratio of the coefficients of restitution with and without the consideration of rotation over the effective impact velocity. We use the same averaging process as in fig. 4.1. Figure 5 shows that the rotational contribution in our measurements is below 40% over all velocities and that the influence of rotation on the coefficient of restitution increases with decreasing impact velocity. However, the data also show that the different regimes of the coefficient of restitution (see above) are not caused by rotation effects.
In contrast to our result, Beitz et al. (2011) found no obvious correlation between the coefficient of restitution and impact velocity. Unlike in our experiments, they used smaller spherical dust agglomerates made from monodisperse spherical grains. We used cylindrical agglomerates, because we were not able to produce homogeneous crack-free spherical dust agglomerates. Our polydisperse irregular grains possess smaller contact forces between the monomer particles than the monodisperse spherical grains of Beitz et al. (2011). This and the smaller filling factor in our experiments ease collisional compression and reduce the effect of randomly jammed packings during collision (see e.g. Torquato & Stillinger, 2010). Jammed packings are stronger at higher compression velocities and increase the rigidity of an agglomerate and therewith decrease the contact area of the colliding agglomerates. Due to the model by Thornton & Ning (1998), this should increase the coefficient of restitution. Therefore, it is possible that jamming occurred in the experiments by Beitz et al. (2011), due to their higher filling factor and monodisperse spherical grains, which is the more pronounced at higher the collisional velocities.
3.2. Fragmentation Velocity
Above a certain impact velocity, one or both of the colliding dust aggregates fragment so that the determination of the coefficient of restitution becomes meaningless. We measured the outcome of collisions among the 5-cm sized dust aggregates with volume filling factors of , and for velocities up to cm s-1 and plotted the collision results in Figure 6. The signs denote bouncing, stands for the fragmentation of one of the two dust aggregates, whereas and describe the fragmentation of both dusty bodies (in the latter case with a maximum fragment mass smaller than half of the projectile mass). For comparison, we added the data from Beitz et al. (2011) for 2-cm sized spherical dust aggregates with , using spherical m sized monomers. Within the scatter of data, the threshold between bouncing and single-aggregate fragmentation seems to be independent of the volume filling factor at . This is about a factor of two higher than the fragmentation threshold found by Beitz et al. (2011) and might be due to the different geometry (spheres vs. cylinders), the different monomer morphologies and sizes (irregular polydisperse vs. spherical monodisperse), dust-aggregate size (5 cm vs. 2 cm) or volume filling factor ( vs. ).

4. MODELING DUST-AGGREGATE COLLISIONS
4.1. Continuum Theories
Assuming that at low velocities dust agglomerates behave like solid bodies, we can apply the theory of Thornton & Ning (1998) for the derivation of the impact-velocity dependence of the coefficient of restitution. At larger velocities, we assume that the granular material gets more and more mobilized and begins to fluidize so that a solid-state theory is no longer applicable. The model by Thornton & Ning (1998) relies on two threshold velocities, the transition velocity between sticking and bouncing and the transition velocity between elastic and plastic material effects, , respectively. The data shown in Figure 4 suggest that our collision velocities are clearly above both thresholds, because the coefficient of restitution is in the regime in which energy-dissipating effects dominate. In this velocity regime, Thornton & Ning (1998) predict a decrease of the coefficient of restitution with increasing velocity and asymptotically a power-law behavior of the coefficient of restitution of the form . The dotted line in Figure 4 shows such a dependence, with for and for , respectively. As can be seen in the comparison between the model and our data, our 5-cm sized dust aggregates can be reasonably described by the Thornton & Ning (1998) continuum theory for effective impact velocities up to . However, for larger impact speeds, the coefficient of restitution drops below the curve predicted by Thornton & Ning (1998) and is rather velocity independent for velocities between and the fragmentation limit (see Figure 4).
4.2. Molecular Dynamics Simulations of Dust-Aggregate Collisions
To understand these different collision behaviors of dust aggregates, we use a molecular dynamics approach featuring detailed contact mechanics of microscopic silicate grains. The corresponding interaction laws have been proposed by Johnson et al. (1971) and Dominik & Tielens (1995, 1996). An overview is given by Dominik & Tielens (1997) who applied the model to simulate dust agglomerate collisions for the first time in the context of planet formation. Later, Wada et al. (2007) presented a different approach where the same interaction laws were derived from potentials. Recently, Seizinger et al. (2012) proposed simple modifications to the model to better reproduce the compression behavior measured in laboratory experiments by Güttler et al. (2009).
In this work the modified model of Seizinger et al. (2012) is used. The material parameters used here are given in Table 1. They are identical to those of Seizinger et al. (2012) but differ from the ones used for similar simulations performed by Wada et al. (2011).
| Physical property | Silicate |
|---|---|
| Particle Radius (in ) | |
| Density (in g cm-3) | |
| Surface Energy (in mJ m-2) | |
| Young’s Modulus (in GPa) | |
| Poisson Number | |
| Critical Rolling Length (in nm) |
4.2.1 Sample Generation
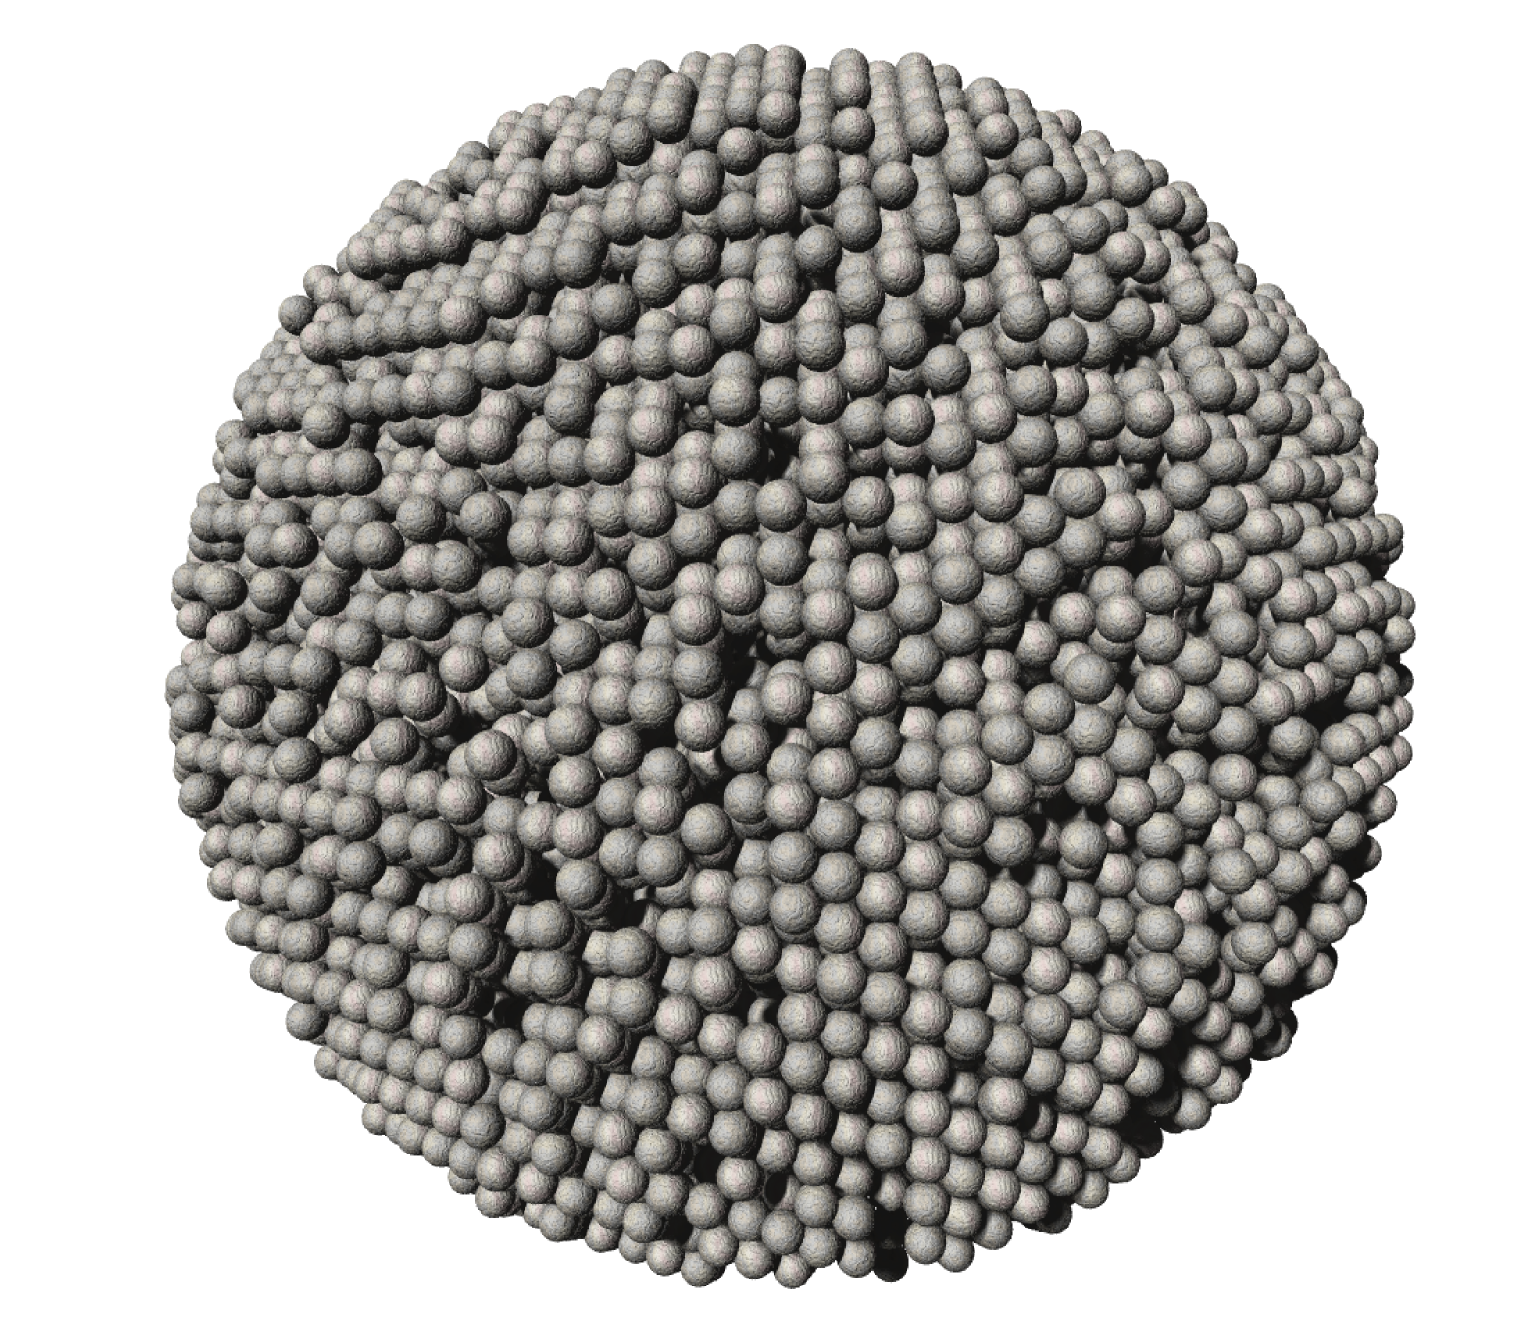
Here, we study the collisions of spherical aggregates. The samples were generated using the following procedure: we began with the regular lattice of the hexagonal closest packing (hcp) for which the volume filling factor is given by . To achieve lower filling factors, we removed the proper amount of randomly selected monomers. Especially for lower filling factors, some monomers may end up disconnected from the rest of the aggregate. In the last step, we therefore removed all isolated monomers which were not connected to the main aggregate (typically less than of the total number of monomers). Except for the removal of isolated monomers, this preparation method has been used by Wada et al. (2011) before.
The samples we used in this work consist of approximately monomers, with a coordination number of , a diameter of and a volume filling factor of . An image of such a sample is shown in Figure 7.
4.2.2 Numerical Collision Experiments
Three samples generated by the procedure described above were rotated randomly and collided head-on with impact velocities between and . In case of a bouncing event, we determined the relative velocity between the collision partners by averaging over the individual velocities of the monomers that each aggregate was composed of.
Due to the lattice structure of the samples, their relative orientation has a significant influence on the outcome of the collision. Depending on this orientation, both sticking and bouncing may occur for a given velocity. As we intended to study the dependency of the coefficient of restitution on the collision velocity, we kept the same orientation for a whole collision sequence. For each sample, eight randomly chosen orientations were examined. Thus, 24 collisions sequences have been simulated in total. Typically, not all collisions of one sequence resulted in bouncing.
4.2.3 Results
The results of these collision sequences for the coefficient of restitution are shown in Figure 8. Similar to the laboratory experiments, one can distinguish different velocity regimes. The velocity dependency of the coefficient of restitution can be well fitted by power laws, . We determined two fits for the low-velocity regime ranging from to and for velocities from to . We obtain , and , . For the low-velocity regime, the exponent of the power law agrees very well with the one derived by Thornton & Ning (1998) for the continuum theory, i.e. . The error bars show the influence of the orientation of the colliding aggregates on the outcome of the collision. For velocities higher than , we did not observe bouncing behavior anymore.
For low-velocity collisions, the kinetic impact energy is too low to restructure the aggregates and, thus, the energy is mainly dissipated by the formation and breaking of contacts between the monomers as shown in Figure 9. At velocities above 2 , restructuring of the dust aggregate sets in. As we can see in Figure 10, inelastic rolling and sliding become the most important dissipative channels. The dominance of the inelastic sliding results from the high compactness of the aggregates. Due to the large coordination number, monomers are tightly fixed by their neighbors, which limits the amount of inelastic rolling that may occur.
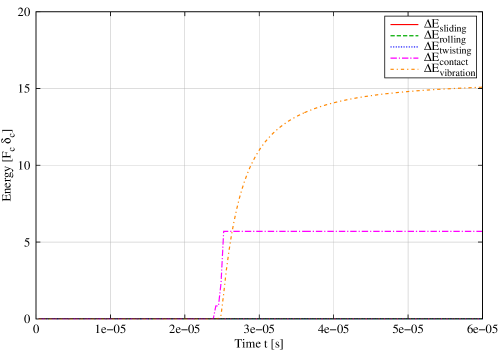
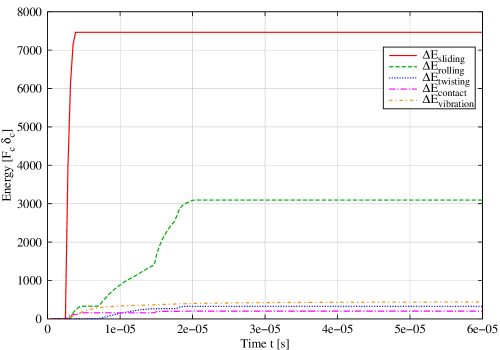
Given the vast differences in monomer-particle numbers between the experimental and the model dust aggregates, the agreement in the range of absolute values of the coefficient of restitution and the occurrence of different physical regimes is striking. Both approaches show a solid-state-like behavior for very low impact velocities and deviations from the expected power law with a slope of -1/4 for higher velocities.
5. ASTROPHYSICAL APPLICATIONS
5.1. Protoplanetary Disks
It has only recently been shown that cm-sized dust aggregates can grow in PPDs (Zsom et al., 2010). Under certain conditions, even larger dust aggregates can be formed. Windmark et al. (2012) showed that a few indestructible, cm sized solid bodies can trigger the further growth of dust aggregates through a fragmentation and re-accretion cycle. Baroclinic vortices (Klahr & Bodenheimer, 2004) or streaming instabilities (Youdin & Goodman, 2005) can concentrate cm-sized or larger dust aggregates to high number densities. In all such cases, knowledge about the low- and intermediate-velocity collision behavior of dust aggregates is of utmost importance to correctly describe the fate of the dusty components. In highly mass-loaded regions of PPDs, such as the dust sub-disk or instability regions, the coefficient of restitution determines the reduction of the relative velocities among the dust aggregates. A low value of the coefficient of restitution eases the occurrence of gravitational instabilities. It is, thus, important to know the threshold velocity for the onset of fragmentation, so that the size evolution of the dust aggregates and, thus, the efficiency of the gravitational instability in PPDs can be correctly determined (see Johansen et al. (2006, 2008, 2012)).
5.2. Debris Disks
As relative velocities in virtually gas-free debris disk are typically larger than tens of meters per second, fragmentation dominates the outcomes in collisions between dust aggregates. Thus, one would expect a broad size distribution of dust aggregates from the monomer grains or the radiation-pressure blowout size (whatever is larger) to the largest occurring bodies. However, the recent discovery of ultra-cold debris disks with dust temperatures below the black-body equilibrium temperature has severely challenged this picture (Eiroa et al., 2011). Such low temperatures require dust materials with very low absorption in the far infrared and the absence of a source for particles smaller than the wavelength. The former can possibly be reached with icy constituents, the latter requires collision velocities below the fragmentation threshold.
We found in our investigation that the fragmentation limit is as low as for large dust aggregates consisting of micrometer-sized grains. This is very close to the sticking threshold for the monomer particles (Poppe et al., 2000). Unfortunately, it has only recently been possible to produce micrometer-sized water-ice particles (Gundlach et al., 2011) so that impact experiments with monomer particles and aggregates have not yet been performed. However, the experiments by Gundlach et al. (2011) showed that the surface force for the water-ice particles is about a factor of ten higher than for silica so that one can expect a similar increase for the threshold velocities for monomer sticking and aggregate fragmentation, i.e. . Future experiments will have to show whether this is true or not.
5.3. Planetary Rings
In Saturn’s main rings, the particle sizes have been estimated to range from cm to m (Zebker et al., 1985) and are believed to be at least covered by a regolith layer (Poulet & Cuzzi, 2002), which makes them similar in their collision behavior to our dust aggregates. In the rings, the orbital shear leads to random velocities among the ring particles. This effect is counterbalanced by the energy loss due to the inelastic collisions among the ring particles, leading to a steady-state velocity distribution if and only if the coefficient of restitution decreases with increasing collision velocity. A basic description of this behavior is given in Goldreich & Tremaine (1978). The authors also found a direct correlation between the optical depth of the ring and the coefficient of restitution if the rings are in dynamical equilibrium. For reasonable optical depths for Saturn’s main rings, the required coefficients of restitution are . Both conditions, the negative correlation between the coefficient of restitution and the collision velocity as well as the required values of the coefficient of restitution show that the physical composition of the ring particles must be such that the threshold velocity between elastic and plastic impacts is just slightly lower than the typical impact speeds (). Clearly, much more work has to be done before we can really understand the collision behavior of ring particles (e.g. use icy aggregates, much lower collision velocities, include rotation, etc.), but the dust-aggregate collision experiments presented in this article show how to proceed.
6. SUMMARY
We investigated the low-velocity collision behavior of 5-cm sized cylindrical dust agglomerates made by compression of micrometer-sized particles. We measured the coefficient of restitution and the onset of fragmentation for agglomerates with volume filling factors of and and found that (1) at the very lowest velocities (), the coefficient of restitution follows the solid state model by Thornton & Ning (1998) within the measurement uncertainties as shown by the error bars in Figure 4, that (2) the coefficient of restitution decreases steeply to for a volume filling factor of 0.3 for velocities of and to for a volume filling factor of 0.4 for velocities of ), that (3) the coefficient of restitution remains constant for higher velocities, until (4) fragmentation dominates for .
Our own numerical simulations, using the molecular-dynamics approach described in Seizinger et al. (2012), yield a reasonable match to the experimental data over the entire bouncing regime. We discussed the consequences of our results concerning PPDs, cold debris disks, and planetary rings.
We thank Evelyn Liebert, Hans-Georg Pietscher and Heinrich Schmidt for their help in adjusting the laboratory drop tower to larger dust aggregates and for some test experiments. We thank Stephan Olliges and the Institut für Partikeltechnik at the TU-Braunschweig for performing the XRT mearsurements of our samples. This research was supported by the Deutsches Zentrum für Luft- und Raumfahrt under grant no. 50WM0936 and by the Deutsche Forschungsgemeinschaft (DFG) under grants BL 298/17 & KL 650/16, and within the collaborative research group FOR 759 The formation of planets. The simulations were performed on the bwGRiD cluster, which is funded by the Ministry for Education and Research of Germany and the Ministry for Science, Research and Arts of the state Baden-Württemberg.
References
- Beitz et al. (2011) Beitz, E., Güttler, C., Blum, J., Meisner, T., Teiser, J., & Wurm, G. 2011, ApJ, 736, 34
- Dominik & Tielens (1995) Dominik, C., & Tielens, A. G. G. M. 1995, Philosophical Magazine, Part A, 72, 783
- Dominik & Tielens (1996) —. 1996, Philosophical Magazine, Part A, 73, 1279
- Dominik & Tielens (1997) —. 1997, ApJ, 480, 647
- Eiroa et al. (2011) Eiroa, C., et al. 2011, A&A, 536, L4
- Goldreich & Tremaine (1978) Goldreich, P., & Tremaine, S. D. 1978, Icarus, 34, 227
- Gundlach et al. (2011) Gundlach, B., Kilias, S., Beitz, E., & Blum, J. 2011, Icarus, 214, 717
- Güttler et al. (2010) Güttler, C., Blum, J., Zsom, A., Ormel, C. W., & Dullemond, C. P. 2010, A&A, 513, A56+
- Güttler et al. (2009) Güttler, C., Krause, M., Geretshauser, R. J., Speith, R., & Blum, J. 2009, ApJ, 701, 130
- Johansen et al. (2008) Johansen, A., Brauer, F., Dullemond, C., Klahr, H., & Henning, T. 2008, A&A, 486, 597
- Johansen et al. (2006) Johansen, A., Klahr, H., & Henning, T. 2006, ApJ, 636, 1121
- Johansen et al. (2012) Johansen, A., Youdin, A. N., & Lithwick, Y. 2012, A&A, 537, A125
- Johnson et al. (1971) Johnson, K. L., Kendall, K., & Roberts, A. D. 1971, Royal Society of London Proceedings Series A, 324, 301
- Klahr & Bodenheimer (2004) Klahr, H., & Bodenheimer, P. 2004, in Revista Mexicana de Astronomia y Astrofisica Conference Series, Vol. 22, Revista Mexicana de Astronomia y Astrofisica Conference Series, ed. G. Garcia-Segura, G. Tenorio-Tagle, J. Franco, & H. W. Yorke , 87–90
- Kothe et al. (2010) Kothe, S., Güttler, C., & Blum, J. 2010, ApJ, 725, 1242
- Poppe et al. (2000) Poppe, T., Blum, J., & Henning, T. 2000, ApJ, 533, 454
- Poulet & Cuzzi (2002) Poulet, F., & Cuzzi, J. N. 2002, Icarus, 160, 350
- Seizinger et al. (2012) Seizinger, A., Speith, R., & Kley, W. 2012, A&A, 541, A59
- Thornton & Ning (1998) Thornton, C., & Ning, Z. 1998, Powder Technology, 99, 154
- Torquato & Stillinger (2010) Torquato, S., & Stillinger, F. H. 2010, Rev. Mod. Phys., 82, 2633
- Wada et al. (2007) Wada, K., Tanaka, H., Suyama, T., Kimura, H., & Yamamoto, T. 2007, ApJ, 661, 320
- Wada et al. (2011) —. 2011, ApJ, 737, 36
- Weidling et al. (2012) Weidling, R., Güttler, C., & Blum, J. 2012, Icarus, 218, 688
- Wilner et al. (2005) Wilner, D. J., Raman, A., Lisanti, M., Qi, C., & Hogerheijde, M. 2005, in Bulletin of the American Astronomical Society, Vol. 37, American Astronomical Society Meeting Abstracts, 1224
- Windmark et al. (2012) Windmark, F., Birnstiel, T., Güttler, C., Blum, J., Dullemond, C. P., & Henning, T. 2012, ArXiv e-prints
- Youdin & Goodman (2005) Youdin, A. N., & Goodman, J. 2005, ApJ, 620, 459
- Zebker et al. (1985) Zebker, H. A., Marouf, E. A., & Tyler, G. L. 1985, Icarus, 64, 531
- Zsom et al. (2010) Zsom, A., Ormel, C. W., Güttler, C., Blum, J., & Dullemond, C. P. 2010, A&A, 513, A57+