Microwave Emission of Supra-arcade Structure associated with M1.6 Limb Flare
Abstract
We have investigated a supra-arcade structure, associated with an M1.6 flare, which occurred on the south-east limb on 4th of November 2010. It is observed in microwaves at 17 GHz with the Nobeyama Radioheliograph (NoRH), soft X-rays in the range of 8-20 keV with the Reuven Ramaty High Energy Solar Spectroscopic Imager (RHESSI), and EUV with the Atmospheric Imaging Assembly (AIA) onboard the Solar Dynamics Observatory (SDO). As reported by Reeves & Golub (2011), the supra-arcade structure is observed predominantly in the AIA 131 Å channel, which contains a hot 11 MK component from Fe XIX (Boerner et al. 2011). While this hot flare plasma lasts over the decay phase of the flare, it shows some interesting characteristics in microwaves and soft X-rays: 1) In the supra-arcade structure, the brightness temperature () of the microwave emission increases gradually up to 2104 K, and 2) two soft X-ray sources appear: one cospatial with the supra-arcade structure and another above the post-flare arcade. We have derived the variation of emission measure, density, and energy of the supra-arcade structure using the obtained from 17 GHz microwave observations.
1 Introduction
Recently, Reeves & Golub (2011) reported three events which show hot plasma above the flare arcade observed by AIA/SDO. AIA provides multi-wavelength EUV images with 1.2 ′′ resolution and 12 s temporal cadence. We have examined one of these events, which shows significant microwave emission in the supra-arcade structure, using NoRH, RHESSI, and AIA/SDO.
2 Observations and Analysis
We have examined the supra-arcade structure associated with an M1.6 flare which occurred on the 4th of November 2010, on the south-west limb. The GOES X-ray flux shows that the flare starts at 23:52, peaks at 23:57, and gradually decreases before the start of another flare at 00:50 on the 5th of November.
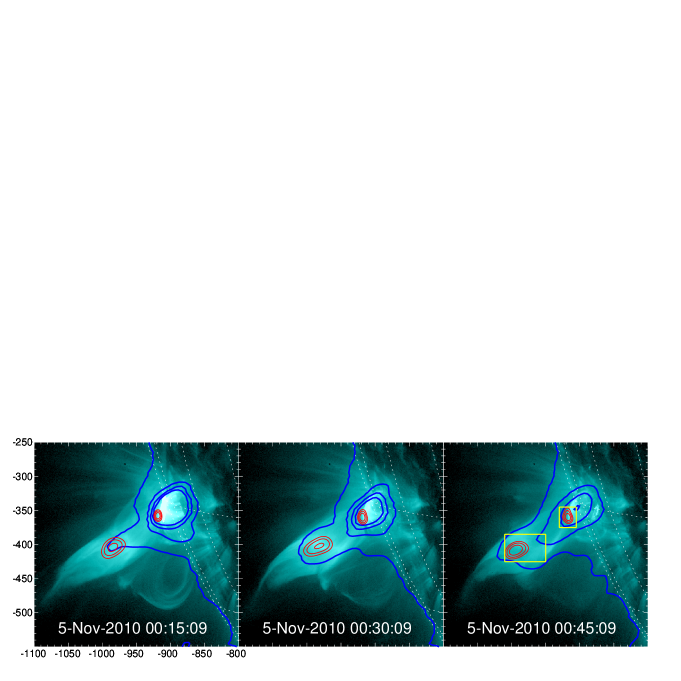
The flare arcade shows emission at all EUV wavelengths, while the supra-arcade structure in the high corona is particularly prominent at AIA 131 Å (Fig. 1). Comparisons with other wavelengths suggest T = 11 MK for the supra-arcade structure. The supra-arcade structure is present in 131 Å from the flare onset until the onset of the subsequent flare on the 5th. The Hinode X-ray Telescope (XRT) also observed this hot plasma. The of the hot plasma in high corona at 17 GHz slowly increases and extends out to the region of hot 131 Å supra-arcade (blue contours in Fig. 1). Red contours in Fig. 1 show RHESSI 8-20 keV soft X-ray emission. The X-ray images were made using the 2-step CLEAN method (Krucker et al. 2011). Two different sources we identified: a bright compact source above the post-flare arcade; and a faint, extended source cospatial with the supra-arcade structure. Both sources appear continuously throughout the decay phase.
Following Dulk (1985), for an optically thin, isothermal plasma, the brightness temperature at a given frequency is related to the plasma temperature (11 MK for our event) by , where the optical depth . Using this we determine an emission measure of 21031 cm-5. The electron number density and thermal energy were found to increase up to 5109 cm-3 and 11030 erg, respectively.
3 Results and Summary
The supra-arcade thermal structure of an M1.6 flare is observed in microwaves, EUV and soft X-rays. We found that the of the supra-arcade at 17 GHz increases as the flare decays. A thermal X-ray source is also present in the supra-arcade. The results show unexpectedly high, and increasing, values of density and thermal energy in supra-arcade flare plasma, persisting throughout a long decay phase of around 50 min. To study the physical mechanism for heating and injection of this plasma into the supra-arcade structure, further work using AIA filter ratio temperature estimation method and a more detailed investigation of the morphological evolution of the hot plasma will be carried out.
References
References
- [1] Boerner et al. 2011, Sol. Phys., published online
- [2] George A. Dulk 1985, ARA&A, 23, 169
- [3] Krucker, S., Kontar, E. P., Christe, S., Glesener, L., Lin, R. P. 2011 (In review)
- [4] Reeves, K. K. & Golub, L. 2011, ApJ, 727, L52