First-principles study of surface properties of PuO2: Effects of thickness and O-vacancy on surface stability and chemical activity
Abstract
The (111), (110), and (001) surfaces properties of PuO2 are studied by using density-functional theory+ method. The total-energy static calculations determine the relative order of stability for low-index PuO2 surfaces, namely, O-terminated (111) (110) defective (001) polar (001). The effect of thickness is shown to modestly modulate the surface stability and chemical activity of the (110) surface. The high work function of eV indicates the chemical inertia of the most stable (111) surface, and the surface O-vacancy with concentration = % can efficiently lower to eV, which is a crucial indicator of the difference in the surface chemical activities between PuO2 and -Pu2O3. For the polar (001) surface, % on-surface O-vacancy can effectively quench the dipole moment and stabilize the surface structure, where the residual surface oxygen atoms are arranged in a zigzag manner along the 100 direction. We also investigate the relative stability of PuO2 surfaces in an oxygen environment. Under oxygen-rich conditions, the stoichiometric O-terminated (111) is found to be the most stable surface. Whereas under O-reducing conditions, the on-surface O-vacancy of = is stable, and for high reducing conditions, the (111) surface with nearly one monolayer subsurface oxygen removed ( = ) becomes most stable.
pacs:
71.15.Mb, 71.30.+h, 71.28.+d, 71.27.+aI Introduction
Plutonium dioxide (PuO2) is of high importance in the nuclear fuel cycle and is particularly crucial in long-term storage of Pu-based radioactive waste. Besides playing an important role in both technological applications and environmental issues, Pu metal and its oxides show many intricate physical behaviors due to the complex electronic structure properties of 5f states ref-1 ; ref-2 ; ref-3 ; ref-04 . Therefore, a thorough understanding of the physical and chemical properties of PuO2 is of great significance, full of challenges and has always attracted attention. Recently, there have occurred in the literature a series of experimental reports ref-5 ; ref-6 ; ref-7 on the strategies of storage of Pu-based waste. When exposed to air and moisture, metallic plutonium surface rapidly oxidizes to PuO2 Has2000 ; ref-4 . Under special aqueous condition, the interaction of PuO2 surface with adsorbed water can generate non-stoichiometric PuO2+x (x0.27) ref-5 via an overall reaction, namely, PuO2+H2OPuO2+x+H2. However, the oxidation of PuO2 has been proved to be strongly endothermic by subsequent first-principles theoretical calculation PuO2+x; ref-8 . To test the possible existence of surface PuO2+x, recent photoemission study ref-7 has been carried out and found that PuO2 is only covered by a chemisorbed layer of oxygen and can be easily desorbed at elevated temperature. Thus, PuO2 is generally acknowledged as the highest stable Pu-oxide under ambient conditions. However, under oxygen-lean conditions (in the vacuum or inert gas), the PuO2-layer can be reduced to sesquioxides (Pu2O3), which can promote the corrosion of the Pu-metal by hydrogen Has2000 . As we know, the low-temperature phase of Pu-sesequioxide is a phase with space group (No. 206), which is similar in the crystal structure to the cubic PuO2 (, No. 225) with the 25% O vacancy located in the 16 () sites. The above mentioned experimental observations indicate that the surface of PuO2 is to some extent chemically inactive, however, the formation of O vacancies can prominently modify the electronic structure properties of both the bulk and the surface of PuO2. As a matter of fact, the surface layers are directly involved in the significant corrosion processes and many technological applications of the actinide oxides, thus a deep understanding of the physical and chemical properties of PuO2 surfaces is always desirable. However, due to the radioactivity and toxicity of Pu and the complexity of the Pu element and Pu-O system, it is extraordinarily difficult to experimentally explore the surface atomic and electronic structure properties of the Pu-oxides, and particularly so for a single phase compound.
From the theoretical point of view, conventional density-functional theory (DFT) that applies the local density approximation (LDA) or generalized gradient approximation (GGA) underestimates the strong on-site Coulomb repulsion of the 5f electrons and, consequently, describes PuO2 as incorrect ferromagnetic FM conductor ref-9 instead of antiferromagnetic AFM Mott insulator reported by experiment ref-10 . Similar problems have been confirmed in studying other correlated materials within the pure LDA/GGA schemes. Fortunately, several approaches, including the LDA/GGA+ ref-11 ; ref-12 ; ref-13 , the hybrid density functional of (Heyd, Scuseria, and Enzerhof) HSE ref-14 , the self-interaction corrected local spin density SIC-LSD ref-15 , and LDA combined dynamical mean-field theory DMFT dmft , have been developed to correct these failures in calculations of actinide compounds. The effective modification of pure DFT by LDA/GGA+ formalisms has been confirmed widely in study of PuO2 ref-16 ; ref-17 ; ref-18 ; ref-19 ; ref-20 ; ref-21 . By tuning the effective Hubbard parameter in a reasonable range, the AFM Mott insulator feature was correctly calculated and the structural parameters as well as the electronic structure are well in accord with experiments. However, those increasing theoretical researches have been focusing on the bulk properties of PuO2, and very little is known regarding its surface physical and chemical properties, which is in sharp contrast to the depth and comprehensiveness of researches conducted upon the transition metal and rare earth oxides SSR . As far as we are aware, few DFT studies of the PuO2 (100) and (110) surfaces have been presented in the literature ref-22 ; ref-23 . In addition, one of the most important issues, i.e., the possible formation of O vacancies and their effect on the atomic and electronic structures of PuO2 surfaces, remains completely unexplored.
Motivated by the above mentioned facts, in this paper, we systematically study the surface properties of PuO2. Specifically, we have addressed (i) the structural stabilities of the low-index PuO2(111), (110), and (001) surfaces based on the calculations of surface energies and surface relaxations, (ii) the surface electronic properties such as the surface work function and layer-projected density of the state (PDOS), and (iii) the effects of Pu-oxide thickness and O-vacancy on the surface stabilities and electronic structure properties.
This paper is organized as follows. The details of our calculations are described in Sec. II. In Sec. III we present and discuss the results. In Sec. IV, we summarize our main conclusions.
II Methodology of the calculation
II.1 DFT calculations
The DFT calculations are carried out using the Vienna ab initio simulation package Vasp with the frozen-core projector-augmented wave (PAW) pseudopotentials Blo ; Paw and plane-wave set. For the plane-wave set, a cut-off energy of eV is used. The plutonium 67665, and the oxygen 22 electrons are treated as valence electrons. The exchange and correlation effects are treated in both the LDA and the GGA Perdew , based on which the strong on-site Coulomb repulsion among the localized Pu 5f electrons is described by using the LDA/GGA+ formalisms formulated by Dudarev ref-11 ; ref-12 ; ref-13 . As concluded in some previous DFT studies ref-16 ; ref-17 ; ref-19 ; ref-21 , although the pure LDA and GGA fail to depict the electronic structure, especially the insulating nature and the occupied-state character of bulk AFM PuO2, the LDA/GGA+ approaches can capture the Mott insulating properties of the strongly correlated Pu 5 electrons adequately and well reproduce experimental ground-state parameters by tuning the effective Hubbard parameter at 4 eV. In this paper, the spherically averaged screened Coulomb energy and the exchange energy for the Pu 5 orbitals are set to be 4.75 and 0.75 eV respectively, which have been tested and applied in our previous studies of plutonium oxides ref-16 ; ref-17 ; ref-21 . For fluorite structure PuO2 of AFM, our calculated equilibrium lattice parameter = Å within GGA+ or = Å within LDA+ is in good agreement with the experimental value of Å ref-5 . Our extensive test calculations in this work indicate that the choice of can alter the electronic-structure properties of PuO2 surfaces, as well as those of bulk PuO2. Specifically, when is less than 2.0 eV, the results of the electronic density of state (DOS) indicate that PuO2 surfaces are metallic FM-conductor instead of the AFM Mott-insulators. The combination of =4.75 and =0.75 eV is also the optimum to well describe the electronic structure properties of the surfaces of PuO2, although the atomic structural optimizations seem to be insensitive to the choice of .
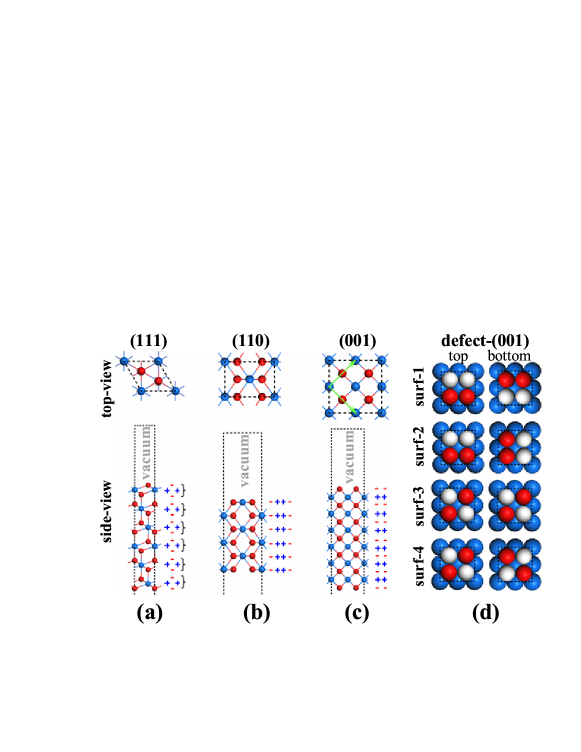
The low-index surfaces of PuO2 are modeled by finite-sized periodic supercells, consisting of a number of oxide layers infinite in and directions and separated in the direction by a vacuum of 30 Å. The Brillouin zone (BZ) integration is performed using the Monkhorst-Pack (MP) -point mesh Monk . Specifically, the two-dimensional (2D) unit cell with a -point MP grid is employed for the defect-free (ideal) PuO2(111) and (110) surfaces, and a supercell with a -point grid is used for the (001) surface. Examples of the initial slab configurations used in the calculation are shown in Figs. 1(a)-(c), which are obtained by truncating bulk PuO2 along the [111], [110] and [001] orientations, respectively. In the spin-polarized calculations with the AFM order set to be in a simple “ ” alternative manner along the direction, all atoms are fully relaxed until the Hellmann-Feynman forces are less than 0.01 eV/Å. Various convergence tests have been performed to ensure the above mentioned input parameters and models feasible and reasonable in our current calculations. The result thereof shows that the surface energy of a slab with certain thickness is converged within 3 meV/Å2. In this paper, for the convenience of depiction and plotting, we are using the number of Pu-cation layer in a PuO2 slab to represent its thickness. Thus, one can see in Figs. 1(a)-(c) that the ideal (111), (110), and (001) slabs have the same thickness tag, namely, = 6, and it is worth noting that in practice these slabs consist of 18, 6 and 13 atomic monolayers (MLs), respectively.
According to Tasker’s conclusion Tasker on the surface stabilities of ionic crystals, the side-view of three low-index PuO2 surfaces in Fig. 1 can reveal that the oxygen-terminated (111) surface, consisting of successive and electrically neutral “O-Pu-O”blocks, is the “Tasker-type-II ” surface, the (110) is the typical “type-I ” surface stacked with identical neutral planes fulfilling the PuO2 stoichiometry, and the (001) is the typical “type-III ” surface, consisting of oppositely charged planes. Generally, type-I and type-II are stable nonpolar surfaces, while type-III is unstable polar surface due to the dipole moment of the repeated unit in direction. The dipole moment may be quenched and the polar surface stabilized by a variety of methodsPolar-1 ; Polar-2 ; Polar-3 ; Polar-4 , including surface reconstruction, the presence of adsorbates, and changes in the surface electronic structure. In our present work, the polar (001) surface is modeled as two oxygen-terminated surfaces with 50% oxygen vacancies to fulfill the stoichiometric formula, and the different distributions of the 50% O-vacancy considered here are showed in Fig. 1(d). Besides above-mentioned three low-index surfaces, the Pu-terminated (111) surface generated by removing the outmost O layers of the O-terminated (111) surface has been found to be quite unstable and eventually become O-terminated through a significant reconstruction in the surface region due to the intense dipole-dipole interaction. In such stable structure, the upper layers resemble the -Pu2O3(0001) surface. Thus, we exclude the Pu-terminated (111) slab model and briefly name the O-terminated PuO2(111) surface as (111) surface if not mentioned differently.
The surface energy is the energy needed to produce a unit surface from a 3D infinite crystal and is one central quantity in the studies of the relative stability of different surfaces. In the DFT total-energy calculations of repeated slab-supercell geometries, can be written as
| (1) |
where is the total energy of the supercell with relaxed/unrelaxed slab, is the energy of the reference bulk with the same number of atoms, and the denominator is the total area of both surfaces of the slab with a finite thickness. Here, the convergence of the (i.e., in Eq.(1)) is mainly determined by two correlated factors, namely, the atomic structural relaxations in several outmost layers and the thickness of the slab model. For the surface structural relaxations, one can simply evaluate its contribution to by calculating the surface relaxation energy . The effect of the slab thickness should be highlighted especially when the slab consists of the complicated compounds such as the actinide oxides, and in addition, the work functions calculated with slab approximations are known to be depending on the slab thickness. Thus, in this work, both factors will be considered and discussed in detail.
II.2 Thermodynamic considerations
The DFT total-energy calculation gives only at zero temperature =, zero pressure =, and for the surface in contact with vacuum, which cannot be used to study the influence of the realistic environmental conditions at a specific and . To further study the relative stability of the PuO2 surfaces with various concentrations of surface vacancy () at finite and gas partial of the surrounding environment, we take the approach of “ atomic thermodynamics” abAT-1 ; abAT-2 to get the surface Gibbs free energy (,), with the general expression given by
| (2) |
where is the Gibbs free energy of the solid with the surface of interest, is the total surface area, , and are the particle number, the chemical potentials and the partial pressures of the various species. Here, the focus of our work is the relative stability of O-terminated PuO2 surfaces with different O-vacancy concentrations, thus only two chemical species need to be considered, namely iPu and O. In practice, the surface Gibbs energy difference between a defective PuO2 surface and the corresponding defect-free (ideal) surface is the important quantity required, which can be written as
| (3) |
where and are the Gibbs free energies of the supercells with the defective and ideal PuO2 surfaces, respectively, and is the total number of O vacancies on the PuO2 surface. In the present situation, the entropy and volume effects are small compared to the band energy in the Gibbs free energy and thus are neglected in our calculations. in Eq. (3) is the oxygen chemical potential under partial pressure and for ideal oxygen-gase we can use the well-known thermodynamic expression abAT-2
| (4) |
where is the total energy of the oxygen molecule. For the standard pressure atm, the values of have been tabulated in Ref. 40. If we refer the to , then the allowed range for the is given by
| (5) |
where is the formation energy of bulk PuO2, namely, .
To determine reasonable ranges of , the -Pu is considered as reference system to calculate the formation energy of bulk PuO2. Since the spin-orbit coupling (SOC) is important for certain properties of heavy-metal compounds, we also include SOC effect in the calculations of and . Finally, we restrict to eV based on the GGA+ and eV based on the GGA++SOC. The effect of spin polarization has been included in calculating .
III Results and discussion
III.1 Surface energy and structural relaxation
First, the relative stability of the low-index PuO2 surfaces is studied based on the systematic calculation of surface energy and the detailed analysis of structural relaxation. Furthermore, the effects of slab thickness on both surface stability and relaxation are considered and discussed. In the following text, we first present the results of non-polar (111) and (110) surfaces, and then the polar (001) surface.
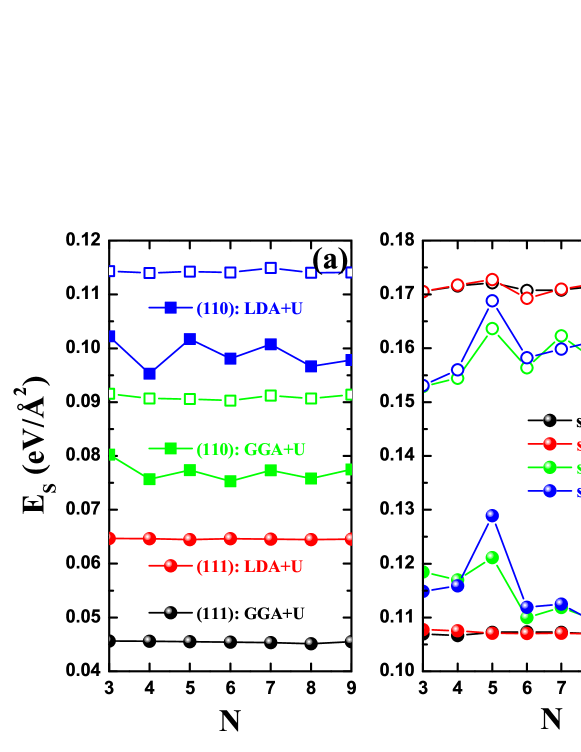
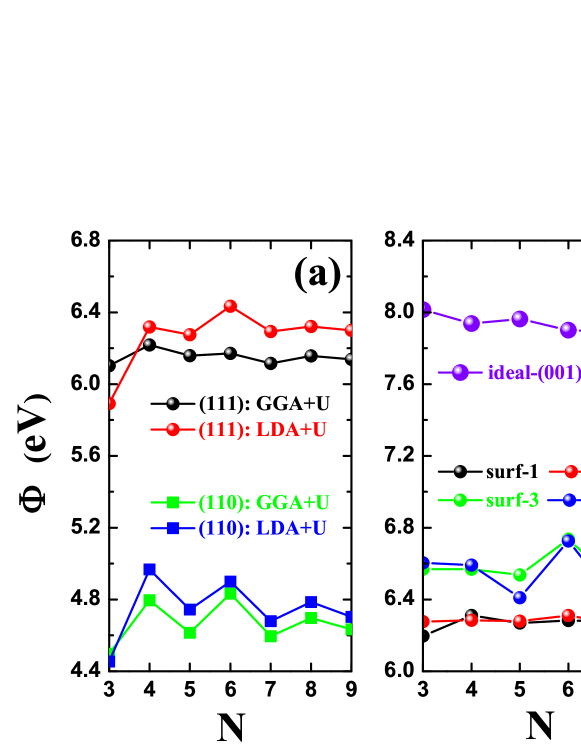
The calculated surface energy for fully relaxed (111) and (110) slabs as a function of the thickness is illustrated in Fig. 2(a). Obviously, both the GGA+ and LDA+ calculations give the consistent results that the (110) surface energy is much higher than the (111) surface energy. Generally, the calculated for (110) is 42% with GGA+ (or 33% with LDA+) higher than for (111). Therefore, the PuO2(111) surface is much more stable than the “more open” (110) surface with relatively higher concentration of the surface dangling bonds. For these two non-polar surfaces, Fig. 2(a) furthermore shows two points worthy of special notice and further discussion: (i) Despite the large difference in their respective between GGA+ and LDA+ calculations, the upper value (i.e., the LDA+ result) of the (111) surface is notably smaller than the lower value (i.e., the GGA+ result) of the (110) surface; (ii) The of the (111) surface is insensitive to the thickness with steady values (0.045eV/Å2 for GGA+ and 0.065eV/Å2 for LDA+), whereas for the (110) surface the evolution of as a function of slab thickness shows an oscillating behavior, which indicates excellent agreement between LDA+ and GGA+.
For the DFT energetic studies of solid materials, it is well known that the GGA calculation usually underestimates the experimental value and on the contrary the LDA often reports overestimated results for many physical quantities, amongst which the surface energy is a typical one. These opposite deviations from the experimental measurement have been attributed to the “overbinding” character of LDA and the consequent overcorrection of this defect in GGA GC-1 ; GC-2 . However, we are more interested in comparing the relative stabilities of different surfaces than in assessing the different performances of LDA and GGA functionals, especially in the absence of the experimental data. As far as we are aware, a few existing DFT calculations have given a similar trend in LDA- and GGA- results of metal oxides. For example, the LDA- results are 35% and 22% higher than the GGA results for CeO2(111) and (110) surfaces CeO2 , respectively, while for MgO(001) surface the LDA- is 25.8% higher than the GGA- with the experimental values positioned in between. Here, based on the above-mentioned point (i), we are positive that the experimental observation will agree on the prominent stability of the PuO2(111) surface.
We now turn our attention to the evolution with the slab thickness of the surface energies in Fig. 2(a). As is known, for a certain cleaved surface, the consequent structural relaxation is an effective way to minimize the surface cleavage energy, corresponding to the , with the contribution defined as the surface relaxation energy =. For (111) surface, the (not plotted here) is very close to the , producing a quite small less than 1.0 meV/Å2, and the thickness effect on the surface relaxation can be neglected. From Fig. 2(a), one can see that the of (110) surface is clearly larger than the corresponding with their difference () being higher than meV/Å2. Additionally, we find that the is to some extent insensitive to the slab thickness, thus the oscillating behavior of is tied up to the dependence of upon the slab thickness.
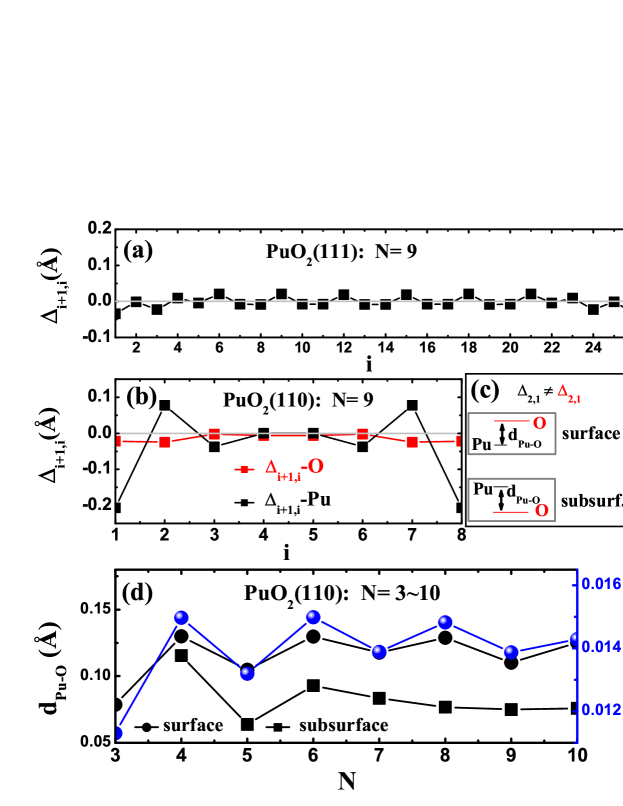
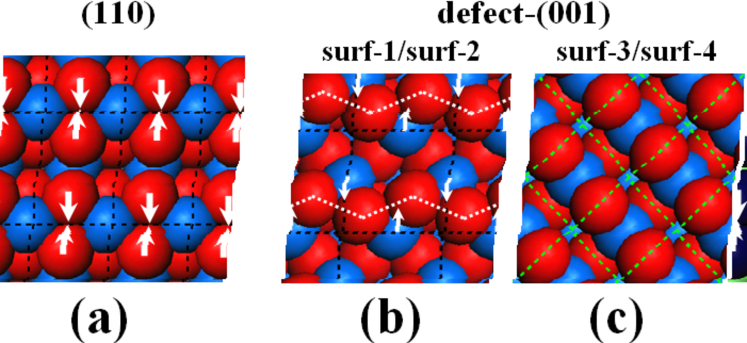
In order to draw a clear comparison of the surface relaxation between (111) and (110) surfaces and gain a detailed understanding of the oscillating behavior of (110)-, it proves to be quite necessary to discuss the surface structures undergoing full relaxations. Figures 3(a) and 3(b) show the interlayer relaxations along the directions perpendicular to the (111) and (110) surfaces respectively. Here the interlayer relaxation is given by the optimized interlayer distance in a relaxed slab compared to the bulk interlayer distance along the corresponding direction. Obviously, the signs and of indicate expansion and contraction of the interlayer spacing respectively. The stacking sequence of the (111) slab with = consists of 9 “O-Pu-O” blocks, and therefore this (111) slab contains totally 27 atomic monolayers (MLs). One can see from Fig. 3(a) that the interlayer relaxations are really small, so that the shrinkage ratio of the thickness is only 0.25%. The (110) slabs used in Fig. 3(b) contain 9 atomic MLs with two oxygen and one plutonium atoms per 11 cell being coplanar. Figure 3(b) shows that (i) the interlayer relaxations in the (110) surface region of a few atomic layers are prominently larger than those of the (111) surface in Fig. 3(a); (ii) the interlayer relaxations of Pu sublattice are larger than the oxygen sublattice, which is especially apparent in the outmost two layers. Such mismatch of the relaxations between O- and Pu-sublattices gives rise to the vertical displacement between O and Pu atoms which are coplanar in the unrelaxed (110) slab. Figure 3(c) gives a sketch map of the in the surface and subsurface layers as a result of the mentioned mismatch: -Pu -O. One can see that due to the nonzero , cation-anion dipoles with inverse orientations are generated in the surface and subsurface respectively. Strictly speaking, the relaxed (110) surface is now not a nonpolar surface for Pu and O species. As we are aware, this observable surface polarization of PuO2(110) slab induced by the structural relaxation is in good agreement with previous DFT calculation ref-23 . Besides the interlayer (vertical) relaxation, the inplane (lateral) relaxation of the surface layer (see Fig. 4(a)) tends to shorten the Pu-O bond on the surface by driving two nearest-neighbor oxygen atoms (bonding to the same Pu atom) to close up by Å, leading to the formation of O-O dimers on the (110) surface. Furthermore, we have found that the vertical displacement shows an oscillating behavior with the increasing slab thickness while the structure of the inplane O-O dimers is to some extent insensitive to the slab thickness. To reveal a clear-cut relationship between the structural relaxation and the corresponding released energy , we plot the (in both surface and subsurface) and as functions of the slab thickness in Fig. 3(d). One can see that the oscillating behaviors of and are quite in-phase, indicating that the oscillations of of (110) surface as a function of slab thickness originate from the interlayer relaxation.
The ideal PuO2(001) surface (see Fig. 1(c)) is an unstable polar surface with an overall dipole field. However, it is found that 50% surface O vacancies in our defective (001) slab models (see Fig. 1(d)) can effectively quench the dipole field and stabilize the surface. Considering that a half oxygen vacancies can usually induce the significant surface reconstruction, here we first carry out the first-principles molecular dynamic (FPMD) simulations based on GGA+ within the micro-canonical ensemble to sufficiently optimize the defect-(001) surface structures and then calculate their zero-temperature surface energies. From the result (including and ) presented in Fig. 2(b) as a function of the slab thickness , one can see that with increasing , the for the four defect-(001) surface models converges to eV/Å2, which is still notably larger than that of the (110) surface. Interestingly, according to the results of , surf-3 and surf-4 slab models are a bit less stable than surf-1 and surf-2 in the whole range of slab thickness that we considered. However, the values of for surf-3 and surf-4 models are lower than those for surf-1 and surf-2 models mainly due to the two different distributions of the surface oxygen vacancies, namely, the missing-row and uniform types in surf-1/surf-2 and surf-3/surf-4 respectively.
After the structural optimization by the FPMD simulations, for all four defect-(001) surface models with , the surface oxygens as well as the subsurface oxygens beneath relax inward by Å and Å respectively, while the subsurface oxygens without surface oxygen above relax outward by Å. For surf-1/surf-2, the Pu-sublattice relaxes inward by Å, on the contrary, the Pu-sublattice relaxes outwards by Å for surf-3/surf-4. Accompanied with a slight discrepancy in vertical relaxations of the Pu-sublattice for surf-1/surf-2 and surf-3/surf-4, it is found that the difference in for these two types of (001) terminations is mainly caused by the distinguishing inplane (lateral) relaxations of subsurface Pu-sublattices, which are sketched in Figs. 4(b) and 4(c). For surf-1/surf-2, the Pu atoms bonding to the same surface oxygen atom relax to close up by Å and this periodic lattice distortion consequently provoke the zigzag manner reconstruction of surface oxygen-lattice from the initial linear chain. Interestingly, this peculiar reconstruction was experimentaly observed in the defective polar (001) surface of uranium dioxide UO2 with 50% oxygen vacancies UO2-zigzag . However, because of the uniform distribution of the surface O-vacancies, the Pu and O atoms in surf-3/surf-4 keep lateral inaction. For the defective (001) surfaces, our current results show that both the slab thickness and the distributions of the surface O-vacancies can notably impact the surface stability, and there may be several more stabilizing mechanisms coexisting on the polar (001) surface.
III.2 Surface electronic structure and work function
The bulk PuO2 is considered to be the AFM Mott insulator according to the experimental report ref-10 . Here the atom-projected density of the electronic states (PDOSs) for the Pu and oxygen atoms in the bulk PuO2 and on the relaxed (111), (110), and defect-(001) surfaces are shown in Fig. 5. Since the GGA+ and LDA+ give the similar description of the PDOS, here we only plot the GGA+ results. The orbital-resolved PDOS of the bulk PuO2 at the ground state has been calculated and analyzed in detail by previous DFT+ ref-16 ; ref-18 ; ref-19 ; ref-21 and hybrid DFT ref-4 ; ref-14 studies, and those theoretical results of DOS are usually tested by comparing with the experimental photoelectron spectroscopy (PES) measurements ref-6 ; ref-7 .
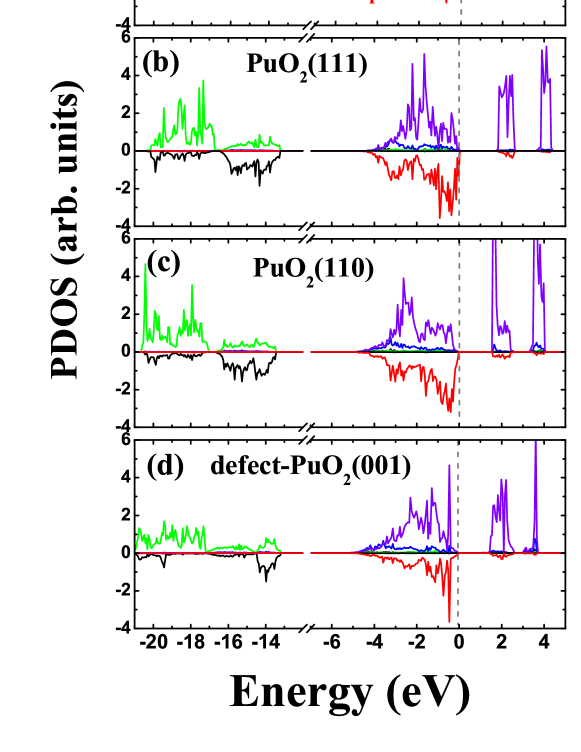
Here, we replot the PDOS of the bulk PuO2 with AFM phase as a benchmark for those of the Pu-O atoms on different PuO2 surfaces, aiming at finding significant influence in the electronic structure by the inclusion of surface effect. The PDOS of bulk PuO2 in Fig. 5(a) demonstrates the following features: (i) Above the Fermi level, the insulating band gap is about eV, which is in good agreement with the experimental measurement ref-6 ; (ii) Below the Fermi level the highest occupied band (HOB) with a range of to eV is mainly the (Pu)-(O) hybridization, with little contributions from and states of Pu; (iii) The lower occupied band (LOB) with a range of to eV consists of Pu- and O- states.
From the surface DOS in Fig. 5, one can see that the PDOS distribution for the (111) surface shows a close resemblance to the case of the bulk PuO2, specifically, the similarities in the insulating band gap and the structures of Pu- state with two pronounced peaks are so strong that the slight contraction and shift-up of the HOB are almost covered up. For the (110) surface, the insulating band gap reduces to eV, and particularly, the two-peak structure of Pu- disappears mainly due to the existing surface polarization with nonzero , which modifies the crystal symmetry of the oxide surface layer. For the (001) surface, since the surface layer of surf-1 slab model used in Fig. 5(d) is not the stoichiometric PuO2 but the ‘Pu-O’, the insulating band gap further reduces to eV, and a sharp peak of Pu- state emerges below the Fermi level, which implies the increase in the localized correlation of the Pu- electronic state due to the presence of oxygen vacancies. These facts suggest that the surface effect of PuO2 upon the electronic structure of the bulk phase appears to be insignificant for the stable (111) surface, to some extent significant for the (110) surface, and remarkable for the defect-(001) surface. In order to be able to theoretically reproduce the whole PES spectra of PuO2 layers by the right description of the complex behavior of Pu- state, there is clearly much left to be done.
In addition to the PDOS, we have also calculated the work function of low-index PuO2 surfaces, and plotted them in Fig. 6. The work function is the minimum energy required to remove an electron from the surface to the vacuum and can be written as , where is the planar-averaged electrostatic potential in the middle of the vacuum and is the Fermi energy of the system. Therefore, work function is one fundamental physical quantity for the surface reactivity. Furthermore, a modified or tunable can be useful for applications such as catalysis, because a slight change in the energy scale is exponentially amplified for chemical reactions.
From Fig. 6(a), one can see that the of stable (111) surface with an average value of eV (GGA+) or eV (LDA+) is much higher than that of the (110) surface with an average value of eV (GGA+) or eV (LDA+). Thus, for nonpolar surfaces, stable (111) surface will show its inertness in the surface chemical reactions, and the more open (110) surface is expected to be chemically active. Figure 6(a) also demonstrates the convergence behavior of as a function of the slab thickness. Here, it is found that the GGA+ and LDA+ results of are in general agreement. For the stable (111) surface, the work function shows less responsiveness to the thickness effect, as well as its surface energy in Fig. 2(a). On the contrary, both and of the (110) surface are sensitive to the slab thickness with a convergent oscillation. Combining with the surface relaxation results given in Fig. 3(d), one can conclude that the thickness effect modifies both the surface stability and surface chemical activity through the structural relaxations. Usually, the thickness of the oxide film formed on Pu metal during stockpile process is typically of nanometer scale. Thus, our present finding of thickness-selective surface activity may help to deepen the understanding of the microscopic mechanisms for the chemical reaction of small molecules (such as water) on oxidized Pu surfaces, which is fundamental to the safety issue of nuclear industry. Interestingly, a recent DFT study MgO has reported that the thickness effect of MgO film can be used to control the dissociation of water molecule on surface.
For the case of the polar (001) surface shown in Fig. 5(b), the work function is mainly dominated by the strength of the anion-cation dipole, which impedes the escape of electrons. Therefore, one can see that the work function of the ideal (001) surface is close to eV, which is much higher than that of the defect-(001) surfaces with an average value of eV. Due to the significant influence of the existing dipole on the (001) surface, it is not reasonable to compare its surface chemical activity with ideal (110) or (111) non-polar surface merely via the surface work function.
III.3 Effect of oxygen vacancy
In this section, we focus on the effect of O-vacancy with various concentrations upon the surface activity and surface relative stability by using the static GGA+ calculation and the approach of “ atomistic thermodynamics”. Here, our current study is mainly driven by the following motivations: (i) to explain the difference in the surface chemical activity between PuO2 and -Pu2O3, as mentioned in Sec-I; (ii) to discuss the mechanism of creating surface oxygen-vacancy in the cancelation of the polarity for PuO2(001) surface; and (iii) to explore the stable surface phase of PuO2 in an oxidizing environment. Amongst these listed issues, the O-vacancy is obviously the major factor.
In the calculation, to eliminate the thickness effect of the PuO2 slab, we employ (111), (110), and (001) slabs with , , and respectively. The various concentrations of oxygen vacancy () are modeled by removing different amounts of oxygen atoms from ideal slabs with a series of surface unit cells. Here, is the ratio between the number of O-vacancies and the total number of O atoms on the ideal surface layer. Specifically, for the (111) surface, slabs of and unit cells are employed to create of , , , , , and . For the (110) surface, slab of unit cells is used to create of , , , and . For the (001) surface, slab of unit cells can create of , , , and .
Before the discussion on the evolution of work function as a function of , we first present the O-vacancy effect upon the structural relaxation of the (111) slab. The static calculation demonstrates that the (111) surface with on-surface O-vacancy is slightly preferred in total energy when 1/2. However, when 1/21, the subsurface oxygen atoms, each of which sharing the same unit surface cell with one certain surface oxygen, will break through the above Pu-terminated layer to form a complete O-terminated surface, leaving the subsurface O-vacancies at their former sites. Therefore, when 1/2, all the on-surface O-vacancies will convert to be the subsurface O-vacancies by a significant reconstruction.
| =0 | =1/9 | =1/4 | =1/2 | =3/4 | =1 | |
|---|---|---|---|---|---|---|
| (111): on-surface | 6.19 | 5.09 | 4.35 | 4.07 | — | — |
| (111): subsurface | 6.19 | 5.36 | 5.18 | 4.87 | 4.49 | 2.57 |
| (110): on-surface | 4.70 | — | 3.84 | 3.57 | 2.80 | 2.44 |
| (001): on-surface | 7.93 | — | 7.24 | 6.63 | 4.68 | 3.25 |
The GGA+ calculated work function of (111), (110), and (001) surfaces for different values of is listed in Table I, where the “on-surface” and the “subsurface” denote the initial pure on-surface and subsurface distributions of O-vacancies for the (111) surface. One can see from Table I that for all three surfaces the work function will monotonically reduce with increasing Cv. Therefore, the introduction of O-vacancy can prominently enhance the surface chemical activity of non-polar (111) and (110) surfaces. For instance, the work function of the ideal (111) surface is eV, while a low = of on-surface O-vacancy can effectively depress the work function by eV and efficiently amplify the probability of the chemical reaction between the PuO2(111) surface and other small gaseous molecules such as H2 and H2O, which will be investigated in our next work. This result can be also extended to explain the significant difference in the chemical activities between PuO2 and -Pu2O3, the latter has been found in experiment Has2000 to be more active in interacting with small molecules.
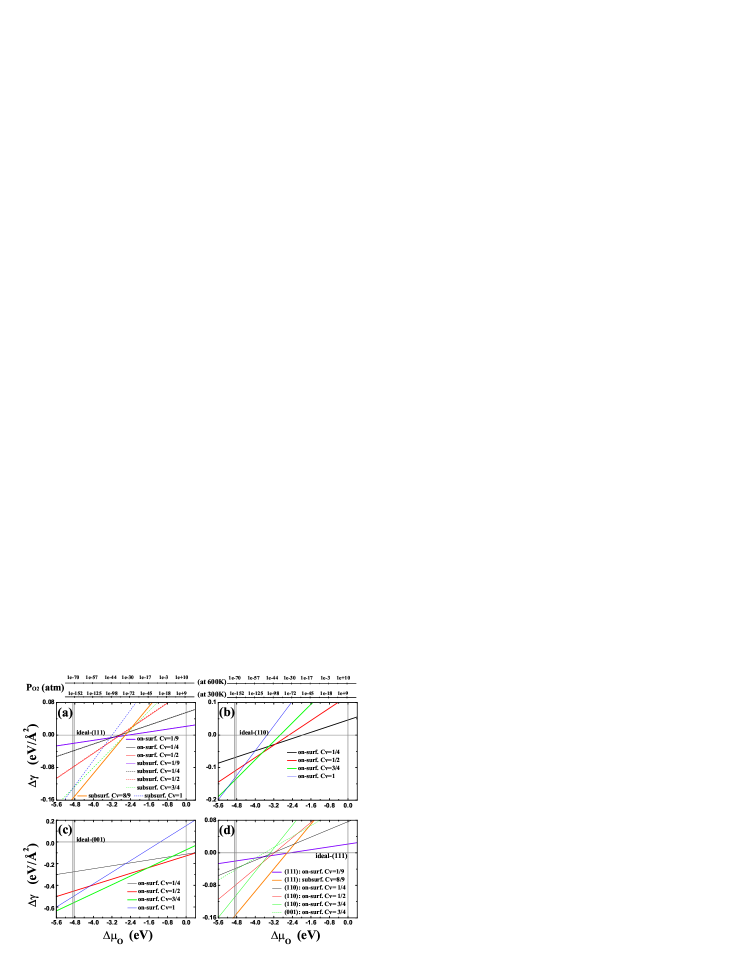
Assuming that the PuO2 surface is in equilibrium with an external oxygen environment and translating the oxygen chemical potential into temperature and pressure conditions according to Eq. (3) and Eq. (4) respectively, we first discuss effect of the O-vacancy upon the relative stability of one certain surface. Figures 7(a)-(c) present the Gibbs surface free energy difference of (111), (110) and (001) surfaces respectively. Here the is calculated by Eq. (3) with the corresponding ideal surface as the reference system. For the (111) surface, from Fig. 7(a) one can see that (i) the ideal, vacancy-free (111) surface is the most stable structure under the oxygen rich conditions with eV; (ii) then defect-(111) surface with on-surface O-vacancy of becomes stable within a very narrow range of eV; (iii) for further reducing environment with eV, the defect-(111) surface with subsurface O-vacancy of high = becomes the most stable.
For the (110) surface, Fig. 7(b) shows that (i) the ideal (110) surface is most stable within the range of the eV; (ii) the defect surface with = becomes most stable within eV; (iii) the defect surface with = in succession becomes most stable when eV; (iv) the defect surface with = becomes most stable when eV, and the Pu-terminated (110) surface with = is not a stable surface phase in the whole range of the allowed .
From the results of polar-(001) surface in Fig. 7(c), we have found that (i) under the O-rich conditions, the ideal (001) surface is unstable, however the surface O-vacancies can efficiently stabilize the polar surface (ii) when eV, the defect-(001) surface with = is the optimal surface structure; (iii) within the whole allowed range of , the Pu-terminated (001) surface is unstable so as the vacancy-free O-terminated (001) surface.
We collect all the stable surface phases from Fig. 7(a)-(c), and summarize them in Fig. 7(d) by taking the ideal (111) surface as the reference structure. One can see that the ideal (111) surface, defect-(111) surface with low on-surface O-vacancy concentration of = and with high sub-surface = are the stable surface structures. That is to say, the ideal (111) surface is stable under the oxygen-rich conditions, while for an oxygen-reducing environment the (111) surface with nearly one monolayer subsurface oxygen removed become stable, and the on-surface oxygen vacancy with low of can minimize the Gibbs surface energy in a very narrow range of .
| =1/9 | =1/4 | =1/2 | =3/4 | =8/9 | =1 | |
|---|---|---|---|---|---|---|
| (111): on-surface | 2.49 | 2.85 | 2.83 | — | — | — |
| (111): subsurface | 2.54 | 2.89 | 2.87 | 2.63 | 2.63 | 3.20 |
| (110): on-surface | — | 1.96 | 2.54 | 2.93 | — | 3.50 |
| (001): on-surface | — | -3.38 | -1.93 | -0.73 | — | 1.11 |
In Table II, we have listed the O-vacancy formation energies , which can be defined as , where is the total number of the O-vacancy in a defective slab, , and are the total energies of the defective slab, ideal slab and a free oxygen molecule, respectively. One can see for the (111) surface that the does not show considerable change except in the extreme case of = 1 with a maximum value = eV. On the contrary, the of the (110) surface is sensitive to the , namely, the monotonically increases with increasing , indicating a notable interaction between the vacancies. Finally, the polar (001) surface is a special case. The minus indicates that the formation of surface O-vacancy is an exothermic process, and at the same time stabilizes the polar surface. However the also monotonically increases with the and rises to eV when .
IV Conclusions
To conclude, we have systematically studied the basic surface properties of low-index PuO2(111), (110), and (001) surface by means of the first-principles DFT calculations within the LDA+ and GGA+ frameworks. The defect-free O-terminated (111) surface is found to be most stable, possessing the lowest Es that is insensitive to the thickness of the film. The surface energy of the non-polar (110) surface is 33% to 42% higher than that of the (111) surface, accompanying with an oscillating behavior with the film thickness. The polar (001) surface has been modeled using 50% oxygen vacancies to cancel the polarity. The residual surface oxygen atoms have been found to reconstruct in a zigzag manner along the 100 direction. In connected with the relative order of stability for these three low-index surfaces, our calculated surface electronic structures have displayed from insignificant to remarkable deviation from the bulk case. The work function has also been systematically investigated, and a high value of about eV for the most stable (111) surface indicates its low chemical activity. Remarkably, this value can be reduced to eV with 25% oxygen-vacancy present on the surface. This conclusion can be used to explain the difference in the surface chemical activities between PuO2 and -Pu2O3.
We have also investigated the surface thermodynamics in an oxygen environment. Our results have indicated that under oxygen-rich conditions, the stoichiometric (111) surface is most stable. Under oxygen-reducing conditions, the on-surface O-vacancy of low concentration = can slightly minimize the Gibbs surface energy of (111) in a narrow range of the oxygen chemical potential . For the highly reducing conditions, the (111) surface with nearly one monolayer subsurface oxygen removed ( = ) becomes most stable, where the upper layers resemble the -Pu2O3(0001) surface. Based on these systematic results, our current study may provide a guiding line to understand various chemical properties and processes occurred on PuO2 surfaces.
Acknowledgements.
This work was supported by NSFC under Grant No. 51071032, and by the Foundations for Development of Science and Technology of China Academy of Engineering Physics under Grants Nos. 2010B0301048 and 2011A0301016.References
- (1) S. Heathman, R. G. Haire, T. Le Bihan, A. Lindbaum, M. Idiri, P. Normile, S. Li, R. Ahuja, B. Johansson, and G. H. Lander, Science 309, 110 (2005).
- (2) I. D. Prodan, G. E. Scuseria, and R. L. Martin, Phys. Rev. B 76, 033101 (2007).
- (3) R. Atta-Fynn and A. K. Ray, Phys. Rev. B 76, 115101 (2007).
- (4) K. T. Moore and G. van der Laan, Rev. Mod. Phys. 81, 235 (2009).
- (5) J. M. Haschke, T.H. Allen, and L.A. Morales, Science 287, 285 (2000).
- (6) M. T. Butterfield, T. Durakiewicz, E. Guziewicz, J. Joyce, A. Arko, K. Graham, D. Moore, and L. Morales, Surf. Sci. 571, 74 (2004).
- (7) Gouder, A. Seibert, L. Havela, and J. Rebizant, Surf. Sci. 601, L77 (2007).
- (8) J.M. Haschke, Los Alamos Science 26, 253 (2000).
- (9) M. T. Butterfield, T. Durakiewicz, I. D. Prodan, G. E. Scuseria, E. Guziewicz, J. A. Sordo, K. N. Kudin, R. L. Martin, J. J. Joyce, A. J. Arko, K. S. Graham, D. P. Moore, and L.A. Morales, Surf. Sci. 600, 1637 (2006).
- (10) P. A. Korzhavyi, L.Vitos, D. A. Andersson and B. Johansson, Nature Mater. 3, 225 (2004).
- (11) C. E. Boettger and A. K. Ray, Int. J. Quantum Chem. 90, 1470 (2002).
- (12) C. McNeilly, J. Nucl. Mater. 11, 53 (1964).
- (13) S. L. Dudarev, D. N. Manh, and A. P. Sutton, Philos. Mag. B 75, 613 (1997).
- (14) S. L. Dudarev, G. A. Botton, S. Y. Savrasov, C. J. Humphreys, and A. P. Sutton, Phys. Rev. B 57, 1505 (1998).
- (15) S. L. Dudarev, M. R. Castell, G. A. Botton, S. Y. Savrasov, C. Muggelberg, G. A. D. Briggs, A. P. Sutton, and D. T. Goddard, Micron 31, 363 (2000).
- (16) I. D. Prodan, G. E. Scuseria, J. A. Sordo, K. N. Kudin, and R. L. Martin, J. Chem. Phys. 123, 014703 (2005).
- (17) L. Petit, A. Svane, Z. Szotek, W. M. Temmerman, and G. M. Stocks, Phys. Rev. B 81, 045108 (2010).
- (18) Q. Yin and S. Y. Savrasov, Phys. Rev. Lett. 100, 225504 (2008).
- (19) B. Sun, P. Zhang, and X.-G. Zhao, J. Chem. Phys. 128, 084705 (2008).
- (20) S. Bo and Z. Ping, Chin. Phys. B 17, 1364 (2008).
- (21) D. A. Andersson, J. Lezama, B. P. Uberuaga, C. Deo, and S. D. Conradson, Phys. Rev. B 79, 024110 (2009).
- (22) G. Jomard, B. Amadon, F. Bottin, and M. Torrent, Phys. Rev. B 78, 075125 (2008).
- (23) H. Shi, M. Chu, and P. Zhang, J. Nucl. Mater. 400, 151 (2010).
- (24) P. Zhang, B.-T. Wang, and X.-G. Zhao, Phys. Rev. B 82, 144110 (2010).
- (25) M. V. G. Pirovano, A. Hofmann, and J. Sauer, Surf. Sci. Rep. 62, 219 (2007).
- (26) X. Wu and A. K. Ray, Physica B 301, 359 (2001).
- (27) X. Wu and A. K. Ray, Phys. Rev. B 65, 085403 (2002).
- (28) G. Kresse and J. Furthmüller, Phys. Rev. B 54, 11169 (1996).
- (29) P.E. Blöchl, Phys. Rev. B 50, 17953 (1994).
- (30) G. Kresse and D. Joubert, Phys. Rev. B 59, 1758 (1999).
- (31) J. P. Perdew, J. A. Chevary, S. H. Vosko, K. A. Jackson, M. R. Pederson, D. J. Singh, and C. Fiolhais, Phys. Rev. B 46, 6671 (1992).
- (32) H. J. Monkhorst and J. D. Pack, Phys. Rev. B 13, 5188 (1976).
- (33) P. W. Tasker, Solid State Phys. 12, 4977 (1979).
- (34) H.-J. Freund, H. Kuhlenbeck, and V. Staemmler, Rep. Prog. Phys. 59, 283 (1996).
- (35) C. Noguera, J. Phys.: Condens. Matter 12, R367 (2000).
- (36) C. Noguera and J. Goniakowski, J. Phys.: Condens. Matter 20, 264003 (2008).
- (37) C. Franchini, V. Bayer, R. Podloucky, G. Parteder, S. Surnev, and F. P. Netzer, Phys. Rev. B 73, 155402 (2006).
- (38) M. W. Finnis, Phys. Status Solidi A 166, 397 (1998).
- (39) K. Reuter and M. Scheffler, Phys. Rev. B 65, 035406 (2001).
- (40) NIST-JANAF Thermochemical Tables, 4th ed., edited by J. Chase (American Chemical Society, Washington, DC, 1998).
- (41) J. P. Perdew, A. Ruzsinszky, G. I. Csonka, O. A. Vydrov, G. E. Scuseria, L. A. Constantin, X. Zhou, and K. Burke, Phys. Rev. Lett. 100, 136406 (2008).
- (42) P. Söderlind and A. Gonis, Phys. Rev. B 82, 033102 (2010).
- (43) T. N. Taylor, W. P. Ellis, Surf. Sci. 107, 249 (1981).
- (44) M. Fronzi, A. Soon, B. Delley, E. Traversa, and C. Stampfl, J. Chem. Phys. 131, 104701 (2009).
- (45) N. V. Skorodumova, M. Baudin, and K. Hermansson, Phys. Rev. B 69, 075401 (2004).
- (46) H. Idriss, Surf. Sci. Rep. 65, 67 (2010).
- (47) J. Jung, H.-J. Shin, Y. Kim, and M. Kawai, Phys. Rev. B 82, 085413 (2010).