Nuclear X-ray properties of the peculiar radio-loud hidden AGN 4C+29.30
Abstract
We present results from a study of a nuclear emission of a nearby radio galaxy, 4C+29.30, over a broad 0.5–200 keV X-ray band. This study used new XMM-Newton ( ksec) and Chandra ( ksec) data, and archival Swift/BAT data from the 58-month catalog. The hard ( keV) X-ray spectrum of 4C+29.30 can be decomposed into an intrinsic hard power-law () modified by a cold absorber with an intrinsic column density cm-2, and its reflection () from a neutral matter including a narrow iron K emission line at the rest frame energy keV. The reflected component is less absorbed than the intrinsic one with an upper limit on the absorbing column of cm-2. The X-ray spectrum varied between the XMM-Newton and Chandra observations. We show that a scenario invoking variations of the normalization of the power-law is favored over a model with variable intrinsic column density. X-rays in the 0.5–2 keV band are dominated by diffuse emission modeled with a thermal bremsstrahlung component with temperature keV, and contain only a marginal contribution from the scattered power-law component. We hypothesize that 4C+29.30 belongs to a class of ‘hidden’ AGN containing a geometrically thick torus. However, unlike the majority of them, 4C+29.30 is radio-loud. Correlations between the scattering fraction and Eddington luminosity ratio, and the one between black hole mass and stellar velocity dispersion, imply that 4C+29.30 hosts a black hole with M⊙ mass.
Subject headings:
galaxies: active — galaxies: individual (4C+29.30) — X-rays: galaxies — accretion, accretion disks1. Introduction
4C+29.30 is a low-redshift () radio source with a moderate radio luminosity erg s-1 (Siemiginowska et al. 2012) hosted by an elliptical galaxy. It was first studied in the radio and optical bands by van Breugel et al. (1986). Observed complex radio morphology was resolved into jets, knots, lobes, and a diffuse tail. A number of optical emission lines were measured, and their relative intensities indicated photoionization by a non-stellar continuum attributed to the central active galactic nucleus (AGN). The radio emission and the optical line emitting gas were found to be strongly linked suggesting interaction between the radio source and its environment. In addition, shells and dust lanes observed in the optical band (van Breugel et al. 1986) provide evidence of a past merger with a gas-rich disk galaxy which possibly triggered the rejuvenated AGN activity. Subsequently, follow-up radio studies revealed radio structures with diverse spectral ages suggesting an intermittent nature of the radio source in 4C+29.30. Jamrozy et al. (2007) presented evidence for a large scale extended relic radio emission most probably due to an earlier cycle of activity of the source Myr ago. The age of a small-scale radio structure embedded in the extended relic radio emission was estimated at Myr, with the inner double knots of a spectral age of Myr (Jamrozy et al. 2007). Liuzzo et al. (2009) resolved the very central region of the source into two nuclear knots with spectral ages of yr and yr. 4C+29.30 was cataloged as an infrared point-source by the IRAS, WISE and 2MASS surveys (NASA/IPAC Infrared Science Archive).
The first detection of the source in the X-ray band occurred during a snap-shot 8 ksec Chandra observation (Gambill et al. 2003). The short exposure time and few detected counts prevented detailed spectral analysis. Nevertheless, this pilot observation hinted towards a complex X-ray morphology composed of a nucleus, hotspots, a putative jet, and diffuse emission. The source was not a target of X-ray pointings prior to the first Chandra observation, without detection in, e.g., the ROSAT All Sky Survey, probably due to significant intrinsic absorption (Gambill et al. 2003, Siemiginowska et al. 2012). In 2008, we observed 4C+29.30 with XMM-Newton for ksec. This observation was followed by our deep 300 ksec Chandra exposure (Siemiginowska et al. 2012, hereafter Paper I) which clearly revealed diverse X-ray emitting structures, many of which correspond to those in radio or optical bands, and others are intrinsic to the X-ray band. The soft 0.5–2 keV X-ray image showed northern and southern lobes, hotspots, southern jet, and thermal diffuse emission in the center. Emission in the hard X-ray band (above 2 keV) was instead dominated by the active nucleus of 4C+29.30. In Paper I, our discussion focused on the spectral properties of the soft X-ray components, the structure of the outflow, and interactions of the X-ray jet with the interstellar medium. We emphasized similarities between 4C+29.30 and famous radio galaxies showing jet-ambient medium interactions, i.e. M87 (e.g., Million et al. 2010), NGC 1275 (e.g., Fabian et al. 2011), and Cen A (e.g., Morganti et al. 2010, and references therein).
In the present paper, we focus on detailed modeling of the X-ray core emission to uncover the nature of the AGN powering 4C+29.30. We analyze new Chandra data and archival Swift/BAT data from the 58-months catalog (Baumgartner et al. 2010), and thus we study the core emission over a broad 0.5–200 keV X-ray band. We apply our best fit model to our new XMM-Newton observations of 4C+29.30 taken years before our Chandra observation. We search for signatures of the X-ray spectral variability between the Chandra and XMM-Newton observations. The paper is organized as follows. In Section 2 we describe our data and provide details on the preparation of the spectra for modeling. In Section 3 we test various spectral scenarios for AGN X-ray activity. We compare the best fitting Chandra and XMM-Newton models in order to study the origins of possible spectral variability. In Section 4 we present the discussion of our results indicating that 4C+29.30 is a strongly absorbed intrinsically X-ray variable AGN with Seyfert 2 type of activity and a peculiar obscuring geometry, probably due to a geometrically thick torus similar to that reported for several Swift/BAT selected AGN (e.g., Ueda et al. 2007; Winter et al. 2009a,b). Finally, in Section 5 we summarize and conclude our study. Throughout the paper we adopt , and km s-1 Mpc-1 for the flux-luminosity transformations.
2. X-ray observations
2.1. XMM-Newton
Our XMM-Newton observation of 4C+29.30 was performed on Apr 11, 2008. It was split in two pointings lasting ksec (ID: 0504120101) and ksec (ID: 0504120201). No science data were produced during the second pointing. The data reduction of the ksec long observation was performed following the standard procedure111http://xmm.esac.esa.int/sas/current/documentation/threads/ with the XMM-SAS v. 11.0.0 package using the updated calibration files (Oct 2011). We constructed light curves at energies above 10 keV to identify periods of high background flaring. After cleaning the data, we obtained the following net exposures and 0.5–10 keV observed count rates: ksec and cnt s-1 for the EPIC/PN camera, ksec and cnt s-1 for MOS1, and ksec and cnt s-1 for MOS2. In this paper we will limit the discussion to the EPIC/PN data which provide better statistic than the MOS data. However, the data taken by the EPIC/MOS1 and MOS2 have been checked for consistency.
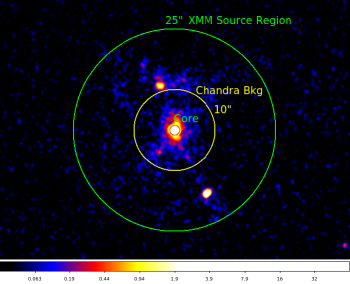
The source 0.5–10 keV PN spectrum was extracted from a circular region (centered at R.A. 08:40:02.276, Decl. +29:49:02.47; J2000.0) of 25 radius (Figure 1), and the background from a circular region located on the same CCD (50 radius; not indicated in Figure 1). The response matrices were created using the SAS commands rmfgen and arfgen. The source data are not piled-up. We used specgroup to set spectral groups such that each group/bin contains a minimum signal-to-noise ratio of 3.
2.2. Chandra
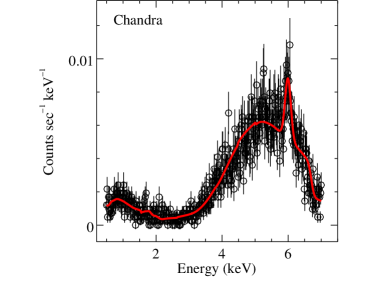
Deep Chandra ACIS-S imaging observations of 4C+29.30 were performed in Feb 2010, i.e. years after our XMM-Newton observation. The approved 300 ksec observation was split into four separate pointings (OBSIDs 11688, 11689, 12106, 12119) that sum to a total exposure of 286.4 ksec (see Paper I for details of the observations and data reduction). In this paper we use the four combined222Because the data were collected on the same part of the ACIS-S detector and spanned a relatively short time interval, we used CIAO 4.3 script combine_spectra to combine individual spectra and response files into one spectrum for this analysis. 0.5–7 keV X-ray spectra ( total counts) of the core region (Figure 1) defined as a circle with radius of 1.25 centered at the position of the nucleus determined based on the hard band Chandra X-ray image (R.A. 08:40:02.345, Decl. +29:49:02.61, J2000.0; Paper I), together with the appropriate calibration response files. The background ( counts) was extracted from an annulus centered on the core position with an inner radius of 1.5 and an outer radius of 10. We use CIAO version 4.3 tools for the data analysis.
2.3. Swift/BAT
We extend the Chandra and XMM-Newton energy bandpasses by considering the publicly available 14–195 keV (8-channel) hard X-ray Swift/BAT spectrum from the 58-months catalog (between Nov 2004 and Sep 2008; Baumgartner et al. 2010) together with the corresponding response matrix diagonal_8.rsp. We do not detect any long term variability signal in the Swift/BAT lightcurve (normalized excess variance ; e.g., Vaughan et al. 2003). Either way, integrating the data over the period of years would smear any hard X-ray spectral variations. Thus, the Swift/BAT data are representative of the average hard X-ray emission from 4C+29.30.
3. Modeling
In this section we use our deep Chandra observation to establish a spectral model for the 4C+29.30 core continuum. We use the Swift/BAT data to check the consistency of the model with X-ray data outside the Chandra energy bandpass. Finally, we apply the best fitting Chandra model to the XMM-Newton observation taken years prior to the Chandra pointing, and we discuss the X-ray spectral variability of the source. We perform the fits in Sherpa (Freeman et al. 2001) using CSTAT statistic.
The Swift/BAT data were averaged over 58 months of observations, which potentially might introduce a discrepancy between the Chandra (or XMM-Newton) and Swift/BAT data due to the X-ray flux variability. Swift/BAT composite spectra contain fractional counts with Gaussian statistic and are background subtracted, which prevents the CSTAT fitting. 333http://heasarc.nasa.gov/docs/swift/analysis/threads/batspectrumthread.html For this reason, we find best fit of each model to the Chandra (or XMM-Newton) data only. Then we apply the best fit model to the Swift/BAT data using statistic with variance supplied with the data chi2xspecvar, allowing for only one free parameter, the normalization constant, .
Table 2 contains the description of all models used in the paper in the XSPEC (Arnaud 1996) and Sherpa terminology. In Table 2 we list the best fit model parameters and the resulting fit statistics. All models considered in this section include Galactic absorption (phabs) with a column density fixed at cm-2 (Dickey & Lockman 1990). Errors on the spectral parameters correspond to the 68% confidence level (1) for one significant parameter.
A region of the diffuse emission surrounding the nucleus can be clearly identified in the soft 0.5–2 keV Chandra image (‘Center’ in Figure 2 in Paper I). In Paper I, we showed that a thermal bremsstrahlung model provided a better fit to the spectra extracted from this region than a power-law model. Thus, all our models include a thermal bremsstrahlung component with the temperature and normalization allowed to vary.
We modeled the Chandra and XMM-Newton background spectra by fitting appropriate background regions (Figure 1) with a model consisting of a Galactic absorption, thermal bremsstrahlung and power-law. The background model parameters are listed in Table 2. The parameters differ because the XMM-Newton background was collected from a region at the distance from the nucleus.
3.1. Chandra
We considered several models for the nuclear X-ray emission of 4C+29.30 observed with Chandra.
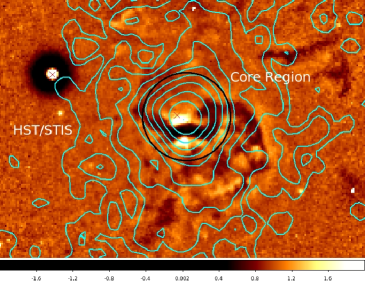
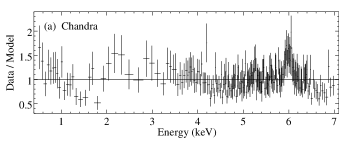
Model 1. First, we tried a simple parametrization using a cut-off power-law function (zhighect*zpowerlw in XSPEC terminology; in the following we will refer to this component as CPL or ‘a power-law’). The zhighect model is defined as . We assumed . The E-folding energy, could not be constrained by our data and we fixed it at 300 keV. We added an intrinsic absorber with a variable column density (zphabs), motivated by the presence of a dust line crossing the nuclear region, as revealed by the HST image (Figure 2). We were not able to obtain a good fit with this model. The plot of the model-to-data ratio revealed residuals in the 5–7 keV band suggesting the presence of an iron K emission line (Figure 3a). These residuals forced the photon index of the intrinsically absorbed ( cm-2) continuum to converge to an unusually low value, .
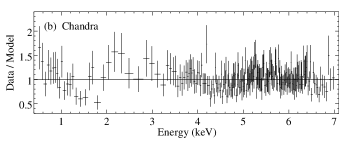
Model 2. In Model 2 we added a Gaussian line (zgauss) which reduced the 5–7 keV residuals significantly (Figure 3b). The resulting line was narrow, keV, and centered at the rest frame energy of keV. These parameters suggest that the line originates in a neutral material far from the black hole, e.g., at the outskirts of an accretion disk, or a dusty torus. The earlier short 8 ksec Chandra observation contained too few counts to detect the line or put an upper limit on its EW (Gambill et al. 2003). Thus, this is the first detection of the iron K line in 4C+29.30. The observed equivalent width of the line (i.e. relative to the intrinsically absorbed continuum) was EW eV, while the intrinsic one (i.e. relative to the unabsorbed continuum) was EW eV. The photon index in Model 2 was still unusually low, , and the intrinsic absorption remained strong with cm-2. The temperature of the diffuse emission, keV, was in agreement with that measured in Model 1 ( keV), but considerably higher than the temperature of the background thermal bremsstrahlung component, ) keV.
Model 3. The detection of the iron K line suggested that the total spectrum may contain a certain contribution of the associated reflected emission. Hence, we considered the reflection model with a slab geometry, pexriv of Magdziarz & Zdziarski (1995), i.e. a reflection from an accretion disk. We first assumed that the reflected component is not intrinsically absorbed, contrary to the case of the incident CPL. This corresponds to a scenario in which the CPL continuum is observed through an obscuring material, e.g., a dusty torus, while the reflected emission arrives to the observer unobscured. With default settings the pexriv model computes both the incident CPL and the reflected component. However, in order to apply the intrinsic absorber only to the incident CPL, we leave the CPL component in the model, and choose a setting in which the pexriv model returns only the reflected component. Consequently, the reflection amplitude, , was fitted over a negative range, which physically corresponds to a reflection component with amplitude .
We linked the photon index and the normalization of the pexriv model to those of CPL. The pexriv reflection does not account for the iron line emission and so we kept the zgauss component explicitly in the model. The viewing angle, , is not known for our source. However, an upper limit can be calculated based on the jet-to-counterjet flux ratio, , at 5 GHz (e.g., Urry & Padovani 1995). Sambruna et al. (2004) and Liuzzo et al. (2009) give and , implying (for discrete knots). We fixed at 45∘, assuming that the jet in 4C+29.30 is well aligned with the axis of the accretion disk. We fixed the abundances of elements at the Solar value.
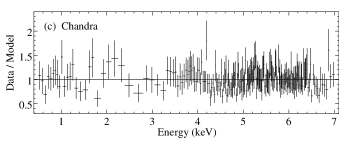
The resulting data-to-model residuals are presented in Figure 3c. The ionization parameter in the pexriv model converged to zero. The iron line remained narrow, and centered at the rest frame energy of keV. Its observed EW eV (intrinsic EW eV) was lower than in Model 2. Thus, the properties of the iron line and the reflected emission support the hypothesis that both components originate in a neutral matter located far away from the black hole. The power-law component with the photon index of was absorbed with an intrinsic column density cm-2. The reflection amplitude yielded an intermediate value of . The temperature of the soft diffuse emission, keV, was significantly lower than that in Models 1 and 2 due to the contribution of the reflected component to the soft X-ray band, and slightly higher than (but consistent with) the temperature of the background thermal component. As a final model check we replaced the thermal bremsstrahlung component with an apec model. We were able to establish only an upper limit on the value of metal abundances, . It is generally known that low abundances might be an artifact resulting from fitting the mixed temperature plasma where these mixed temperature components cannot be spectrally or spatially resolved (see e.g. Kim 2012 in context of abundances in hot ISM of elliptical galaxies). This problem with regard to the data of 4C+29.30 was considered in more details in Siemiginowska et al. (2012). Similarly to their approach we decided to keep the thermal bremsstrahlung component in the model as a good approximation.
Model 4. Next, we allowed for the second intrinsic absorber altering the reflected component with a column density , in addition to the one modifying the intrinsic CPL emission. This model, however, converged to Model 3 with cm-2, consistent with zero.
Model 5. Motivated by the studies of other Seyfert 2 type galaxies (e.g., Evans et al. 2007, 2010; Grandi et al. 2007) we tested if a partial covering model (representative for, e.g., a patchy torus) could provide an alternative description of our data. We assumed that only a fraction, (allowed to vary between 0 and 1), of the power-law emission is passing through an obscuring matter, while the remaining fraction (1-) arrives to the observer unabsorbed. This model also converged to Model 3 with .
Model 6. Next, we checked if a certain fraction, , of the intrinsic CPL may contribute to the soft emission below 1 keV due to scattering. We found that the scattered component was not formally required by the data with an upper limit on the scattering fraction , thus Model 6 converged to Model 3.
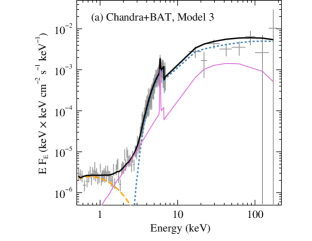
In summary, we conclude that Model 3 accounts properly for the broad band X-ray continuum measured by Chandra. In this model, the nuclear radiation described by a cut-off power-law with a hard spectrum, , is heavily intrinsically absorbed by a cold gas with cm-2. The reflected radiation arrives to the observer unabsorbed, or significantly less absorbed, than the intrinsic emission. The upper limit on the absorbing column density of the reflected component is cm-2 based on the Model 4 test. The reflecting material is neutral and located far from the black hole, as suggested by the width and energy of the fluorescent iron K line, and the ionization parameter of the reflected component. When this best fit model is applied to the Swift/BAT data, we find a normalization constant between the two data sets, .
3.2. XMM-Newton data
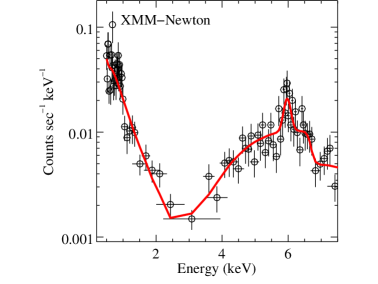
In this section we apply the best fitting Chandra model (Model 3) to the XMM-Newton data.
Figure 4a shows the ratio of the XMM-Newton data to Model 3 with parameters fixed at the values fitting best the Chandra data. A soft excess below 2 keV is clearly visible, and is due to the diffuse emission of gas surrounding the nucleus collected from a large extraction region required by the XMM-Newton PSF. To account for this difference we thawed the temperature and normalization of the thermal bremsstrahlung component in Model 3 ( and , respectively). The fit in the soft band improved significantly, although certain residuals indicative of emission/absorption lines were still present. Since we are interested primarily in the continuum AGN emission, we do not improve further on the soft ( keV) residuals and focus on modeling the spectrum at energies keV. The resulting data-to-model ratios are plotted in Figure 4b. The temperature is lower than in the case of the Chandra spectrum (although consistent within the uncertainties) and close to the temperature of the thermal component in the Chandra background model. Residuals below and above keV are still apparent indicating that the intrinsic spectral properties of the nucleus might have changed between the XMM-Newton and Chandra observations. The shape of the residuals suggests that either the intrinsic absorption column varied (model excess below 4 keV) or the normalization of the power-law varied (model deficit above 4 keV). We test both possibilities.
First we thaw the intrinsic absorption column (in addition to and ; Model 3a in Table 2) and repeat the fit. We obtain an increased intrinsic column density, cm-2, with respect to that in the Chandra observation. The intrinsic EW is in agreement with that in Chandra Model 3, as expected, while the observed EW increases to EW eV (Table 2, Figure 4c). The fit resulted in (191 d.o.f.).
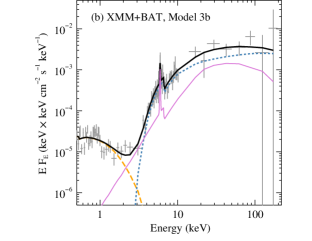
Next, we test the hypothesis that the spectral variability is due to the variable normalization of the power-law, (Model 3b in Table 2, Figure 4d), while the intrinsic absorption and reflection parameters remain fixed at the values obtained from the analysis of the Chandra data. To correctly account for the constant absolute flux of the reflected component, we release the condition that the normalization of the reflected component is equal to the normalization of the power-law. Instead, we fix the normalization of the reflected component at the value found in the Chandra data. We obtained (191 d.o.f.). We find that is lower by a factor in the XMM-Newton data than in the Chandra data. We note, however, that this parameter is subject to large errors in the Chandra data. This spectral variability scenario results in an increased equivalent width of the iron line (observed EW eV, intrinsic EW eV) as compared with the Chandra Model 3. A combined variability scenario (i.e., both and allowed to vary; 190 d.o.f.) resulted in parameter values and CSTAT consistent with those of Model 3b.
Finally, we checked the consistency between the XMM-Newton and Swift/BAT data. We found and in both cases, Model 3a and 3b, respectively. The data-to-model ratios in the Swift/BAT energy range are presented in Figures 4c–d.
4. Discussion
We studied the nuclear X-ray emission and X-ray spectral variability of a low-redshift radio galaxy 4C+29.30 over a broad 0.5–200 keV X-ray band using our deep ksec Chandra observation, ksec of cleaned XMM-Newton data, and archival 58-months catalog Swift/BAT data. We tested several spectral models, and concluded that Model 3 in Table 2 provides the best fit to our Chandra data supplemented by the Swift/BAT data. In this model the 2–200 keV X-ray emission of the central AGN is decomposed into a strongly intrinsically obscured hard cut-off power-law continuum (), and significantly less absorbed reprocessed emission including a neutral reflection hump and an accompanying neutral narrow iron K line. The soft 0.5–2 keV X-ray band is dominated by a thermal diffuse emission, and may contain a marginal contribution of a scattered power-law component. The same model applied to the earlier XMM-Newton data led us to explore two X-ray variability scenarios. In the first one, the variability is apparent and caused by the variations of the intrinsic column density. In the other, the variability arises due to changes of the normalization of the power-law emission.
The hard X-ray spectrum, renewed nuclear radio activity (van Breugel et al. 1986; Jamrozy et al. 2007; Liuzzo et al. 2009), and weak optical continuum dominated by the host galaxy (van Breugel et al. 1986) suggest an analogy between the state of the nucleus in 4C+29.30 and a hard or hard-intermediate spectral state of Galactic black hole X-ray binaries (GBHs; see e.g., Fender et al. 2004; Done et al. 2007). The spectral ages of large scale radio structures in 4C+29.30 differ by Myr. This timescale, when scaled down by the ratio between the black hole mass in 4C+29.30 ( M⊙, Section 4.4 of the present paper; Paper I) and that of a typical GBH ( M⊙), is comparable with the time between consecutive outbursts of GBHs ranging from years to decades (for examples of GBHs with at least two documented activity periods see e.g., Table 1 in Remillard & McClintock 2006; Figure 2 in Done et al. 2007). Thus, it is possible that we observed 4C+29.30 at an early stage of its renewed nuclear activity, which could have started as recently as several decades ago, judging by the spectral age of the youngest nuclear radio structures. Interestingly, the age of the youngest radio structure, yr, found by Liuzzo et al. (2009) is in agreement with the suggestion of Jamrozy et al. (2007) that a powerful outburst took place in 4C+29.30 in the period between 1990 and 2005. The X-ray loudness parameter (e.g., Zamorani et al. 1981; Avni & Tananbaum 1986), , where and are rest-frame flux densities at 2500 Å and 2 keV, respectively, can be calculated for 4C+29.30 assuming the AGN contribution to the optical band as in van Breugel et al. (1986), and 2 keV flux corrected for absorption (Model 3). We find a low value, , further supporting the idea of a hard or hard-intermediate spectral state of the source (e.g., Sobolewska et al. 2009; 2011).
Below we discuss in detail the implications of our modeling on the nature of the studied AGN and its surroundings.
4.1. Origin of the X-ray spectral variability
The three X-ray observations of 4C+29.30 available to date, spread over a period of several years, allow us to address the question about X-ray variability of the source. The early Chandra data (Apr 2001; Gambill et al. 2003) were described with a simple power-law model ( fixed at 1.69) modified by the Galactic absorption ( cm-2, slightly different than the value adopted in the present paper), and an intrinsic absorption cm-2 in excellent agreement with that found in our new Chandra data, cm-2. The reported 2–10 keV absorbed flux was erg s-1 cm-2. Based on the Gambill et al. model parameters we evaluated that the unabsorbed 2–10 keV flux of the source in April 2001 was erg s-1 cm-2, comparable with that at the time of our Chandra observation, erg s-1 cm-2 (Feb 2010). However, our deep observation revealed that the spectrum of the 4C+29.30 core is more complex due to the soft component and reflection features. The model of Gambill et al. (2003) when applied to our Chandra data results in a reduction of the 2–10 keV flux, , by %. It is thus possible that in Gambill et al. (2003) was underestimated by a few percent. Nevertheless, we conclude that the 2–10 keV flux and the properties of the intrinsic absorber were approximately unchanged between the two Chandra observations.
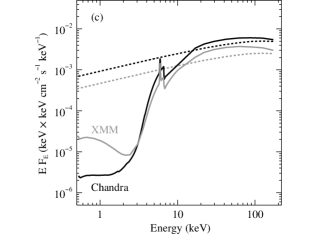
However, a discrepancy between our Chandra and XMM-Newton data (Apr 2008) is apparent, as demonstrated in Figure 4. We proposed two scenarios for the X-ray spectral variability of 4C+29.30. We started with the good quality deep Chandra observation to establish a base-line spectral model, and we found that the XMM-Newton data above 2 keV can be explained by varying only one spectral parameter: the intrinsic absorbing column density, , or the normalization of the power-law component, . In the former case (variable ), the XMM-Newton flux is in agreement with both Chandra measurements, , while the intrinsic column density exceeds that measured with Chandra by %. In the latter case (variable ) we obtain erg s-1 cm. Cross-calibration studies444http://xmm.esac.esa.int/docs/documents/CAL-TN-0052.ps.gz show that in general the spectra measured by XMM-Newton (EPIC/PN) and Chandra (ACIS-S) agree within 10% in the 0.5–2 keV band, and within 20% above 2 keV. Thus, the detected Chandra and XMM-Newton intrinsic flux difference is too high to be fully attributed to the cross-calibration issues, implying that in this scenario the source may be variable on timescales of several years in the 2–10 keV band.
Variations of the intrinsic column density seem to be a common phenomenon in AGN on timescales as short as weeks (e.g., Risaliti et al. 2005, 2007, 2009, 2010). On the other hand, a non-variable narrow 6.4 keV iron line and associated constant neutral reflection not responding to the variations of the power-law component, interpreted as the reprocessing of the hard X-rays by a remote molecular torus, also seem to be common spectral features in both Type 1 AGN (e.g., MCG-6-30-15, Vaughan & Fabian 2004; NGC 4051, Miller et al. 2010, Ponti et al. 2006; Mrk 841, Petrucci et al. 2007; Ark 120, Nardini et al. 2011; a sample of 14 Seyfert 1 galaxies, Bhayani & Nandra 2010) and Type 2 AGN (e.g., a sample of 20 Seyfert 2 galaxies, Risaliti 2002; MCG-5-23-16, Reeves et al. 2006; NGC 2992, Yaqoob et al. 2007, and references therein; NGC 4945, Itoh et al. 2008, Marinucci et al. 2012).
In our modeling, both variability scenarios resulted in satisfactory fits (Table 2). However, a visual inspection of the fit residuals in the XMM-Newton and Swift/BAT energy ranges (Figure 4) seems to favor the scenario with variable power-law normalization, (Model 3b) over the scenario with variable intrinsic column density, (Model 3a). We confirmed that model with variable is more likely to be correct than model with variable by calculating the respective p-values (Protassov et al. 2002) based on the series of 1000 simulated data sets (using Sherpa’s fake_pha function) for two test cases: (a) variable (null model) vs. combined variability scenario (both and allowed to vary (alternative model), and (b) variable (null model) vs. combined variability scenario (alternative model). In case (a) we found p-, which implied that model with variable is unlikely to be true. Conversely, in case (b) the high p- suggests that the model with variable is likely to be true.
In Figure 5c we show a comparison between the best fitting Chandra and XMM-Newton total models, and the unabsorbed power-law model components in the case of the favored scenario with variable .
4.2. Iron line and reflection hump
The first short Chandra observation of 4C+29.30 contained too few counts to detect the iron K line or put a limit on its EW (Gambill et al. 2003). Our XMM-Newton and Chandra observations are thus the first detections of the K iron line in this object. The line was narrow ( keV) and centered at the rest frame energy close to 6.4 keV. These line properties indicate that it originated in a neutral matter far away from the black hole, i.e. outer parts of an accretion disk or a dusty torus.
The intrinsic equivalent width of the iron line, EWi, measured in our XMM-Newton and Chandra data is in the –120 eV range, depending on the adopted variability scenario (Table 2). An iron line originating in a lamp-post model due to reprocessing of hard power-law X-rays with by an accretion disk observed face-on has an expected EW of eV (e.g., George & Fabian 1991). However, this EW is sensitive to a number of parameters such as the photon index, viewing angle, iron abundance, and optical depth for electron scattering. Nandra et al. (2007) give the photon index and inclination dependent formulas for the EW based on the fits to the Monte Carlo simulations of George & Fabian (1991). For resulting from our fits and an assumed inclination of 45∘, we obtain the predicted EW of 170 eV. This value should be considered as an upper limit due to the unknown disk/X-ray source geometry (the reflection amplitude in our data is which may suggest, e.g., a truncated disk geometry or a patchy corona, as opposed to in the lamp-post model). It is thus possible that at least some of the photons forming an iron line with an (intrinsic) EW of 70–120 eV, as measured in this paper, originated in an accretion disk. This would require that the intrinsic absorber and the reflector were two separate media.
Ghisellini et al. (1994) presented a scenario in which the iron line is formed as a result of the reprocessing of a power-law continuum by a molecular torus (see also Krolik et al. 1994; Levenson et al. 2002). The torus scenario for the origin of the iron line provides a compelling possibility of associating the intrinsic absorber with the reflector. The EW of the iron line for tori with cm-2 and a half-opening angle of 30∘–45∘ is predicted in the –300 eV range, with the lower (higher) values corresponding to the face-on (edge-on) view. Ghisellini et al. (1994) assumed an illuminating power-law with . Levenson et al. (2002) estimated that the allowed range of EWs increases by up to 5% if the spectrum hardens with changing to (for intermediate viewing angles ). The spectrum measured in our data is even harder, characterized with , which implies even larger allowed EWs. Comparing these predictions with the observed iron line EWs in 4C+29.30, we find that both Chandra and XMM-Newton measurements, EW–280 eV, lie within the range predicted by the torus origin of the iron line.
In Model 3, we used the pexriv+zgauss model of X-ray reprocessing. We are aware of certain issues associated with this approach, which include the iron line added to a continuum in an arbitrary way, and the assumption that the hard X-rays are reflected by an accretion disk. We argue instead that the reflector could be associated with a molecular torus. Models of hard X-ray reprocessing by a toroidal reflector are available (Ghisellini et al. 1994; Krolik et al. 1994; Levenson et al. 2002; Murphy & Yaqoob 2009). Of these, the tabulated model mytorus of Murphy & Yaqoob (2009) accounts self-consistently for all components reprocessed by an optically thick torus – the zero-order absorbed component, the scattered component, and associated fluorescent Fe K, Fe K and Ni K emission lines. However, the model in its present version considers a torus with a fixed half-opening angle of . This model tested on our Chandra data requires almost an edge on view, , in contradiction with the viewing angle constrains based on the jet-to-counterjet flux ratio. The data of 4C+29.30 require that the zero-order component is strongly absorbed, indicating that the torus half-opening angle . With viewing angle fixed at , an additional intrinsic absorber affecting only the zero-order component of the mytorus model is needed in order to obtain a good fit, which breaks the consistency of the model. We conclude that the available mytorus model does not provide at this time enough flexibility to account for the case appropriate for our source, in which .
4.3. 4C+29.30 – a ‘hidden’ AGN
Recently, a new class of AGN has been identified in the Suzaku and XMM-Newton follow-ups of the Swift/BAT AGN with cm-2 (e.g., Ueda et al. 2007; Winter et al. 2008, 2009a,b; Eguchi et al. 2009, 2011; Noguchi et al. 2009, 2010). The characteristic feature of these AGN is a lower contribution of the scattered power-law emission to the soft X-ray band, , as compared to that of typical Seyfert 2 galaxies, –10% (e.g., Turner et al. 1997; Guainazzi et al. 2005; Winter et al. 2009a; Noguchi et al. 2009, 2010). Winter et al. (2009a) found that 24% of their entire Swift/BAT selected sample (153 sources) belong to this new class of AGN based on the and low soft-to-hard X-ray observed flux ratio, . Ueda et al. (2007) proposed that the reduced is due to a geometrically thick torus covering a significant fraction of the solid angle. They predicted that in this new class of AGN, the [OIII] lines relative to hard X-ray luminosity would be weaker than in the typical Seyfert 2 galaxies because of lower flux arriving to the NLR in the presence of a geometrically thick torus. A name ‘hidden’ or ‘buried’ AGN was proposed for this new class, missed in previous optically and soft X-ray selected samples.
Noguchi et al. (2009, 2010) identified hidden AGN candidates in the 2XMM Catalogue using X-ray hardness ratios, HR3 and HR4 (for definition see the 2XMM User Guide to the Catalogue). These two hardness ratios calculated for the XMM-Newton data of 4C+29.30, HR3=0.09 and HR4=0.83, comply with the Noguchi et al. selection criteria. In our analysis, we found that the scattered component was not formally required to model the data and that the scattering fraction was consistent with zero (Model 6), . This value is quite low but in agreement with found previously in several other Seyfert 2s (Ueda et al. 2007; Eguchi et al. 2009; Noguchi et al. 2009; Winter et al. 2009a,b), and implies a torus with half opening angle (Eguchi et al. 2009 for ). The observed soft-to-hard flux ratio in 4C+29.30 is . Thus, the XMM-Newton colors, , and soft-to-hard flux ratio indicate that 4C+29.30 is a hidden AGN candidate.
Noguchi et al. (2010) showed that the scattering fraction correlates with the ratio of the reddening corrected [OIII] 5007Å line luminosity to the 2–10 keV intrinsic luminosity . Thus, to further exploit the intriguing hidden AGN scenario in 4C+29.30, we investigated the properties of its [OIII] emission line. We used the observed [OIII] flux reported by van Breugel et al. (1986). We corrected it for the extinction using their observed luminosity ratio of 5.1 and the relation of Bassani et al. (1999) with the assumed Galactic gas to dust ratio, i.e. . We obtained in 4C+29.30, which means that our source can be placed somewhat above the Noguchi et al. correlation, however within the scatter produced by the sources used to derive the correlation.
Base on a sample of six AGN, Eguchi et al. (2009) speculated that hidden AGN with have high reflection amplitudes , while those with have . 4C+20.30 with and fits in the gap between the two groups in the vs. diagram (similarly to two other sources in Eguchi et al. 2011), indicating that the distribution of and may be continuous rather than split into two distinct groups.
The soft thermal emission identified in our Chandra image contributes majority of the 0.5–2 keV flux. However, this component may be easily overlooked in the data with lower exposure or spatial resolution. We investigated a possible effect of neglecting this component in the total model (Model 7 in Table 2). We found that the most striking difference between Model 3 and Model 7 is the softening of the photon index in the case without the thermal component, . This follows from the adjustment of the slope of the scatterred unabsorbed component (linked in the model to that of the CPL) in order to account for the soft X-ray emission but not to overestimate the hard X-rays at the same time.
We conclude that more detailed studies of the soft emission in the hidden AGN complemented by better quality hard X-ray data (e.g. NuSTAR) are of particular importance to recognizing their X-ray properties and geometry of the obscuring torus.
4.4. Black hole mass
Noguchi et al. (2010) showed that the scattering fraction, , anti-correlates with the Eddington luminosity ratio, , where (applying a bolometric correction factor of 30 typical for luminous AGN; e.g., Vasudevan & Fabian 2007). For 4C+29.30 the limit we found on the scattering fraction translates into , which gives M⊙.
Another black hole mass estimate can be done using the empirical relation between and stellar velocity dispersion, (Tremaine et al. 2002). Based on the optical spectrum taken from the Sloan Digital Sky Survey Data Release 7 (Abazajian et al. 2009) the stellar velocity dispersion of 4C+29.30 is km s-1 (using the STARLIGHT synthesis code of Cid Fernandes et al. 2005), resulting in the black hole mass M⊙.
These two new black hole mass estimates are compatible with the discussion presented in Paper I where M⊙ was found based on an argument involving energetics of the system. Thus, it is possible that the mass of the black hole in 4C+29.30 is close to M⊙.
4.5. Multiwavelength perspective of 4C+29.30
4.5.1 Infra-red
X-ray radiation absorbed and reprocessed by an obscuring torus would eventually emerge in the infrared band. Models of the infrared AGN SEDs under the assumption of a clumpy structure of a molecular torus (Nenkova et al. 2002; Hönig et al. 2006; Nenkova et al. 2008a,b) are potentially able to constrain the torus geometry in sources observed in IR with a high spatial resolution (e.g., Gandhi et al. 2009; Alonso-Herrero et al. 2012), with the near-IR 1–5 m fluxes being most sensitive to the inclination effects (Nenkova et al. 2008b). 4C+29.30 was observed in infrared by IRAS, 2MASS, and WISE, of which the two latter surveys sampled the desired near-IR band. However, in 4C+29.30 the 2MASS measurements are dominated by the host galaxy555We estimated the host galaxy contribution to the , and bands using the flux measurement at 5400Å being a sum of % and % galaxy and AGN emission, respectively (van Breugel et al. 1986); the mag reddening possibly due to a dust lane (van Breugel et al. 1986); and the 10 Gyr elliptical galaxy template of Buzzoni (2005)., while the WISE observations with a spatial resolution 6–12 correspond to our 10 Chandra background region rather then the core region. Nevertheless, we use the W2 and W3 filters at rest-frame wavelengths m and m, to constrain the viewing angle of our source. We calculated respective ratios (where corresponds to erg s-1) and compared them with the 4.5 m and 12 m models of Nenkova et al. (2008b; Figure 10; see also Erratum in Nenkova et al. 2010). We obtained and , which gave and no constraint (our was too low to intercept the 12 m model of Nenkova et al. 2008b), in contradiction with the condition followed from the jet-to-counterjet flux ratio. The and ratios are a factor 2–6 too low to comply with the constraint. There are several reasons for this discrepancy to consider. (i) The bolometric luminosity of 4C+29.30 might have been underestimated by a factor of a few due to the uncertainty of the applied bolometric correction. (ii) The geometry of the obscuring torus may differ from that considered in Nenkova et al. (2008b), e.g., the case of a geometrically thick torus with half-opening angle evoked for hidden AGN by Eguchi et al. (2009) would imply a torus width parameter (see Figure 1 in Nenkova et al. 2008b for the illustration of ) as opposed to assumed to compute the models. (iii) Finally, the m WISE flux might be partially affected by the 4C+29.30 ISM environment (see e.g., Goulding et al. 2012 for arguments in favor of host galaxy origin of the rest-frame 9.7 m Si-absorption feature in Compton-thick Seyfert 2 galaxies), e.g., a dust lane covering the central part of the nucleus, clearly visible in the archival HST image in Figure 2.
We verified the third scenario using the correlation reported in Gandhi et al. (2009) for a number of Seyfert 2 galaxies between their 2–10 keV luminosities and 12 m luminosities. The IR luminosities in Gandhi et al. (2009) follow from sub-arcsecond resolution observations, and thus most likely they are representative of the true IR nuclear emission. In 4C+29.30 the m luminosity is erg s-1. This is in agreement with the expected erg s-1 (based on our unabsorbed 2–10 keV Chandra flux; Model 3), leaving scenarios (i) and/or (ii) as plausible causes of the discrepancy between the Nenkova et al. (2008b) models and 4C+29.30 WISE flux measurements.
4.5.2 Radio
4C+29.30 is an intermittent radio galaxy with evidence for several jet ejection events with the spectral time ranging from Myr (the relic structure), through Myr and Myr, to yr and yr (Jamrozy et al. 2007; Liuzzo et al. 2009). However, the radio activity of 4C+29.30 seems rather mild in comparison with the powerful radio sources. The total jet power of 4C+29.30, erg s-1, constitutes only a small fraction of its Eddington luminosity, , while in the most powerful blazars reaches (0.1– (e.g., Ghisellini et al. 2009). Low-power FR I radio galaxies are characterized by much lower values of (e.g., in the case of M87), but at the same time they accrete at low rates () probably in a radiatively inefficient mode. To the contrary, we estimated that the Eddington luminosity ratio of our low-power radio galaxy is quite substantial, .
The standard radio loudness parameter is typically defined as the ratio of 5 GHz radio to B-band (4400Å) optical luminosity spectral densities, , with characterizing radio-loud AGN (as proposed for quasars by Kellermann et al. 1989). In the case of 4C+29.30, one can calculate based on the available archival data (5 GHz total flux given in Liuzzo et al. 2009 and 4400Å flux extrapolated from the allowed range of the 5400Å nuclear flux, assuming ; see the discussion in van Breugel et al. 1986). However, this value should be taken with caution mainly because of uncertainties associated with the attenuation of the optical nuclear flux due to the obscured nature of the source, and host galaxy contribution known to be particularly relevant in the case of low-power Seyfert galaxies (Ho & Peng 2001; Sikora et al. 2007).
We compared the radio properties of 4C+29.30 with those of 52 hidden AGN candidates compiled from the literature based on Ueda et al. (2007), Eguchi et al. (2009, 2011), Noguchi et al. (2009, 2010), and Winter et al. (2009a,b). In approximately one-third of them (17 of 52) the scattered fraction was reported to be % in at least one publication, that is at a level comparable with the upper limit estimated in 4C+29.30, implying a geometrically thick torus with an opening angle 20∘ (Eguchi et al. 2009). Combination of the available archival NVSS (Condon et al. 1998) and NED data allowed us to calculate the standard radio loudness parameter in the case of 34 sources, including 14 of 17 sources with %. We found that approximately one-third of these sources (11 of 34) could be considered radio-loud according to the condition . Among them we distinguished five radio-intermediate sources with –20, and six sources with a substantially higher radio loudness, –27. We caution, however, that similarly to the case of 4C+29.30, the calculated values of the radio loudness are only approximate due to the obscured nature of the hidden AGN. Nonetheless, it seems that the hidden nuclei are associated predominantly with the radio-quiet AGN.
Finally, we stress that among the 34 sources with measured radio loudness, , we found only three (%) with % and (Mrk 348, 3C 33, and NGC 612). Hence, 4C+29.30 appears quite unusual in that it shows properties characteristic to both radio-loud AGN and hidden AGN with extremely geometrically thick tori. Based on the present data it cannot be determined whether a small fraction of radio-loud AGN among the hidden AGN population is due to physical constraints or an observational bias.
5. Conclusions
We confirmed that the X-ray emission of the AGN in 4C+29.30, a radio source hosted by an elliptical galaxy,
resembles Seyfert 2 type of activity. We estimated that the mass of the central black hole is of the order
of 108 M⊙. We decomposed the broad band 0.5–200 keV X-ray continuum (Chandra/XMM-Newton
supplemented by Swift/BAT observations) into
(i) a hard (–1.6) cut-off power-law component attenuated due to a strong intrinsic
X-ray absorption with column density cm-2;
(ii) a reflection hump () and narrow iron K line detected
for the first time in this source originating due to the reprocessing of the AGN power-law emission
by a distant neutral matter;
(iii) a soft thermal emission of a diffuse gas clearly detected in our Chandra image
dominating the 0.5–2 keV band;
(iv) a marginal contribution of a scattered power-law emission to the soft X-ray band,
%.
We hypothesized that the distant reflector and the obscuring matter can be both associated with
a molecular torus. Based on , the ratio of the observed soft-to-hard X-ray fluxes, and the
XMM-Newton colors we proposed that 4C+29.30 belongs to the hidden/buried AGN, a new class that is
emerging among the Swift/BAT hard X-ray selected AGN. We demonstrated that 4C+29.30, a radio-loud
source with an intermittent jet activity and below 0.5%, shows properties characteristic
to only % of the presently identified hidden/buried AGN candidates with estimated radio
loudness parameter.
References
- Abazajian et al. (2009) Abazajian, K. N., Adelman-McCarthy, J. K., Agüeros, M. A., et al. 2009, ApJS, 182, 543
- Alonso-Herrero et al. (2012) Alonso-Herrero, A., Pereira-Santaella, M., Rieke, G. H., & Rigopoulou, D. 2012, ApJ, 744, 2
- Arnaud (1996) Arnaud, K. A. 1996, Astronomical Data Analysis Software and Systems V, 101, 17
- Avni & Tananbaum (1986) Avni, Y., & Tananbaum, H. 1986, ApJ, 305, 83
- Bassani et al. (1999) Bassani, L., Dadina, M., Maiolino, R., et al. 1999, ApJS, 121, 473
- Baumgartner et al. (2010) Baumgartner, W.H. et al. 2010, ApJS, submitted
- Bhayani & Nandra (2010) Bhayani, S., & Nandra, K. 2010, MNRAS, 408, 1020
- Buzzoni (2005) Buzzoni, A. 2005, MNRAS, 361, 725
- Cid Fernandes et al. (2005) Cid Fernandes, R., Mateus, A., Sodré, L., Stasińska, G., & Gomes, J. M. 2005, MNRAS, 358, 363
- Condon et al. (1998) Condon, J. J., Cotton, W. D., Greisen, E. W., et al. 1998, AJ, 115, 1693
- Dickey & Lockman (1990) Dickey, J. M., & Lockman, F. J. 1990, ARA&A, 28, 215
- Done et al. (2007) Done, C., Gierliński, M., & Kubota, A. 2007, A&A Rev., 15, 1
- Eguchi et al. (2011) Eguchi, S., Ueda, Y., Awaki, H., et al. 2011, ApJ, 729, 31
- Eguchi et al. (2009) Eguchi, S., Ueda, Y., Terashima, Y., Mushotzky, R., & Tueller, J. 2009, ApJ, 696, 1657
- Evans et al. (2007) Evans, D. A., Lee, J. C., Turner, T. J., Weaver, K. A., & Marshall, H. L. 2007, ApJ, 671, 1345
- Evans et al. (2010) Evans, D. A., Reeves, J. N., Hardcastle, M. J., et al. 2010, ApJ, 710, 859
- Fabian et al. (2011) Fabian, A. C., Sanders, J. S., Williams, R. J. R., et al. 2011, MNRAS, 417, 172
- Fender et al. (2004) Fender, R. P., Belloni, T. M., & Gallo, E. 2004, MNRAS, 355, 1105
- Freeman et al. (2001) Freeman, P., Doe, S., & Siemiginowska, A. 2001, Proc. SPIE, 4477, 76
- Gambill et al. (2003) Gambill, J. K., Sambruna, R. M., Chartas, G., et al. 2003, A&A, 401, 505
- Gandhi et al. (2009) Gandhi, P., Horst, H., Smette, A., et al. 2009, A&A, 502, 457
- George & Fabian (1991) George, I. M., & Fabian, A. C. 1991, MNRAS, 249, 352
- Ghisellini et al. (1994) Ghisellini, G., Haardt, F., & Matt, G. 1994, MNRAS, 267, 743
- Ghisellini et al. (2009) Ghisellini, G., Tavecchio, F., & Ghirlanda, G. 2009, MNRAS, 399, 2041
- Goulding et al. (2012) Goulding, A. D., Alexander, D. M., Bauer, F. E., et al. 2012, ApJ, 755, 5
- Grandi et al. (2007) Grandi, P., Guainazzi, M., Cappi, M., & Ponti, G. 2007, MNRAS, 381, L21
- Guainazzi et al. (2005) Guainazzi, M., Matt, G., & Perola, G. C. 2005, A&A, 444, 119
- Hönig et al. (2006) Hönig, S. F., Beckert, T., Ohnaka, K., & Weigelt, G. 2006, A&A, 452, 459
- Ho & Peng (2001) Ho, L. C., & Peng, C. Y. 2001, ApJ, 555, 650
- Itoh et al. (2008) Itoh, T., Done, C., Makishima, K., et al. 2008, PASJ, 60, 251
- Jamrozy et al. (2007) Jamrozy, M., Konar, C., Saikia, D. J., et al. 2007, MNRAS, 378, 581
- Kellermann et al. (1989) Kellermann, K. I., Sramek, R., Schmidt, M., Shaffer, D. B., & Green, R. 1989, AJ, 98, 1195
- Kim (2012) Kim, D.-W. 2012, Astrophysics and Space Science Library, 378, 121
- Krolik et al. (1994) Krolik, J. H., Madau, P., & Życki, P. T. 1994, ApJ, 420, L57
- Levenson et al. (2002) Levenson, N. A., Krolik, J. H., Życki, P. T., et al. 2002, ApJ, 573, L81
- Liuzzo et al. (2009) Liuzzo, E., Giovannini, G., Giroletti, M., & Taylor, G. B. 2009, A&A, 505, 509
- Magdziarz & Zdziarski (1995) Magdziarz, P., & Zdziarski, A. A. 1995, MNRAS, 273, 837
- Marinucci et al. (2012) Marinucci, A., Risaliti, G., Wang, J., et al. 2012, MNRAS, 423, L6
- Miller et al. (2010) Miller, L., Turner, T. J., Reeves, J. N., et al. 2010, MNRAS, 403, 196
- Million et al. (2010) Million, E. T., Werner, N., Simionescu, A., et al. 2010, MNRAS, 407, 2046
- Morganti (2010) Morganti, R. 2010, PASA, 27, 463
- Murphy & Yaqoob (2009) Murphy, K. D., & Yaqoob, T. 2009, MNRAS, 397, 1549
- Nandra et al. (2007) Nandra, K., O’Neill, P. M., George, I. M., & Reeves, J. N. 2007, MNRAS, 382, 194
- Nardini et al. (2011) Nardini, E., Fabian, A. C., Reis, R. C., & Walton, D. J. 2011, MNRAS, 410, 1251
- Nenkova et al. (2002) Nenkova, M., Ivezić, Ž., & Elitzur, M. 2002, ApJ, 570, L9
- Nenkova et al. (2008) Nenkova, M., Sirocky, M. M., Ivezić, Ž., & Elitzur, M. 2008a, ApJ, 685, 147
- Nenkova et al. (2008) Nenkova, M., Sirocky, M. M., Nikutta, R., Ivezić, Ž., & Elitzur, M. 2008b, ApJ, 685, 160
- Nenkova et al. (2010) Nenkova, M., Sirocky, M. M., Nikutta, R., Ivezić, Ž., & Elitzur, M. 2010, ApJ, 723, 1827
- Noguchi et al. (2009) Noguchi, K., Terashima, Y., & Awaki, H. 2009, ApJ, 705, 454
- Noguchi et al. (2010) Noguchi, K., Terashima, Y., Ishino, Y., et al. 2010, ApJ, 711, 144
- Petrucci et al. (2007) Petrucci, P. O., Ponti, G., Matt, G., et al. 2007, A&A, 470, 889
- Ponti et al. (2006) Ponti, G., Miniutti, G., Cappi, M., et al. 2006, MNRAS, 368, 903
- Protassov et al. (2002) Protassov, R., van Dyk, D. A., Connors, A., Kashyap, V. L., & Siemiginowska, A. 2002, ApJ, 571, 545
- Reeves et al. (2006) Reeves, J. N., Fabian, A. C., Kataoka, J., et al. 2006, Astronomische Nachrichten, 327, 1079
- Remillard & McClintock (2006) Remillard, R. A., & McClintock, J. E. 2006, ARA&A, 44, 49
- Risaliti (2002) Risaliti, G. 2002, A&A, 386, 379
- Risaliti et al. (2005) Risaliti, G., Elvis, M., Fabbiano, G., Baldi, A., & Zezas, A. 2005, ApJ, 623, L93
- Risaliti et al. (2007) Risaliti, G., Elvis, M., Fabbiano, G., et al. 2007, ApJ, 659, L111
- Risaliti et al. (2009) Risaliti, G., Salvati, M., Elvis, M., et al. 2009, MNRAS, 393, L1
- Risaliti et al. (2010) Risaliti, G., Elvis, M., Bianchi, S., & Matt, G. 2010, MNRAS, 406, L20
- Sambruna et al. (2004) Sambruna, R. M., Gambill, J. K., Maraschi, L., et al. 2004, ApJ, 608, 698
- Siemiginowska et al. (2012) Siemiginowska, A., Stawarz, Ł., Cheung, C. C., et al. 2012, ApJ, 750, 124 (Paper I)
- Sikora et al. (2007) Sikora, M., Stawarz, Ł., & Lasota, J.-P. 2007, ApJ, 658, 815
- Sobolewska et al. (2009) Sobolewska, M. A., Gierliński, M., & Siemiginowska, A. 2009, MNRAS, 394, 1640
- Sobolewska et al. (2011) Sobolewska, M. A., Siemiginowska, A., & Gierliński, M. 2011, MNRAS, 413, 2259
- Tremaine et al. (2002) Tremaine, S., Gebhardt, K., Bender, R., et al. 2002, ApJ, 574, 740
- Turner et al. (1997) Turner, T. J., George, I. M., Nandra, K., & Mushotzky, R. F. 1997, ApJ, 488, 164
- Ueda et al. (2007) Ueda, Y., Eguchi, S., Terashima, Y., et al. 2007, ApJ, 664, L79
- Urry & Padovani (1995) Urry, C. M., & Padovani, P. 1995, PASP, 107, 803
- van Breugel et al. (1986) van Breugel, W. J. M., Heckman, T. M., Miley, G. K., & Filippenko, A. V. 1986, ApJ, 311, 58
- Vasudevan & Fabian (2007) Vasudevan, R. V., & Fabian, A. C. 2007, MNRAS, 381, 1235
- Vaughan et al. (2003) Vaughan, S., Edelson, R., Warwick, R. S., & Uttley, P. 2003, MNRAS, 345, 1271
- Vaughan & Fabian (2004) Vaughan, S., & Fabian, A. C. 2004, MNRAS, 348, 1415
- Winter et al. (2008) Winter, L. M., Mushotzky, R. F., Tueller, J., & Markwardt, C. 2008, ApJ, 674, 686
- Winter et al. (2009) Winter, L. M., Mushotzky, R. F., Reynolds, C. S., & Tueller, J. 2009a, ApJ, 690, 1322
- Winter et al. (2009) Winter, L. M., Mushotzky, R. F., Terashima, Y., & Ueda, Y. 2009b, ApJ, 701, 1644
- Yaqoob et al. (2007) Yaqoob, T., Murphy, K. D., Griffiths, R. E., et al. 2007, PASJ, 59, 283
- Zamorani et al. (1981) Zamorani, G., Henry, J. P., Maccacaro, T., et al. 1981, ApJ, 245, 357


| Name | Description |
|---|---|
| Model 1a | phabs * (zbremss + zphabs*CPL) |
| Model 2 | phabs * (zbremss + zphabs*CPL + zgauss) |
| Model 3 | phabs * (zbremss + zphabs*CPL + zgauss + pexriv) |
| Model 4 | phabs * (zbremss + zphabs*CPL + zgauss + zphabs*pexriv) |
| Model 5b | phabs * (zbremss + zpcfabs*CPL + zgauss + zphabs*pexriv) |
| Model 6c | phabs * (zbremss + zphabs*CPL + constant*CPL + zgauss + zphabs*pexriv) |
| Model 7c | phabs * (zphabs*CPL + constant*CPL + zgauss + zphabs*pexriv) |
NOTE – Models 4–6 converged to Model 3. In Sherpa the individual model names are proceeded by xs.
.
.
.
| Thermal | Intrinsic | Cut-off power-lawb | Fe K linec | Neutral | Norm.d | CSTAT | |||||||
| bremsstrahlunga | absorption | (CPL) | reflection | ||||||||||
| EWo | EWi | Value | Prob. (d.o.f.) | ||||||||||
| keV | cm-2 | keV | keV | eV | eV | ||||||||
| Chandra | |||||||||||||
| Bkg | … | … | … | … | … | … | … | 578 | 1 (442) | ||||
| Model 1 | … | … | … | … | … | 1129 | (887) | ||||||
| Model 2 | … | 1045 | (884) | ||||||||||
| Model 3 | 1016 | 0.002 (883) | |||||||||||
| XMM-Newton | |||||||||||||
| Bkg | … | … | … | … | … | … | … | 1219 | 1 (1903) | ||||
| Model 3a | 64 | 228 | 0.03 (191) | ||||||||||
| Model 3b | 209 | 0.30 (191) | |||||||||||
a Normalization of the thermal bremsstrahlung, , in units
,
where is the electron density in cm-3, is the ion density in cm-3, is the angular size distance in cm,
and is the redshift.
b Normalization of the cut-off power-law, , in units 10-5 photons keV-1 cm-2 s-1 at 1 keV.
c The observed (intrinsic) equivalent width EWo (EWi) calculated relative to the intrinsically absorbed (unabsorbed) continuum.
d Normalization constant between the Chandra (XMM-Newton) and Swift/BAT models.
∗ Parameter fixed at the Model 3 value.