Synchronous Evolution
of Galaxies in Groups: NGC524 Group
O.K. Sil’chenko1 and V.L. Afanasiev2
Sternberg Astronomical Institute of the Lomonosov Moscow State University, Moscow, Russia1
Special Astrophysical Observatory of the Russian Academy of Sciences, Nizhnij Arkhyz, Russia2
By means of panoramic spectroscopy at the SAO RAS BTA telescope, we investigated the properties of stellar populations in the central regions of five early-type galaxies – the NGC 524 group members. The evolution of the central regions of galaxies looks synchronized: the average age of stars in the bulges of all the five galaxies lies in the range of 3–6 Gyr. Four of the five galaxies revealed synchronized bursts of star formation in the nuclei 1–2 Gyr ago. The only galaxy, in which the ages of stellar population in the nucleus and in the bulge coincide (i.e. the nuclear burst of star formation did not take place) is NGC 502, the farthest from the center of the group of all the galaxies studied.
1 INTRODUCTION
Most galaxies in the nearby Universe are group members: according to recent estimates [1], 54% of all the galaxies within 40 Mpc from us are assembled in groups with four or more members; and if we take into account also the pairs and triplets, the number of galaxies in small groups increases to 82%. If considering their properties – a presence of nearby gravitating neighbours and low, about 100 km/s, velocities of mutual passages of galaxies, the typical dynamic crossing times being several times smaller than the Hubble time –, the groups are indeed the best place for the demonstration of effects of so-called external secular evolution of galaxies (for the classification of the evolution mechanisms of galaxies, see the survey by Kormendy and Kennicutt [2]). This implies that the external effects, both gravitational and gasdynamical, must play an important, perhaps even dominant role in the evolution of galaxies in groups, by shaping the stellar subsystems of these galaxies. These effects can dramatically change the structure of galaxies, and lead even to their morphological transformation.
The galaxies in groups are affected by the total gravitational potential of the group in which they move, and also by the common medium environment (hot intergalactic gas, if present in groups). Then, it seems likely that shaping of the global structures and, in particular, the formation of central stellar subsystems in group galaxies may be synchronized, i.e. the mean ages of the stellar populations in the centers of galaxies would be similar. Almost all the mechanisms of the gravitational (tidal) interaction, as well as many gasdynamical mechanisms (ram pressure, static compression by the hot medium) lead to the gas concentration in the galactic centers, which provokes subsequent starbursts resulting in formation of secondary (now intermediate-age) stellar population in the nucleus and over the bulge of the galaxy. The discovery of the synchronization in the evolution of galactic central regions could be an argument in favour of the dominant role of external effects, and the lack of the sinchronization, on the contrary, should attract attention to the differences of initial conditions in the evolution of galaxies.
More than ten years ago we started study of stellar populations in central regions of galaxies in groups with the Multi-Pupil Fiber Spectrograph (MPFS) of the Russian 6-m telescope of the Special Astrophysical Observatory of the Russian Academy of Sciences (SAO RAS). Up to now we have investigated several, typically 2–3 central galaxies in six nearby groups. In Leo I [3], and in the NGC 5576 [4] and NGC 3169 [5] groups of galaxies the properties of stellar population in the circumnuclear disks of large galaxies turned out to be the same. The last star formation there has stopped relatively recently, 1 3 Gyr ago, in spite of the early type of the host galaxies, and in the Leo I group the circumnuclear stellar disks even have the same spatial orientation of the rotation axes. In the Leo triplet (NGC3623/NGC 3627/NGC 3628), on the contrary, the age of the stellar population and the kinematics of the gas in the centers of NGC 3623 and NGC 3627 are significantly different [6]. We hence concluded that the galaxies of the triplet have assembled into a group only recently, less than 1 Gyr ago. In the Leo II group, where unlike in the previous cases, the X-ray emitting gas was detected around two central galaxies, the observed circumnuclear kinematically decoupled stellar substructures turned out to be old. They have different ages – 6 Gyr in NGC 3608 and 10 Gyr in NGC 3607 [7]. At the same time, the peripheral lenticular galaxies NGC 3599 and NGC 3626 reveal the very young age and even locally current star formation in the central stellar subsystems [8]. The evolution of the central regions of early-type galaxies in the rich massive group NGC 80 also turned out to be asynchronous. This group has a large X-ray halo and is sometimes classified as a poor cluster. In this group the early-type galaxies have very different SF histories in their central parts: estimates of the mean age of stellar populations both in the nuclei and in the central spheroids are ranging from 1.5–3 Gyr (in the giant elliptical galaxy NGC 83 and in the S0 galaxy IC 1548) to more than 10 Gyr in NGC 79 (an elliptical) and IC 1541 (a lenticular galaxy).
This paper presents the results of analysis of the properties of stellar population in the galaxies of another massive group with X-ray emitting gas: the NGC 524 group. This group was cataloged for the first time by Geller and Huchra in 1983 [10]. Then, only 8 member galaxies were listed in it. Later, Jaan Vennik [11] has made a visual inspection over the Palomar maps and found 18 bright and 13 dwarf galaxies there via the interaction hierarchy method. As concerning the latest catalogs, Brough et al. [12], by applying the FOF (friend-of-my-friend) method, have identified 16 members in the NGC 524 group, and, according to the Catalog of Nearby Groups by Makarov and Karachentsev [1], the group also contains 16 member galaxies. If we adopt the radius of the group from the catalog by Makarov and Karachentsev, kpc, the NED retrieves in this group 10 galaxies brighter than . Most of them are classified as lenticular galaxies. Given the galaxy velocity dispersion in the group of about 150 190 km/s [1, 12], the group must be rather massive, [13]. The ROSAT mapped the X-ray emitting gas in the NGC 524 group, however, the radius of the X-ray spot is less than 60 kpc, hence in some papers the hot gas is not considered as belonging to the halo of the group, but only to the central galaxy NGC 524 [14]. By undertaking the panoramic spectroscopy we have investigated stellar populations and kinematics of circumnuclear regions in the brightest non-central galaxies of the group: NGC 502, NGC 509, NGC 516 (all lenticulars), NGC 518, and NGC532 (both early-type spirals). The global characteristics of the galaxies under consideration, adopted from the NED and HYPERLEDA databases, are given in Table 1. As for the central galaxy of the group, NGC 524, the results for it obtained with the MPFS/BTA have been published by us earlier [15].
| Galaxy | NGC 502 | NGC 509 | NGC 516 | NGC 518 | NGC 532 |
|---|---|---|---|---|---|
| Type (NED1) | SA(r) | S0? | S0 | Sa: | Sab? |
| (RC32) | 34 | 43 | 39 | 52 | 75 |
| (RC3) | 13.57 | 14.20 | 13.97 | 13.56 | 12.91 |
| (RC3NED) | –18.3 | –17.7 | –17.9 | –18.3 | –19.0 |
| , km/s (NED) | 2489 | 2274 | 2451 | 2725 | 2361 |
| Separation off the group center3,2, kpc | 282 | 151 | 68 | 101 | 126 |
| Distance to the group4, Mpc | 24 | ||||
| Photometric parameters of the bulges, according to [23] | |||||
| 3.5 | 2.9 | 2.9 | 7.4 | 5.4 | |
| 1.5 | 1.5 | 1.85 | 2 | 2 | |
| Kinematical parameters of the bulges, according to the present work | |||||
| , km/s | 59 | 57 | |||
| , km/s | 96 | 77 | 65 | 98 | 110 |
| 1NASA/IPAC Extragalactic Database | |||||
| 2Third Reference Catalogue of Bright Galaxies [16] | |||||
| 3from [17] | |||||
| 4from [18] | |||||
2 OBSERVATIONS AND DATA REDUCTION
Panoramic spectral data were obtained for the central parts of five large galaxies of the NGC 524 group with the Multi-Pupil Fiber Spectrograph (MPFS) installed in the primary focus of the 6-m BTA telescope of the SAO RAS – for the description of the instrument, see [19]. To study the stellar populations and stellar kinematics, the blue–green spectral range of 4150-5650 Å was observed with reciprocal dispersion of 0.75 Å per pixel (spectral resolution of about 3 Å). For the galaxy with an emission-line spectrum (with a large amount of warm ionized gas in the center), NGC 532, we also exposed the red spectral range 5800 7200 Å to investigate the kinematics of the gas component in the center of the galaxy, and also to calculate the correction to the Lick index H for the contamination of the absorption line by emission by using the measurement of the equivalent width of the H emission line. The detector used was a EEV42-40 CCD, with a format of pixels. At the observations with the MPFS, an array of square microlenses, assembled into a square field of view sized elements constructs a matrix of micro-pupils, which is then reformed into a pseudo-slit via the optical fibers and fed to the spectrograph input. This configuration allows to record 256 spectra in one exposure, each of which characterizes a spatial element of the image of the galaxy sized about . To calibrate the wavelength scale, each time before and after the target, a comparison spectrum of the helium–neon–argon lamp was exposed; in order to correct for the vignetting and different transmissions of the microlenses, we used the inbuilt continuum lamp of the spectrograph and the spectrum of the twilight sky. The primary data processing, which includes the bias subtraction, removal of traces of cosmic hits, extraction of one-dimensional spectra for every pixel, and linearization of the extracted spectra, was performed using original software written in the IDL environment.
To calculate the kinematical parameters of the stellar component – line-of-sight velocities and stellar velocity dispersions – the spectrum of each spatial element after the continuum subtraction and the transformation to the velocity scale was cross-correlated with the spectra of type G8–K2 giant stars. They were observed the same night and using the same instruments as the galaxies. For the cross-correlation of spectra of younger stellar populations we used the twilight sky spectrum (of G2-type) as the reference frame. The accuracy of the wavelength scales and the zero point of measured velocities were checked with the night-sky line [OI]5577 Å. We estimate the accuracy of individual measurements of velocities for the stellar component as 5–7 km/s. After having obtained the kinematical parameters, we derived the properties of the stellar populations – their age, total metallicity and the ratio of the abundances of magnesium (the –process product) and iron – through the Lick indices H, Mgb, Fe5270, and Fe5335 for every one-element spectrum. Definition of the Lick index system was taken following the papers by Worthey et al. [20, 21]. The resulting maps of the Lick indices – Mgb and for all galaxies and H for the lenticular galaxies without noticeable emission lines in the spectra – are presented in Figs. 1–5. Detailed model calculations exist for these strong absorption lines within the stellar population synthesis models, which associate the indices (equivalent widths of absorption lines) with the mean (weighted with the luminosity of stars) properties of the stellar populations, the so–called SSP–equivalent (SSPSimple or Single Stellar Population) ages and metallicities. From the variety of available model calculations, we have chosen the Thomas et al. models [22] for the comparison with our observational results, since these models are calculated for several values of the magnesium-to-iron abundance ratio, and, therefore, provide determination, besides the age and total metallicity, of this third parameter of the stellar population which is very important to restrict the duration of the star formation. A detailed log of observations of the NGC 524 group galaxies is presented in Table 2.
| Galaxy | Date | Exposure, min | Spectral range, Å | Seeing, arcsec |
|---|---|---|---|---|
| NGC 502 | 17.09.2006 | 60 | 4150–5650 | 2.0 |
| NGC 509 | 18.09.2006 | 120 | 4150–5650 | 1.5 |
| NGC 516 | 17.09.2006 | 60 | 4150–5650 | 2.0 |
| NGC 518 | 19.08.2007 | 150 | 4150–5650 | 1.3 |
| NGC 532 | 08.10.2004 | 120 | 4150–5650 | 1.2 |
| NGC 532 | 06.09.2008 | 40 | 5800–7300 | 1.5 |
3 RESULTS
3.1 Two-dimensional distributions of Lick indices
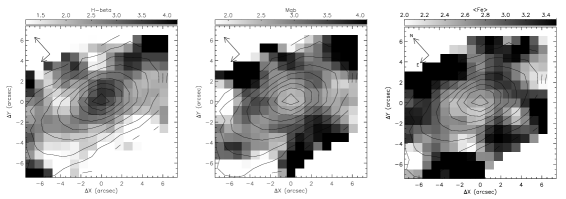
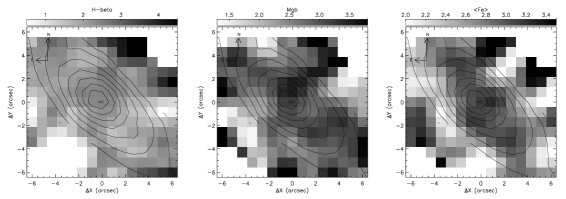
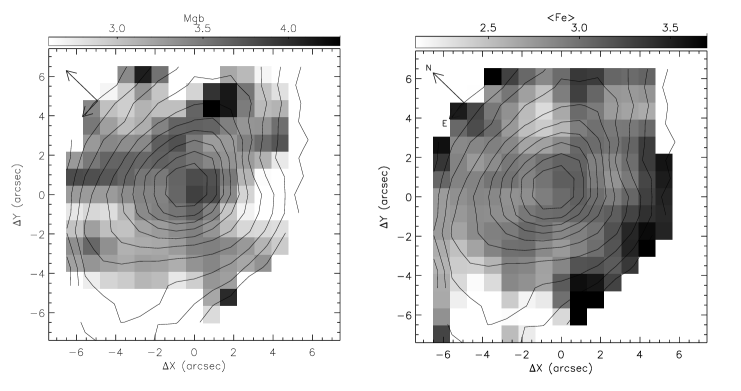
The morphology of the stellar population parameters in the central regions of galaxies can be qualitatively characterized by the distributions of the Lick indices of metals (magnesium and iron) and hydrogen. These distributions are shown in Figs. 1 5. Let us consider individual features of these distributions for every galaxy.
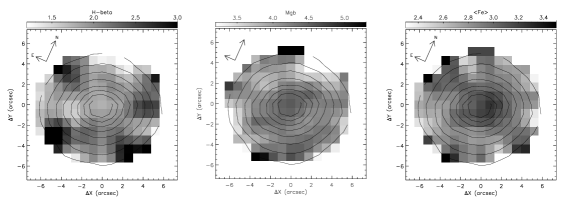
NGC 502, Fig. 1. The morphology of the Lick indices in NGC 502 can be described as an increase of the equivalent line widths of magnesium and iron in the nucleus with a simultaneous weakening of H. This can result from an enhanced metallicity of stars in the geometric center of the galaxy: the galaxy reveals a chemically decoupled nucleus. In other respects, no noticeable features or anisotropy are observed in the distributions: NGC 502 is viewed almost face-on, and the properties of the stellar population are centrally symmetric.
NGC 509, Fig. 2. This lenticular galaxy, viewed edge-on, demonstrates an opposite character of the distributions of Lick indices: one can note a prominent peak of H in the nucleus, a less pronounced enhancement of the hydrogen index near the equatorial plane of the galaxy, as well as the compact minima of the magnesium and iron indices near the center of the isophotes. We will see below that such morphology mainly comes from the effect of age: the stellar population in the nucleus is much younger than that around the nucleus. Interestingly, the Mgb minimum is embedded into a nearly circular ring of high Mgb index values, although the isophotes are elongated much stronger than the ‘isoindex’ contours. It justifies the averaging of the indices in round rings to estimate the stellar population parameters in the bulge.
NGC 516, Fig. 3. NGC 516 is a small lenticular galaxy, like NGC 509, and as well is viewed edge-on. It is located very close to the center of the group, only about 70 kpc off the central group galaxy NGC 524 in projection onto the sky plane, and their systemic velocities are also close. In Fig. 3, just like as in the case of NGC 509, we observe the strengthening of the H index in the nucleus, but this time the indices of magnesium and iron exhibit the maxima instead of minima at this point. Moreover, the increase of the iron index clearly has a disk morphology: it is not a compact spot, but rather the narrow lane across the entire field of view. If the increase of H is an effect of the age (as we shall see below), we can conclude that the starforming burst in NGC 516 was more prolonged than that in the center of NGC 509, that the star formation was not confined to the nucleus, but rather was expanded over the disk, and due to it the stellar disk managed to get enriched with heavy elements.
NGC 518, Fig. 4.The spiral galaxy NGC 518 is viewed under a high inclination, but not exactly edge-on [23]. The spectra of the central region reveal a moderate emission line at the bottom of the H absorption line, hence in this case the Lick index H is contaminated by emission, and in Fig. 4 we do not give its map because it is not informative concerning the age. Before using it to analyze the properties of stellar population, it has to be corrected for the contribution of the emission. A chemically decoupled stellar nucleus of the galaxy can be distinguished in the distributions of the magnesium and iron indices; it is possibly compact only in Mgb, and has an extended morphology in the iron index distribution. We encountered this feature at the centers of early-type galaxies more than once – e.g., in the S0-galaxy NGC 1023 [24]. It can be interpreted as a rapid exhaustion of the star formation burst in the nucleus and a subsequent continuous process of star formation in the circumnuclear ring.
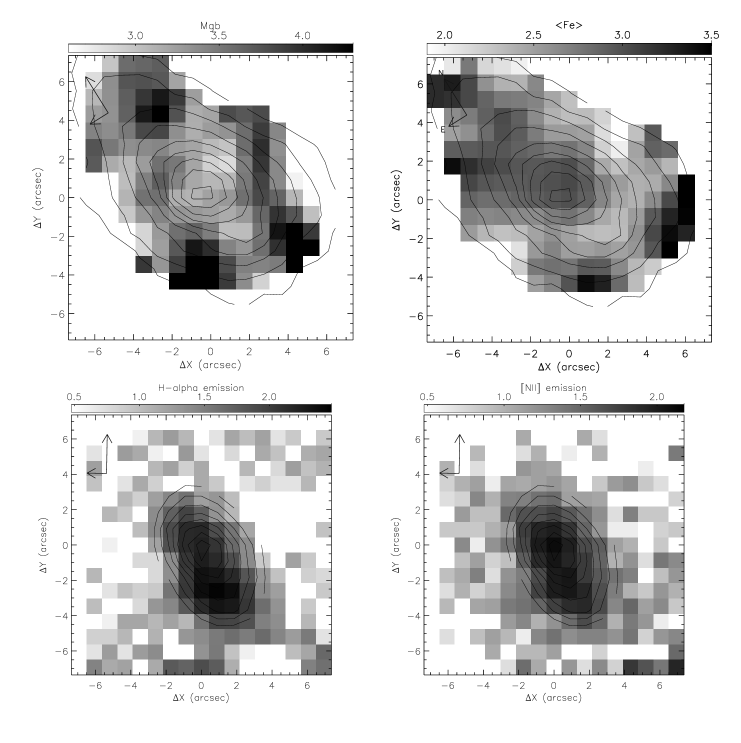
NGC 532, Fig. 5. In the central region of this galaxy the emission lines of warm ionized gas are very strong. To properly take them into account, we took an MPFS spectrum in the red range, and in Fig. 5, besides the maps of the Lick indices of magnesium and iron (which are equivalent widths of absorption lines), we additionally present the maps of flux distribution in the H and [NII]6583 emission lines (in arbitrary counts). All the distributions look complex and asymmetrical, even the maps of the emission-line flux distributions. The peak of emission of the forbidden nitrogen line comes from the nucleus, whereas the maximum of the H emission line – from a compact region of about to south of the nucleus. From the flux ratio in these lines (H/[NII] = 1.66 in the nucleus, and above 2 outside the nucleus), using the diagnostics by Veilleux and Osterbrock [25], we can say that the excitation of the nucleus of NGC 532 is a LINER-like, and the major part of current star formation is localized in the circumnuclear disk, and exactly to the south of the nucleus. The measured emission line intensities and the character of excitation of the ionized gas we have determined, is used later on to correct the Lick H index for the contamination by emission.
3.2 Age and chemical composition of stellar populations in the nuclei and bulges
To employ benefits of the panoramic spectroscopy, we summarized the spectra in the rings, centered onto the nuclei of the galaxies, when advancing along the radius step by step of one arcsecond. This has allowed to obtain the spectra for the galaxy bulges with the same signal-to-noise ratio, as for the nuclei. With our exposures of about one hour and after the summation of the spectra in the rings, the accuracy of measured indices is about 0.1 Å, that was determined by us during the larger survey of lenticular galaxies with the MPFS through the repeated observations of some galaxies [26]. Further we discuss the characteristics of the stellar populations in the nuclei and in the ring zones of the bulges, which we have obtained from the Lick indices.
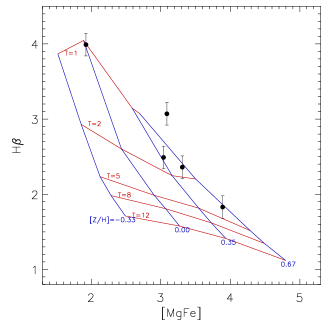
To determine the average (weighted with the luminosity of stars) characteristics of the stellar populations: the age, total metallicity, the abundance ratio of magnesium and iron, let us compare our measurements of the Lick indices in the galaxies with the models from [22] calculated in the framework of the SSP (Simple or Single Stellar Population) star formation histories, that is, assuming the same age and the same chemical composition in all stars that contribute to the integrated spectrum (of a single spatial element of the galaxy in our case). To determine the abundance ratio of the magnesium and iron, we will use an index-index diagram that confronts the Mgb and (Fe5270+Fe5335)/2 indices. To determine the age and total metallicity we compare the H hydrogen index and a composite index of metals, [MgFe]: this diagram allows to separate the effects of age and metallicity (to solve the degeneracy), since the sequences of equal metallicity and equal age have different slopes and form a kind of a curvilinear coordinate grid, which allows to determine both the age and metallicity of the stellar population based on the position of the observational point within this grid. The H index, which is used to determine the age of the stellar population should be corrected for the contamination by the emission component. In the case of NGC 532, for which we have got a spectrum in the red range, this was done through the equivalent width of the H emission line. In the nucleus, we used the average ratio of the equivalent widths of the Balmer emission lines EW(HEW(H, found from a large inhomogeneous sample of spiral galaxies by Stasinska and Sodre [27]. At a distance of 4”-6” from the nucleus, where current star formation dominates as a gas excitation mechanism, instead of 0.25 we used a coefficient of 0.35, typical for the gas excitation by young stars [28]. If we use the relation from Stasinska and Sodre [27] for the bulge, the age estimate for the bulge would decrease by 0.5 Gyr – from 4 to 3.5 Gyr. For NGC 518, where the emission lines are weaker than in NGC 532, and there exist no data in the red spectral range, we used a statistical mean ratio EW(HEW([OIII]5007 Å) found for the early-type galaxies by [29]. The calculated in such a way equivalent width of the H emission line is a correction to be added to the measured H index, to correct it for the emission (by the definition of the Lick indices as the equivalent widths).
| Galaxy | H | Mgb | T, Gyr | [Z/H] | [Mg/Fe] | |
|---|---|---|---|---|---|---|
| NGC 502 | 1.83 | 4.60 | 3.29 | 3.5 | ||
| NGC 509 | 3.99 | 1.85 | 2.00 | 1 | 0.0 | 0.0 |
| NGC 516 | 2.49 | 3.08 | 3.00 | 2 | 0.0 | |
| NGC 518 | 2.36 | 3.86 | 2.84 | 2 | ||
| NGC 532 | 3.07 | 3.19 | 2.99 | 1 | 0.0 |
 |
 |
| (a) | (b) |
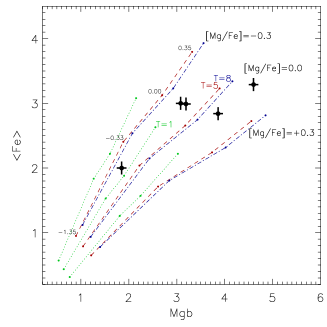
Table 3 gives the Lick indices and the stellar population parameters, derived from them, for the nuclei of the studied galaxies. Figure 6 demonstrates a comparison of the observed indices with the models from [22]. The first thing that catches the eye is that in four of five galaxies, the stellar nuclei are very young, with an average age of the stellar population of 1 2 Gyr. Secondly, in four of five galaxies (though not the same) the metallicity of the stellar population in the nuclei is very high, with the total metal abundance 3-5 times higher than the solar. Obviously, we see the consequences of the recent highly efficient starforming bursts in the nucleus, and the chemically decoupled nuclei of galaxies they generated. The magnesium-to-iron ratio in three out of four young nuclei is solar, and only in NGC 518, where we noted a larger compactness of the magnesium index peak compared with that of the iron (Fig. 4), this ratio is one and a half times greater than solar. That means that in these three nuclei the burst of star formation has been long enough, lasting for at least 2-3 Gyr. It was perhaps more brief in the nucleus of NGC 518, though it was going on for the same 2–3 Gyr in the immediate vicinity of the nucleus, already starting from the radius of 2” (300 pc).
| Galaxy | H | Mgb | T, Gyr | [Z/H] | [Mg/Fe] | |
|---|---|---|---|---|---|---|
| NGC 502 | 1.95 | 4.13 | 2.82 | 4 | ||
| NGC 509 | 1.90 | 3.06 | 3.02 | 5 | ||
| NGC 516 | 1.96 | 2.65 | 2.84 | 6 | ||
| NGC 518 | 2.23 | 3.12 | 2.78 | 3 | 0.0 | |
| NGC 532 | 2.06 | 3.42 | 2.68 | 4 |
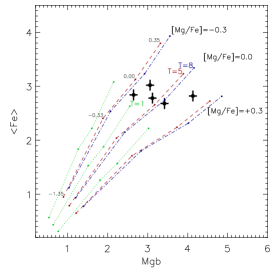
Table 4 lists the Lick indices and the stellar population parameters derived from them for the bulges of the galaxies under consideration; the bulges taken in the rings between and (0.65–1.0 kpc radius). Figure 7 compares these data to the models from [22]. The scatter of the magnesium-to-iron abundance ratio in the stellar populations of the bulges is significant: it may be either higher than solar (in the bulge of NGC 502), or significantly lower than the solar, as in the bulges of NGC 509 and NGC 516. If [Mg/Fe] is known to be typical for rather large spheroids [30, 31], [Mg/Fe] is on the other hand a very rare case among the galaxies, and is found mainly in irregular dwarfs of the Local Group. The magnesium underabundance can be treated in the frame of the chemical evolution theory as a signature of intermittent character of star formation, with a small number of bursts separated by long, 2–3 Gyr lasting, quiescent periods [32]. Meanwhile, the mean ages of stellar populations in all the five bulges of the NGC524 group galaxies are confined to a fairly narrow range of values, those between 3 and 5 Gyr, if for NGC 509 and NGC 516 we use the models from [22] with deficiency of magnesium relative to iron (Fig. 7c).
 |
 |
 |
| (a) | (b) | (c) |
The accuracy of the ages of stellar populations calculated for the bulges of five studied galaxies is about 1 Gyr if the galaxy age is of 3–4 Gyr, and about 2 Gyr for the ages of 5–6 Gyr. That means that the bulges of all the five studied galaxies have approximately the same mean age of the stellar populations within the precision claimed.
3.3 Relic circumnuclear rings
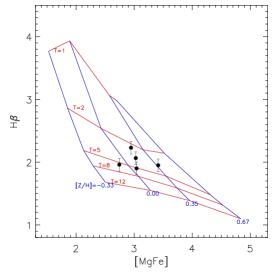
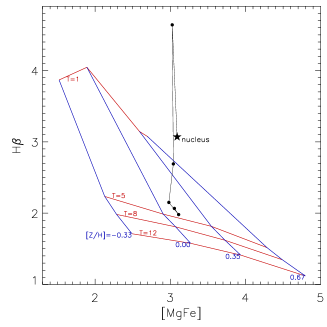
In addition to the bulges and unresolved stellar nuclei – two separate stellar subsystems that were found to have substantially different star formation histories in most of the galaxies studied here, – we can also point out such curious features as relic circumnuclear rings of past star formation. As we already noted, in NGC 518, at the radius of 300 pc, the iron index suddenly jumps up, while the magnesium index monotonously decreases, so that the Mg/Fe ratio in the nucleus and its nearest vicinity differs by a factor of one and a half. This can be explained by a prolonged star formation in the ring compared with a brief starburst in the geometric center of the galaxy. However, in NGC 518 this difference in the duration of star formation along the radius is visible only through the chemical composition of stars and is not revealed in the estimates of the mean ages of stellar populations. The mean age of stars in NGC 518 marginally increases from 2 to 3 Gyr along the radius so being constant within the estimate accuracy. In NGC 532, the circumnuclear ring of recent star formation can be seen by a ‘naked eye’. Figure 8a shows the H–[MgFe] diagram for NGC 532: the azimuthally averaged measurements of the Lick indices along the radius of the galaxy, starting from the nucleus, then in the ring at and further on with a step of one arcsecond. It can be seen how with the distance from the nucleus the age of the stellar population drops initially by a few hundred million years, and then abruptly increases, while in the bulge at the distances of 0.6 1.0 kpc from the center it practically does not vary. We can see that the youngest stellar population in the center of NGC 532 is concentrated in the ring at the radius of 2”. Curiously, this radius is distinguished both photometrically and kinematically. Figure 8b shows the variation of the isophote major axis orientation along the radius (calculated and published by us [23]) in comparison to the kinematical major axes, determined from the velocity fields of stars and ionized gas; the bottom plot shows the variationa of the isophote ellipticity. The point is photometrically distinct: at this radius, the ellipticity of the isophotes is maximal, and the major axes of the stellar component, both photometric and kinematical ones, simultaneously turn to larger position angles. Since the kinematical major axis of the stellar component is turned with respect to the line of nodes in the same direction as the photometric major axis, we can interpret the compact elongated stellar structure in the center of NGC 532 as an inclined circumnuclear stellar disk, which has been formed, as we have seen from the Lick indices analysis, rather recently, within 1 Gyr from our epoch.
 |
 |
| (a) | (b) |
4 CONCLUSIONS AND DISCUSSION
We have investigated the properties of stellar populations in the central regions of five early-type disk galaxies of the NGC524 group via the method of panoramic spectroscopy, by using the Multi-Pupil Fiber Spectrograph (MPFS), mounted at the prime focus of the Russian 6-m telescope. The central galaxy of the group, a giant S0 NGC524, was investigated by us by using the same instrument set up earlier [15]. We found there a homogeneously old ( Gyr) stellar population in all its substructures – in the stellar nucleus, in the bulge, and in the multi-tiered large-scale disk [15, 33]. In contrast with the central galaxy, the other galaxies of the group, as it turned out, have intermediate-age populations in the bulges and young stellar populations in the chemically decoupled stellar nuclei. Interestingly, the mean (SSP-equivalent) age of the stars in the bulges is about the same in all the five galaxies, Gyr, and the mean stellar age of the nuclei is approximately the same in four of the five galaxies studied, Gyr. Only the S0-galaxy NGC 502, the most distant from the group center, did not undergo a separate burst of star formation in the nucleus: its nucleus and bulge have the same age of 4 Gyr. Such a synchronous evolution of the galaxies in the group implies the decisive role of environment in stimulating the inner events in the lives of galaxies, and the bursts of star formation in their centers, first of all. In the NGC 524 group, no hot-gas medium is present over the entire volume of the group; only a compact X-ray halo was registered around the NGC 524 itself. It is therefore evident that the gravitational interactions play the defining role here. The time scales of building up the central regions of galaxies that we have identified for the NGC 524 group members, agree with the concordant cosmological simulations of the hierarchical clustering of matter in the Universe. Indeed, in LCDM cosmological models, massive clusters/groups of galaxies, , become gravitationally bound near the redshift one. For example, in a recent study by [34] the first “satellites” (non-central galaxies of a group) cross the virial group radius at the redshift of 1.5 ( 9 Gyr ago), and the most recent – around (6 Gyr ago). Falling within the virial radius, the galaxies experience the gravitational influence of both the potential of the entire group [35], and the tidal effects from the other group members during close passages [36]. These gravitational interactions distort the axial symmetry of the galactic disks, accreted by the group, leading to the formation of bars, and the bars, in their turn, redistribute the gas in the disks, forcing it to accumulate in the centers of galaxies. Further on, the bars may dissolve under the gravitational effect of the central concentration of mass. As a result, secondary bursts of star formation are expected exactly in the central kiloparsec, which should lead to the growth of bulges (and to a decrease of the mean age of the bulge stars), while in the galaxies that have not had prominent bulges before – just to the formation of central spheroidal components, or pseudobulges. Indeed, at in a dense environment of clusters and groups the blue disk galaxies are dominating [37, 38], which may be mistreated as spiral galaxies that are only approaching their transformation into S0s. In effect, these may be the disc galaxies including the S0s, that are in the process of a vigorous build-up of the bulges immediately after the accretion into a dense environment [39]. This process is observed to stop at , which is 3–4 Gyr ago, what is consistent with the bulge ages found by us in the disk galaxies of the NGC 524 group. Further, about 1-2 Gyr ago, the galactic nuclei experienced the secondary bursts of star formation, more compact, and obviously with more modest consequences than those that resulted in building-up the bulges. Interestingly, they are also synchronized. They are likely to be related with the dynamic evolution of the group as a whole: the crossing time of the group is approximately 2-3 Gyr. Around the large galaxies of the NGC 524 group we have found a significant number of blue dwarf galaxies, obviously rich in gas [23]. Any passage of a large galaxy through the center of the group may possibly provoke multiple accretion events by disturbing the orbits of dwarf companions, and this would supply the fuel for a nuclear burst of star formation, which had to be quickly and efficiently burnt out (the lenticular galaxies NGC 516 and NGC 509, where we found young stellar nuclei, are completely gas–free, according to [17]).
5 ACKNOWLEDGMENTS
The telescope operation and spectrograph managing was supported by the Ministry of Education and Science of Russian Federation (state contracts no. 16.552.11.7028 and 16.518.11.7073). We thank A. V. Moiseev and A. A. Smirnova for the observational support with the MPFS. During the analysis of the results, we have used the Lyon-Meudon Extragalactic Database (LEDA), maintained by the LEDA team of the CRAL at the Lyon Observatory (France), and the NASA/IPAC (NED) database of extragalactic data, managed by the Jet Propulsion Laboratory at Caltech under the state contract with the National Aeronautics and Space Administration (USA). This study of lenticular galaxies was supported by the RFBR grant no. 10-02-00062a.
References
- [1] D. Makarov, I. Karachentsev, MNRAS 412, 2498 (2011)
- [2] J. Kormendy, R.C. Kennicutt Jr., Ann. Rev. Astron. Astrophys. 42, 603 (2004)
- [3] O.K. Sil’chenko, A.V. Moiseev, V.L. Afanasiev, et al., Astrophys. J. 591, 185 (2003)
- [4] O.K. Sil’chenko, V. L. Afanasiev, V.H. Chavushyan, J.R. Valdes, Astrophys. J. 577, 668 (2002)
- [5] O.K. Sil’chenko, V. L. Afanasiev, Astronomy Letters 32, 534 (2006)
- [6] V.L. Afanasiev, O.K. Sil’chenko, A& A 429, 825 (2005)
- [7] V.L. Afanasiev, O.K. Sil’chenko, Astron. and Astrophys. Trans. 26, 311 (2007)
- [8] O.K. Sil’chenko, A.V. Moiseev, A.P. Shulga, Astron. J. 140, 1462 (2010)
- [9] O.K. Sil’chenko, V. L. Afanasiev, Astronomy Reports 52, 875 (2008)
- [10] M.J. Geller, J.P. Huchra, Astrophys. J. Suppl. Ser. 52, 61 (1983)
- [11] J. Vennik, Balt. Astronomy 1, 415 (1992)
- [12] S. Brough, D.A. Forbes, V.A. Kilborn, W. Couch, MNRAS 370, 1223 (2006)
- [13] D.A. Forbes, T. Ponman, F. Pearce, et al., Publ. of the Astron. Soc. of Australia 23, 38 (2006)
- [14] J. Osmond, T. Ponman, MNRAS 350, 1511 (2004)
- [15] O.K. Sil’chenko, Astron. J. 120, 741 (2000)
- [16] de Vaucouleurs G., de Vaucouleurs A. Corwin H.G., Jr., et al. ”Third Reference Catalogue of Bright Galaxies. Volume I: Explanations and References”. New York: Springer (1991)
- [17] Ch. Sengupta, R. Balasubramanyam, MNRAS 369, 360 (2006)
- [18] J.L. Tonry, A. Dressler, J.P. Blakeslee, et al., Astrophys. J. 546, 681 (2001)
- [19] V.L. Afanasiev, S.N. Dodonov, and A.V. Moiseev, in Proc. of the Conf. ”Stellar dynamics: from classic to modern”, St. Petersburg, Russia, 2001, Eds.: L.P. Osipkov and I.I. Nikiforov, (Saint Petersburg Univ. press, 2001), p.103
- [20] G. Worthey, S.M. Faber, J.J. Gonzàlez, D. Burstein, Astrophys. J. Suppl. 94, 687 (1994)
- [21] L.A. Jones, G. Worthey, Astrophys. J. 446, L31 (1995)
- [22] D. Thomas, C. Maraston, R. Bender, MNRAS 339, 897 (2003)
- [23] M.A. Ilyina, O.K. Sil’chenko, Astronomy Reports 56, 578 (2012); arXiv/astro-ph:1207.6247
- [24] O.K. Sil’chenko, Astron. J. 117, 2725 (1999)
- [25] S. Veilleux, D.E. Osterbrock, Astrophys. J. Suppl. 63, 295 (1987)
- [26] O.K. Sil’chenko, Astrophys. J. 641, 229 (2006)
- [27] G. Stasinska, L. Sodré Jr., A& A 374, 919 (2001)
- [28] D.E. Osterbrock, Astrophysics of Gaseous Nebulae and Active Galactic Nuclei (Mill Valley, CA: Univ. Science Books, 1989)
- [29] S.C. Trager, S.M. Faber, G. Worthey, J.J. Gonzàlez, Astron. J. 119, 1645 (2000)
- [30] G. Worthey, S.M. Faber, J.J. Gonzàlez, Astrophys. J. 398, 69 (1992)
- [31] S.C. Trager, S.M. Faber, G. Worthey, J.J. Gonzàlez, Astron. J. 120, 165 (2000)
- [32] G. Gilmore, R.F.G. Wyse, Astrophys. J. 367, L55 (1991)
- [33] O.K. Sil’chenko, I.S. Proshina, A.P. Shulga, S.E. Koposov, MNRAS accepted (2012)
- [34] T. Kaufmann, L. Mayer, M. Carollo, R. Feldmann, MNRAS submitted, arXiv1201.6605 (2012)
- [35] A. Villalobos, G. De Lucia, S. Borgani, G. Murante, MNRAS 424, 2401 (2012)
- [36] K. Bekki, W.J. Couch, MNRAS 415, 1783 (2011)
- [37] D.J. Wilman, A. Oemler, Jr., J.S. Mulchaey, et al. Astrophys. J. 692, 298 (2009)
- [38] D.W. Just, D. Zaritsky, D.J. Sand, et al. Astrophys. J. 711, 192 (2010)
- [39] D. Burstein, L.C. Ho, J.P. Huchra, L.M. Macri, Astrophys. J. 621, 246 (2005)