Absorption Features in the X-ray Spectrum
of an Ordinary Radio Pulsar
The vast majority of known non-accreting neutron stars (NSs) are rotation-powered radio and/or -ray pulsars. So far, their multiwavelength spectra have all been described satisfactorily by thermal and non-thermal continuum models, with no spectral lines. Spectral features have, however, been found in a handful of exotic NSs and thought to be a manifestation of their unique traits. Here we report the detection of absorption features in the X-ray spectrum of an ordinary rotation-powered radio pulsar, J1740+1000. Our findings bridge the gap between the spectra of pulsars and other, more exotic, NSs, suggesting that the features are more common in the NS spectra than they have been thought so far.
The study of neutron stars (NSs) offers a unique opportunity to understand physical processes under the most extreme conditions in the Universe. These super-dense, compact stars have extremely strong magnetic fields reaching up to a few hundred Teragauss. Thanks to the strength of the magnetic field and rapid rotation, young NSs are capable of generating and maintaining huge electric potential drops (up to a few Petavolts) across parts of their magnetospheres, leading to efficient particle acceleration, pair cascades and high-energy radiation. The vast majority () of known NSs are rotation-powered radio or -ray pulsars (?) (Fig. 1). The continuum emission of these objects (both thermal emission from the NS surface and non-thermal from the magnetosphere) has been extensively studied and has provided important information about the structure and properties of pulsar magnetospheres, the composition and temperature of the surface layers, and the state of the NS interior (?).
Recently, absorption features have been detected in the thermal X-ray spectra of a few unusual NSs – ‘X-ray dim Isolated NSs’ (XDINSs), which do not emit radio pulsations and likely have empty (or particle-starved) magnetospheres, Central Compact Objects (CCOs) in supernova remnants, which are radio-quiet NSs with low magnetic fields, and ‘Rotating Radio Transients’ (RRATs), which belong to a recently discovered class of NSs seen in the radio only intermittently. All of these NSs are atypical compared to ordinary, rotation-powered pulsars, and the spectral features have been attributed to peculiarities of these objects and exotic physics. For example, in XDINSs the surface magnetic field is strong enough for QED effects to be important, while for the very weakly magnetized CCOs the electron cyclotron energy for matter at the surface is low enough that it falls into the soft X-ray band. For ordinary pulsars (with magnetic fields G) neither of these conditions is expected to be satisfied at the NS surface and hence no analogous spectral features are expected in soft X-rays.
The 100 kyr old radio pulsar J1740+1000 was detected in 2002 (?). The pulsar’s spin period, ms, and its derivative, s s-1, place it among other relatively young pulsars in the - diagram (Fig. 1), suggesting that it is a fairly unremarkable pulsar, which loses rotational energy at a rate erg s-1 and has a surface magnetic field G. With the dispersion measure DM=24 pc cm-3 and Galactic latitude of , the derived distance of PSR J1740+1000 is 1.4 kpc or 1.2 kpc (according to the Galactic electron density models of (?) and (?), respectively). The off-plane location leads to fortuitously low interstellar absorption, making this pulsar one of the few whose spectra can be studied in softer X-rays ( keV). For 10% ISM ionization, the measured DM implies a hydrogen column density cm-2. The total Galactic HI column in this direction is cm-2 (?, ?).
X-ray emission from PSR J1740+1000 was first detected in a 20 ks Chandra ACIS observation (?). Here we report the results of observations with the XMM-Newton X-ray observatory European Photon Imaging Camera (EPIC) and Chandra X-ray Observatory Advanced CCD Imaging Spectrograph (see the supplementary text for observation details).
The phase-integrated spectrum of J1740+1000 (Fig. 2, left panel), measured with EPIC and ACIS, is well-fit (reduced =0.92, for 81 d.o.f.) in 0.2–10 keV by a model containing two blackbody (BB) components (?) (with eV, eV and km, km, for kpc) plus a power-law (PL) component with photon index and cm-2 (?) (here and below uncertainties are given at 68% confidence for a single parameter). The isotropic bolometric luminosity of dominant cooler thermal emission from most of the NS surface is erg s-1. The hotter thermal component with a factor of 140 smaller emitting area could be attributed to a hot spot on the NS surface. Being faint and hard, the PL component contributes significantly only above keV (Fig. 2). To simplify the analysis of the thermal emission, we only considered energies 1.1 keV and therefore ignore the PL component. The emission shows substantial pulsations with the pulsed fraction of in 0.2–1.1 keV (Fig. 3, left). Overall, the properties resemble those of other nearby middle-aged pulsars (Geminga, B0656+14, and B105552 (?, ?)).
Figure 3 (right) shows spectra corresponding to three selected phase intervals: [0.0-0.3] (“dip”), [0.3-0.6,0.8-1.0] (“rise and fall”) and [0.6-0.8] (“peak”). Large systematic differences appear between the three spectra. While overlapping at 0.3–0.5 keV and above 1 keV, the spectra differ markedly in 0.5–0.8 keV and below 0.3 keV. The relative differences in phase-resolved spectra cannot result from poor calibration (as all photons are detected with the same instrument during the same observation), and the residuals strongly suggest two phase-dependent spectral features. Indeed, when we added a Gaussian absorption line (GABS) to a single BB continuum (BBGABS, where GABS=; see Table 1 caption), the differences between the phase-resolved spectra in the 0.5-0.8 keV range could be accounted for solely by variations in the GABS parameters with the BB component held fixed. The 0.5-0.8 keV line-like feature is strong and present in all three phase intervals, but both the line’s central energy and strength vary with phase, becoming progressively stronger from the pulse maximum to the pulse minimum (Fig. 3). In the BBGABS fits there are no systematic residuals in the 0.5–0.8 keV range. The residuals below 0.3 keV vary in concert with the 0.5–0.8 keV absorption line strengths; however, with the relatively small number of photons collected we could not reliably characterize the parameters of the low-energy absorption feature which is at the edge of the EPIC sensitivity range.
As an alternative to the absorption feature scenario, we considered a pure continuum, BB+BB, model. We conclude that the absorption feature interpretation is strongly preferred over the hot-spot scenario (see supplementary material).
The more significant of the two spectral features has the central energy, – eV (see Table 1, bottom section), close to the crossover energy for the hot and cold BB components in the pure continuum model. Therefore, because even a two-component model is likely to be an oversimplification (one can expect the NS surface temperature to be a smooth function of the magnetic co-lattitude), one could speculate that the remaining residuals could be reduced by increasing the level of complexity and introducing yet another BB component. However, this would still not account for the phase-dependent changes below keV. One could introduce yet another even cooler BB, but this emission would have to come from the bulk of the NS surface and hence should not depend on the rotation phase. Therefore, with the data in hand, the Occam’s razor strongly favors the spectral feature interpretation.
So far, absorption features were seen only in the spectra of atypical, exotic isolated NSs. These features are expected to provide an important diagnostic of the NS equation of state, atmospheric composition and magnetic field strength (?, ?). Various interpretations have been put forward. Among widely discussed options are (a) atomic transitions in the magnetized NS atmospheres or condensed surface layers (?, ?) and (b) cyclotron absorption features produced either by electrons in the NS magnetosphere (?, ?) or protons (or light ions) in a hot ionized layer near the NS surface (?).
Can the explanations used for the absorption features of exotic NSs be applied to the case of J1740+1000? The energy of the feature we fitted is keV, while the second, less significant feature is at keV. These energies are too large for transitions in a magnetized hydrogen atom in the G surface field (?). The energies possibly could match a transition to an excited state in hydrogen-like ions (?) for . In this case, the detected spectral features would provide a direct probe of the composition and physical conditions of the surface layers (see e.g., (?) and references therein).
Alternatively, the two features could be the fundamental and the first harmonic of the electron cyclotron energy keV. However, in this case the absorbing/scattering particles must be located in the magnetosphere (?), at several stellar radii above the NS surface in a much weaker magnetic field, , where is the NS radius and is the magnetic co-latitude. Such a screen would then be analogous to the Earth’s van Allen belts. Such a scenario can also explain the phase dependence of the feature’s width and central energy, because the strength of the magnetic field and the density of the absorbing (scattering) screen should depend on the angle between the magnetic dipole axis and the observer’s line of sight. If the spectral features are indeed due to the cyclotron absorption in the magnetosphere, at least some regions of it must contain nonrelativistic (or mildly relativistic) electrons/positrons. The observed width of the 0.5-0.8 keV feature suggests that the mean velocity of these particles should not exceed 0.2–0.3 c. It is possible that a population of “warm” electrons exists in the closed line zone forming radiation belts (see (?) and (?)). Because the orientations of the pulsar spin and magnetic axis with respect to the observer’s line of sight are not known, it is possible that the line of sight traverses some volume in the closed field line region of the magnetosphere at all rotation phases, i.e., some absorption is always present. For the spin-down parameters of J1740+1000 equation 4 of (?) predicts optical depth of at eV, assuming the Goldreich-Julian charge density. However, it is widely accepted that the actual charge density in the pulsar magnetosphere must be larger due to pair production, and the multiplication coefficient of 200–300, required in our case, is comfortably below the typically discussed range of – (e.g., (?) and references therein). Because it is not clear why heavy () elements would be exposed only in certain parts on the NS surface (thus leading to phase-dependence), we currently prefer a magnetospheric interpretation of the absorption features.
There are three other middle-aged pulsars (Geminga, B0656+14, and B1055–52) which are similarly nearby, bright, and have low interstellar absorption. The spectra of these pulsars show significant variability with pulse phase, which has been commonly attributed to the changing view of the non-uniformly heated NS surface (?). However, even with allowance for such variability, noticeable phase-dependent residuals (?) in the spectral fits are yet to be explained. The spectral features found for J1740+1000 suggest that the systematic residuals for other pulsars may be better explained by a model with absorption feature(s). Indeed, there is strong evidence that the lines seen in XDINSs and/or CCOs also show strong phase dependence (?, ?). The dependence of absorption feature properties on pulsar characteristics can tell us about the physical origin of the features. For example, in the cyclotron scenario, the energies of the lines are expected to correlate with the magnetic field strength and possibly with the size of the magnetosphere. Atomic features would depend upon the pulsar surface density, temperature and composition (as is seen in, e.g., white dwarfs).
Acknowledgments: We thank Igor Volkov for useful discussions and advice and Zaven Arzoumanian for his help in preparing the observing proposal. This work was supported by National Aeronautics Space Administration grants NNX06AH67G and NNX09AC84G, and through Chandra Award Number G0-11096A issued by the Chandra X-ray Observatory Center, which is operated by the Smithsonian Astrophysical Observatory for and on behalf of the National Aeronautics Space Administration under contract NAS8-03060. The work was also partly supported by the Ministry of Education and Science of the Russian Federation (contract 11.G34.310001). The data used in this publication are freely available from the Chandra Data Archive (http://cxc.harvard.edu/cda/) and the XMM-Newton Science Archive (http://xmm.esac.esa.int/xsa/).
| Parameter | Phase interval | ||
|---|---|---|---|
| Dip | Rise and Fall | Peak | |
| [0.30.6],[0.81.0] | [0.68.0] | ||
| BB+BB (fixed eV), for 65 d.o.f. | |||
| , km | |||
| , km | |||
| BB+BB (, are fitted), for 59 d.o.f. | |||
| , eV | |||
| , km | |||
| , eV | |||
| , km | |||
| GABSBB model, for 60 d.o.f. | |||
| , eV | (tied) | ||
| , km | (tied) | ||
| , eV | |||
| , eV | |||
| EW, eV | |||
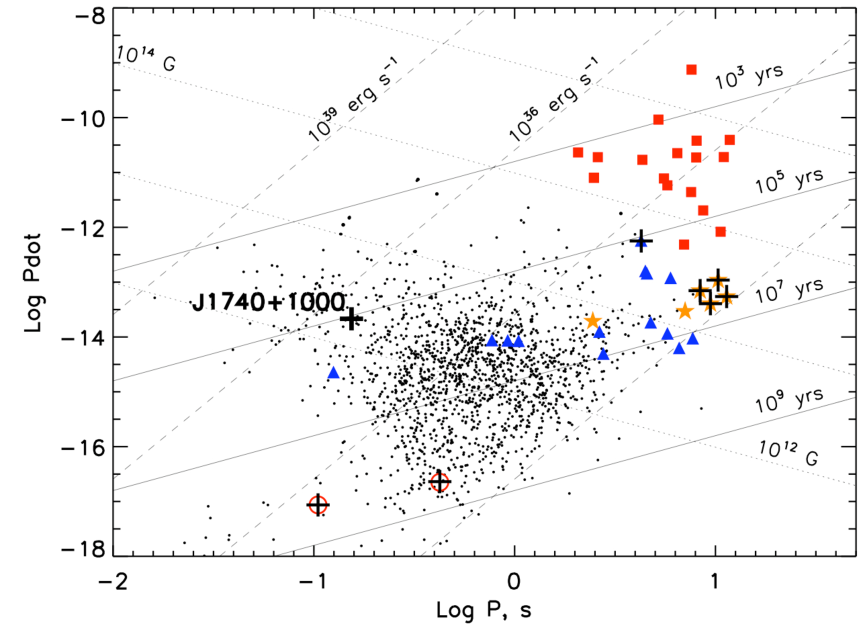
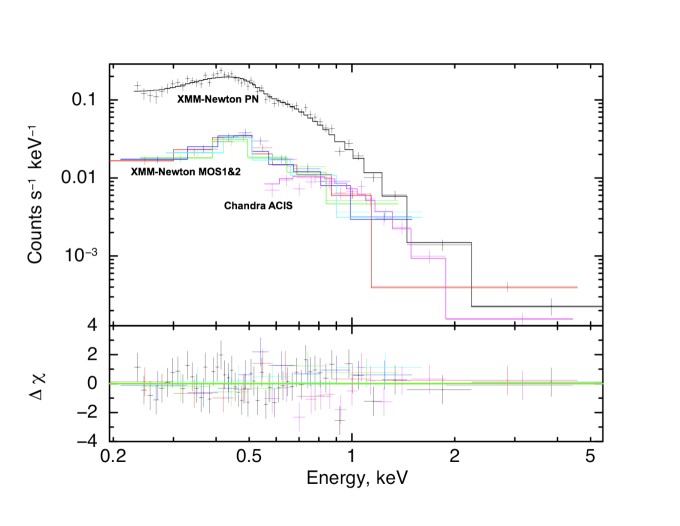
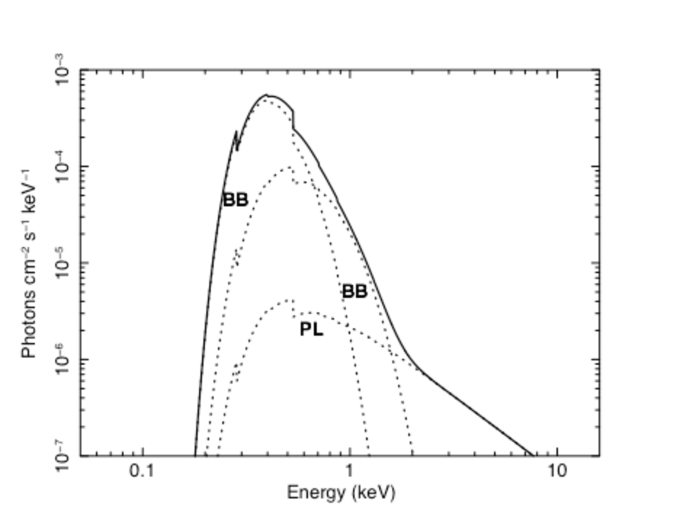
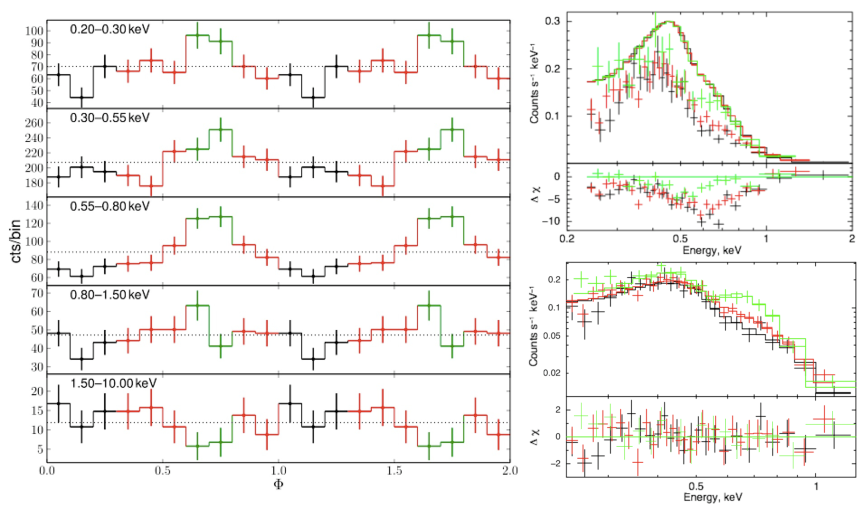
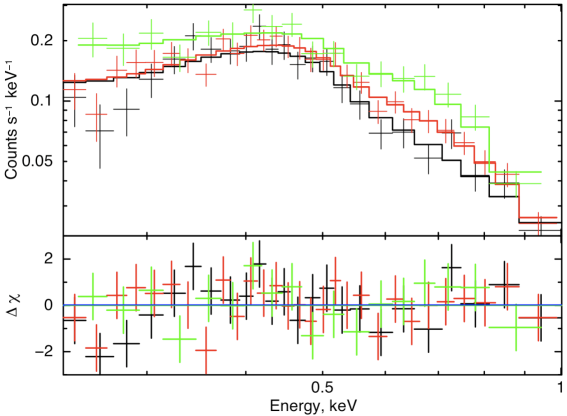
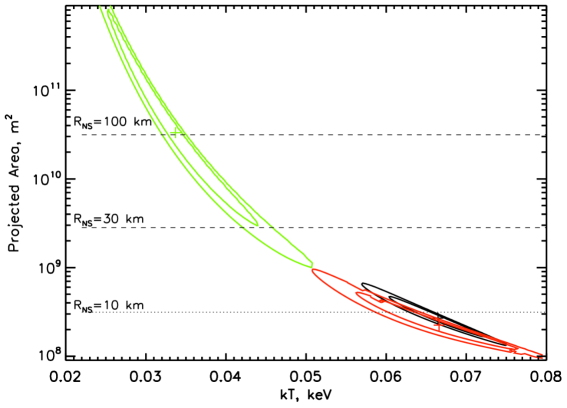
Figure S1: Top: EPIC-PN count-rate spectra below 1.3 keV together with the best-fit BB+BB model for the three chosen phase intervals, leaving significant non-zero residuals below 0.3 keV and in 0.5–0.8 keV range. Bottom: Confidence contours (68% and 90% for single interesting parameter; =1.0, and 2.7, respectively) for the cool BB component of the BB+BB fit to the phase resolved spectra. During the contour calculation, was frozen at the best-fit value of cm-2, while the rest of the parameters were re-fitted at each point of the grid.
Supplementary Material
Details about X-ray observations: The EPIC PN detector was operated in Small Window mode, providing a time resolution of 5.7 ms, while the MOS1 and MOS2 detectors were in Full Frame mode with a 2.6 s time resolution. After correcting for dead time, the useful PN exposure was 46 ks. The aim of this observation was to analyse the X-ray spectrum as a function of pulse phase (i.e., phase-resolved spectroscopy). We also acquired a 64.6 ks Chandra ACIS observation, with a much higher angular resolution of but a coarser time resolution of 3.2 s. Prior to fitting, all the spectra were grouped to have at least 30 counts per bin. The background contribution is completely negligible for the ACIS data while for the EPIC data it was 8%–13% (in 0.2-10 keV), becoming significant only at photon energies keV. In total we have analyzed 4,448 photons in 0.2–10 keV for EPIC and 397 photons in 0.5–8 keV for ACIS. Spectral modeling and fitting was done with XSPEC v. 12.7.0 (?).
Producing pulse profile and phase-resolved spectra: Pulsars are NSs characterised by their very regular periodic variations in brightness. PSR J1740+1000 has a period ms (or, equivalently, Hz) which generally decreases with time. However, one can directly measure the period at the epoch of observation from the obtained data, given sufficiently strong pulsed signal. We used the well-known (Rayleigh) test to search for the period in the vicinity of 154 ms (more precisely in 6.48-6.50 Hz range) in the EPIC PN data. The results show a clear and highly significant maximum () at Hz, which we used to calculate the phase and fold the pulse profiles shown in Figure 3 (left panel) and to extract the phase-resolved spectra.
Consideration of the alternative BB+BB model: Although the BB+BB model’s fit quality is formally acceptable (Table 1), there are a number of serious deficiencies:
-
•
The values are worse than those for the BBGABS model (Table 1). To check the chance occurrence probability for the reduction, we have carried out Monte-Carlo simulations (see below) following the recommendations of (?). The observed improvement is significant at 99.4% confidence even without taking into account the evidence for a second feature (below 0.3 keV) and a similar dependence of the strengths of the two spectral features on the pulsar phase (Figure 3, left panels).
-
•
Unlike the BBGABS model, systematic residuals remain both in 0.5–0.8 keV and below 0.3 keV (Fig. S1) despite the larger number of model parameters that are allowed to vary (12 in BB+BB vs. 11 in BBGABS; cf. middle and bottom sections of Table 1);
-
•
the size of the emitting area of the cooler BB component fitted to the “peak” spectrum ( km) substantially exceeds a conventional NS radius (Fig. S1, bottom panel) while fitting with a hydrogen atmosphere model would increase the apparent radius even further (?);
-
•
the “dip” spectrum cannot be fit satisfactorily by a BB+BB model. Even if we allow all parameters to vary, we find for 22 d.o.f, and the absorbing column becomes unreasonably large ( cm-2) and barely compatible with that from the phase-integrated fit. The intrinsically broad BB simply fails to adequately describe the narrow spectral peak (centered at about 0.64 keV) in the “dip” spectrum (Fig. S1, top panel).
Statistical comparison of BB+BB and BBGABS models: We calculated the ratio, , of the likelihood ratios for the BBGABS and BB+BB fits to the actual data. We then simulated 1000 “fake” spectra (using XSPEC “fakeit” command) based on the best-fit BB+BB model (null-hypothesis). These spectra mimic the expected noise fluctuations in a given exposure time (which was the same as for the real data). The same response and background files have been used. Each of the simulated spectra was then re-fitted with the BB+BB and BBGABS model with the temperatures, radii and the line parameters allowed to vary. For each of the fake spectra () we also recorded the ratio, , of the likelihoods for the BBGABS and BB+BB fits. We then calculated the number of instances with and found only six such cases. Therefore, for the real data the BBGABS model is statistically preferred over the BB+BB at a 99.4% confidence level even without taking into account the evidence for a second spectral feature with a factor of two lower energy and progressive strengthening of the features from the pulse maximum to the pulse minimum.
References and Notes
- 1. V. M. Kaspi, Proceedings of the National Academy of Science 107, 7147 (2010).
- 2. A. K. Harding, D. Lai, Reports on Progress in Physics 69, 2631 (2006).
- 3. M. A. McLaughlin, et al., ApJ 564, 333 (2002).
- 4. J. H. Taylor, J. M. Cordes, ApJ 411, 674 (1993).
- 5. J. M. Cordes, T. J. W. Lazio, ArXiv Astrophysics e-prints 0207156 (2002).
- 6. J. M. Dickey, F. J. Lockman, ARA&A 28, 215 (1990).
- 7. P. M. W. Kalberla, et al., A&A 440, 775 (2005).
- 8. O. Kargaltsev, Z. Misanovic, G. G. Pavlov, J. A. Wong, G. P. Garmire, ApJ 684, 542 (2008).
- 9. A simpler model, BB+PL, does not produce a satisfactory fit.
- 10. This value is used in all the subsequent phase-resolved spectral fits because having tied and fitting for it in the phase-resolved spectra results in a similar but more uncertain value.
- 11. G. G. Pavlov, V. E. Zavlin, D. Sanwal, Neutron Stars, Pulsars, and Supernova Remnants, W. Becker, H. Lesch, & J. Trümper, ed. (2002), p. 273.
- 12. A. De Luca, P. A. Caraveo, S. Mereghetti, M. Negroni, G. F. Bignami, ApJ 623, 1051 (2005).
- 13. D. L. Kaplan, A. Kamble, M. H. van Kerkwijk, W. C. G. Ho, ApJ 736, 117 (2011).
- 14. V. F. Suleimanov, G. G. Pavlov, K. Werner, ApJ 751, 15 (2012).
- 15. K. Mori, W. C. G. Ho, MNRAS 377, 905 (2007).
- 16. M. van Adelsberg, D. Lai, A. Y. Potekhin, P. Arras, ApJ 628, 902 (2005).
- 17. D. Sanwal, G. G. Pavlov, V. E. Zavlin, M. A. Teter, ApJ 574, L61 (2002).
- 18. M. H. van Kerkwijk, D. L. Kaplan, M. Durant, S. R. Kulkarni, F. Paerels, ApJ 608, 432 (2004).
- 19. H. Ruder, G. Wunner, H. Herold, F. Geyer, Atoms in Strong Magnetic Fields. Quantum Mechanical Treatment and Applications in Astrophysics and Quantum Chaos (Springer-Verlag, 1994).
- 20. V. Hambaryan, et al., A&A 534, A74 (2011).
- 21. M. Rajagopal, R. W. Romani, ApJ 491, 296 (1997).
- 22. Q. Luo, D. Melrose, MNRAS 378, 1481 (2007).
- 23. N. Bucciantini, J. Arons, E. Amato, MNRAS 410, 381 (2011).
- 24. M. S. Jackson, J. P. Halpern, ApJ 633, 1114 (2005).
- 25. F. Haberl, V. E. Zavlin, J. Trümper, V. Burwitz, A&A 419, 1077 (2004).
- 26. E. V. Gotthelf, J. P. Halpern, ApJ 695, L35 (2009).
- 27. R. N. Manchester, G. B. Hobbs, A. Teoh, M. Hobbs, AJ 129, 1993 (2005).
- 28. K. A. Arnaud, Astronomical Data Analysis Software and Systems V, G. H. Jacoby & J. Barnes, ed. (1996), vol. 101 of Astronomical Society of the Pacific Conference Series, p. 17.
- 29. R. Protassov, D. A. van Dyk, A. Connors, V. L. Kashyap, A. Siemiginowska, ApJ 571, 545 (2002).
- 30. G. G. Pavlov, Y. A. Shibanov, V. E. Zavlin, R. D. Meyer, The Lives of the Neutron Stars, M. A. Alpar, U. Kiziloglu, & J. van Paradijs, ed. (1995), p. 71.