Observations of vortex motion in the solar photosphere using HINODE-SP data
Abstract
In this work, we focus in the magnetic evolution of a small region as seen by Hinode-SP during the time interval of about one hour. High-cadence LOS magnetograms and velocity maps were derived, allowing the study of different small-scale processes such as the formation/disappearance of bright points accompanying the evolution of an observed convective vortical motion.
1 Introduction
The study of the small magnetic elements dynamics is fundamental to understand the interaction between magnetism and convection. Solar granulation is the evidence of the hot plasma going upward and coming down in the intergranular lanes. G-band bright points (thereafter GBPs) are found to be tracers of the convective motion, as they mainly move along intergranular lanes. In these movements, GBPs can get close to a strong downflow and start spiralling like water in a bathtub, as reported by Bonet et al. (2008). This spiral motion was also found at larger scales, e.g. in supergranular junctions (Attie, Innes & Potts 2009). Moreover, the way of tracking these vortex motions is quite different: computing horizontal velocity fields by using Local Correlation Tracking techniques, as one of the first works made about small-scale vortices in the photosphere of Brandt et al. (1988); using either passive tracers, like balltracking (Attie, Innes & Potts 2009) or active tracers, as GBPs in Bonet et al. (2008) can be good tools to find these elusive events.
2 Observations
The HOP 0014 was a joint campaign using HINODE instruments and the Swedish 1-m Solar Telescope (SST), among other ground-based telescopes at the Canary Islands Observatories. On September 29, 2007 a continuous sequence of high-quality data was taken. The target was a quiet Sun region close to disk center observed at a variety of wavelengths. The description of the full set of observations can be found at Balmaceda et al. (2010). In this work, we focus in the data taken with Hinode Spectro Polarimeter (Ichimoto et al. 2008). This data set consist of the full Stokes vector on the lines Fe i 630.15 and 630.25 nm, recorded from 08:20 to 09:45 UT in dynamic mode. The full FOV was 2.66” 40.57” and scanned with a cadence of 35 s. The exposure time was 1.6 seconds leading to a noise level of 1.4 ( is the mean continuum intensity) and with spatial resolution of the SP measurements of 0”15. The standard reduction procedure was applied to the SP data: correction for dark-current, flat-field and instrumental cross-talk.
3 Analysis
Fig. 1 shows the SP data sequence. From 08:20 UT to 09:20, images every 4 minutes are presented. The top row displays the LOS magnetograms obtained by computing the max .
In the middle sequence the integral of the absolute value of Stokes is shown, and in the bottom one the line-of-sight (LOS) velocity.
The magnetic structure, as seen in the magnetograms and the unsigned Stokes maps, integrated from -29pm to +29pm, shows the same configuration than in the first row,
and can be generally described as having two magnetic lobes. At 08:48, some bright points (as seen in the continuum and G-band, though not shown here) start developing between the two lobes,
and some of them can be seen moving
nearby the southern lobe (North at the top of the figure). The apparent rotation of these magnetic structure, about 150∘ in one hour, is observed in this sequence. These magnetic patches
follow a path whose common center is a draining point. At 09:04, more GBPs develop in the lower right corner and the rotation becomes more evident.
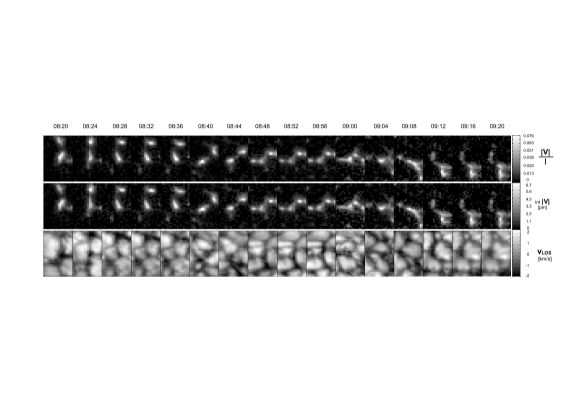
The velocity maps were calculated by the center-of-gravity method (Uitenbroek 2003). These maps, which follow the granulation behaviour, show in black the redshifted parts, (i.e., downflows),
and in white the blueshifts, that is, essentially, the granulation structure. The magnetic patches stay most of the time into intergranular lanes. A strong downflow region at 08:44 UT is visible
there. The profiles in this region are asymmetric double-lobed, confirming the presence of gradients of velocity or magnetic field (del Toro Iniesta 2003; Morinaga et al. 2007).
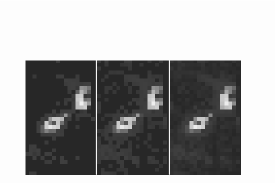
Fig. 2 shows a sample of the masks that can be used for removing noise in spectropolarimetric scans. Due to the short exposure time, the noise level increases considerably. In order to remove the noise present in the data, we apply different thresholds to create masks. Depending on the purpose, a very restrictive selection can mask out the noisy pixels but also remove some small-scale structures. In Fig. 1 the original image without removing any noise is shown at the right. The left and central panel show 5 and 3 masks respectively. In the 5 image, is evident that the main magnetic structure remains unaltered as well as some conspicuous bright points (see for instance the BP chain to the left of the northern lobe, or the ones located in the south of the southern lobe). However, in the 3 image, we can trace better the aforementioned structures.

Looking for downflows in the maps, we found one of the largest asymmetries in the Stokes profiles that are detected in the SP sequence is the one presented in Fig. 3. Three-lobed Stokes profiles are observed in a region with a strong downflow, of about 4 km s-1, at 09:21 UT (not shown in Fig. 1), located in a bright point area, and the |V|/I signal becomes more
intense and decreases again along 6 maps (more than 3 minutes), that corresponds to the lifetime of this event. Asymmetries in profiles can be due to very strong gradients of velocity or magnetic
field, so this behaviour could be the result of a possible convective collapse event. However, there are
other ways of producing such profiles: when two or more components with large Doppler shifts relative to each other overlap (Sigwarth 2001).
4 Discussion and concluding remarks
We have analyzed a sequence of Hinode SP data, applying a 3-mask, we justify the use in this work, since a 5 is more restrictive for identifying small magnetic elements. Magnetograms and velocity maps were obtained allowing to define the magnetic structure of interest and locate it in the intergranular lanes. The rotating structures become evident in the sequence. The appearance of downflows corresponding to BP locations were identified and as well as asymmetric Stokes profiles in those areas. Further detailed analysis of formation and disappearance of bright points associated to the observed vortex motion will be presented in a upcoming paper (Vargas Domínguez et al., in preparation).
Acknowledgments
Hinode is a Japanese mission developed and launched by ISAS/JAXA, with NAOJ as domestic partner and NASA and STFC (UK) as international partners. It is operated by these agencies in co-operation with ESA and NSC (Norway).
References
- Attie, Innes & Potts (2009) Attie R., Innes, D. E., & Potts, H. E. 2009, A&A, 493, L13
- Balmaceda et al. (2010) Balmaceda, L., Vargas Domínguez, S., Palacios, J., Cabello, I., Domingo, V. 2010, A&A, 513, L6.
- Bonet et al. (2008) Bonet, J. A., Márquez, I., Sánchez Almeida, J., Cabello, I., & Domingo, V. 2008, ApJ, 687, L131
- Brandt et al. (1988) Brandt, P. N., Scharmer, G. B., Ferguson, S., Shine, R. A, & Tarbell, T. D. 1988, Nature, 335, 238
- del Toro Iniesta (2003) del Toro Iniesta, J.C., “Introduction to Spectropolarimetry”, Cambridge Ed., 2003
- Ichimoto et al. (2008) Ichimoto, K., Lites, B., Elmore, D., Suematsu, Y., Tsuneta, S., et al. 2008, Sol. Phys., 249, 233
- Morinaga et al. (2007) Morinaga, S., Nagata S., Ichimoto, K., Suematsu, Y., Tsuneta, S., Katsukawa, Y., Shimizu, T., Shine, R., Tarbell T. D., Title A. M., Lites, B., Kubo M, Sakurai T., PASJ, 59, S613, 2007
- Sigwarth (2001) Sigwarth M., ApJ, 563, 1031 2001
- Uitenbroek (2003) Uitenbroek, H., 2003, ApJ, 592, 1225