Ortho-to-Para Ratio Studies of Shocked H2 Gas in the Two Supernova Remnants IC 443 and HB 21
Abstract
We present near-infrared ( m) spectral studies of shocked H2 gas in the two supernova remnants IC 443 and HB 21, which are well known for their interactions with nearby molecular clouds. The observations were performed with Infrared Camera (IRC) aboard the AKARI satellite. At the energy range 7000 K 20000 K, the shocked H2 gas in IC 443 shows an ortho-to-para ratio (OPR) of , which is significantly lower than the equilibrium value 3, suggesting the existence of non-equilibrium OPR. The shocked gas in HB 21 also indicates a potential non-equilibrium OPR in the range of . The level populations are well described by the power-law thermal admixture model with a single OPR, where the temperature integration range is K. We conclude that the obtained non-equilibrium OPR probably originates from the reformed H2 gas of dissociative J-shocks, considering several factors such as the shock combination requirement, the line ratios, and the possibility that H2 gas can form on grains with a non-equilibrium OPR. We also investigate C-shocks and partially-dissociative J-shocks for the origin of the non-equilibrium OPR. However, we find that they are incompatible with the observed ionic emission lines for which dissociative J-shocks are required to explain. The difference in the collision energy of H atoms on grain surfaces would make the observed difference between the OPRs of IC 443 and HB 21, if dissociative J-shocks are responsible for the H2 emission. Our study suggests that dissociative J-shocks can make shocked H2 gas with a non-equilibrium OPR.
1 Introduction
Infrared H2 line emission is a useful tool for studying shock-cloud interactions. H2 is one of basic coolants at the post-shock region (cf. Neufeld & Dalgarno, 1989; Hollenbach & McKee, 1989; Kaufman & Neufeld, 1996), and its infrared line emission usually suffers relatively small extinction effects (cf. Draine, 2003). The shock-excited H2 line emission has been widely observed from diverse targets, such as protostellar jets and outflows, supernova remnants, and interacting galaxies (Habart et al. 2005; Omont 2007; and references therein). Ground telescopes usually observe high excitation emission lines ( K) in the near-infrared wave bands, while space satellites observe low excitation emission lines ( K) in mid-infrared. The high excitation lines show the excitation temperature () of a few thousand kelvin, while the low excitation lines show that of a few hundreds kelvin (e.g., Rosenthal et al., 2000; Rho et al., 2001; Giannini et al., 2006; Caratti o Garatti et al., 2008; Shinn et al., 2011).
H2 line emission manifests one important diagnostic parameter of H2 gas: the ortho-to-para ratio (OPR). First we give a brief description of ortho- and para-H2. An H2 molecule consists of two identical proton nuclei, i.e., two identical fermions; hence, for a given nuclear spin combination, a specific rotational quantum number (space wave-function) is only permitted according to the Pauli exclusion principle (cf. Field et al., 1966; Shull & Beckwith, 1982). If the nuclear spins are summed to zero (, singlet), it is called as para-H2 and only even rotational quantum number () is allowed. On the other hand, if the nuclear spins are summed to one (, triplet), it is called as ortho-H2 and only odd- is allowed. The statistical weight () for a level () is a multiplication of the nuclear spin degeneracy and the rotational degeneracy, ; i.e., for ortho-H2 and for para-H2.
The OPR is the ratio between the abundance of ortho- and para-H2 in all levels. In general, lower levels are much more populated than higher levels (cf. Timmermann et al., 1996; Rosenthal et al., 2000). Therefore, the OPR is mainly determined by the OPR at low . This means that the OPR can be different from the abundance ratio of ortho- and para-H2 in high . In this paper, we make a note on the energy level when we mention the OPR at a specific range; otherwise, the OPR means the abundance ratio of ortho- and para-H2 summed over all . We also note that the OPR of H2 in local thermodynamic equilibrium (LTE) is equal to 3 at K, decreasing from 3 at K (cf. Burton et al., 1992; Sternberg & Neufeld, 1999). When the OPR is different from this LTE OPR, we call it as a non-equilibrium OPR.
The OPR of H2 is useful in estimating thermal history of the gas (Neufeld et al., 2006). Under typical conditions of molecular clouds, the collisional interconversion between ortho- and para-H2 is much slower than the collisional transitions between the same-type H2 (ortho-to-ortho and para-to-para). Therefore, the OPR have the information on how much interconversion collisions the H2 gas experiences and what the initial OPR of the H2 gas is. For shocked H2 gas, the possibility of the non-equilibrium OPR was briefly discussed by Chang & Martin (1991), and later this question was seriously addressed by Timmermann (1998) and Wilgenbus et al. (2000). The last two studies predicted the existence of H2 gas with the non-equilibrium OPR in C-shocks or partially-dissociative J-shocks (for the types of shocks, see Draine & McKee, 1993).
Hitherto observations have revealed shocked H2 gas of non-equilibrium OPRs from mid-infrared observations, which trace low energy levels of K (e.g., Neufeld et al., 1998; Rodríguez-Fernández et al., 2000; Lefloch et al., 2003; Neufeld et al., 2006; Quanz et al., 2007; Neufeld et al., 2007; Roussel et al., 2007; Hewitt et al., 2009; Maret et al., 2009; Neufeld et al., 2009). As far as we are aware, shocked H2 gas of non-equilibrium OPRs has never been observed at high energy levels of K (e.g., Gredel, 1994; Smith et al., 1997; Giannini et al., 2006; Caratti o Garatti et al., 2006). Here we report two cases suggesting the shocked H2 gas with non-equilibrium OPRs at such high levels, which is revealed from near-infrared spectral observations with the AKARI satellite. The targets are two supernova remnants IC 443 (G189.1+3.0) and HB 21 (G89.0+4.7), which are well-known for their interactions with nearby molecular clouds (for more about the targets, see Shinn et al. 2009, 2010, 2011). We present new HB 21 data here, while we used the previously presented data for IC 443 (clump B; i.e., IC 443B), which had been left for future analyses (Shinn et al., 2011). The results are discussed with respect to different shock types, and we conclude that the obtained non-equilibrium OPR may originate from the reformed H2 gas of dissociative J-shocks.
2 Observations and Data Reduction
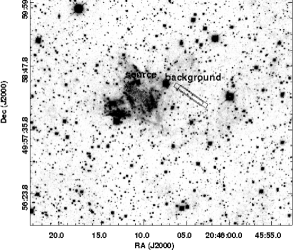
The AKARI near-infrared spectroscopic observations were performed on two regions of HB 21, where the shock-cloud interactions are under way. The two regions, “HB 21N” and “HB 21S”, are listed in Table 1. The “HB 21N” and “HB 21S” correspond to the regions “N2front” (Shinn et al., 2009) and “S1” (Shinn et al., 2010), respectively. Two nearby background positions (“HB 21N BG” and “HB 21S BG,” Table 1) were also observed in order to inspect if any background H2 line emission exists.
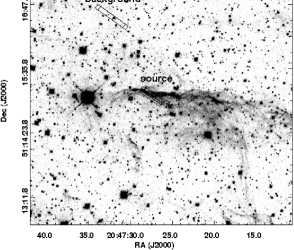
The observations were carried out with the Infrared Camera (IRC, Onaka et al., 2007) of the AKARI satellite (Murakami et al., 2007), on 2008 June 1-3 during the post-helium phase. All the observations were performed with the observation mode IRCZ4, which is designed for general spectroscopic observations. The IRCZ4 mode acquires the spectra from multiple exposures without dithering, taking one reference image in the middle of the exposures (Onaka et al., 2009). Based on this reference image, we corrected the observed astrometric positions employing the 2MASS catalog (Skrutskie et al., 2006); the resulting astrometric accuracy is smaller than . We used the slit and the grism, whose spectral resolution and wavelength coverage are m and m, respectively. Figure 1 shows the slit positions over the H2 (1) 2.12 m image of HB 21. The H2 2.12 m image was acquired with the Wide-field InfraRed Camera (WIRCAM) of Canada-France-Hawaii Telescope (CFHT) on 2007 August, and the data reduction was carried out employing the SIMPLE package (Wang et al., 2010).
We first applied the reduction pipeline for the AKARI post-Helium data (version 20110301, Onaka et al., 2009). The column pull-down effect was corrected and the hot pixels were masked out. No smoothing and tilt-correction were applied to the two dimensional spectral image, while running the pipeline. Then, we extracted a spectrum for each observation ID (cf. Table 1) by averaging the pixel values along the slit direction. Again these multiple spectra for each pointing position were averaged together, and the results are presented in Figure 2. Some spectra show an alternating noise pattern along the wavelength bin, but they do not affect the measurement of line intensity we intend. The calibration systematic error of 10 % (private communication with the AKARI helpdesk) was squarely summed to the line intensity error (Table Ortho-to-Para Ratio Studies of Shocked H2 Gas in the Two Supernova Remnants IC 443 and HB 21).
3 Analysis and Results
3.1 Line Intensity and Level Population
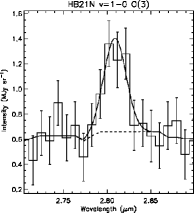
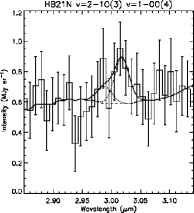
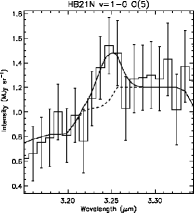
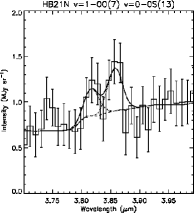
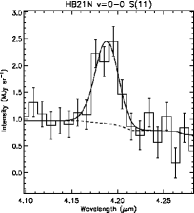
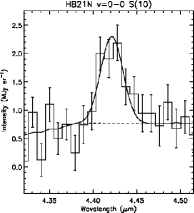
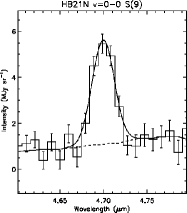
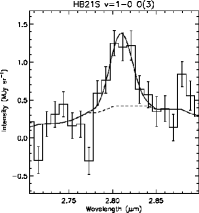
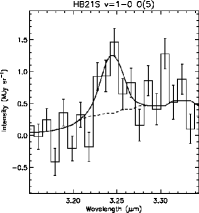
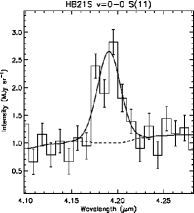
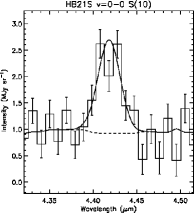
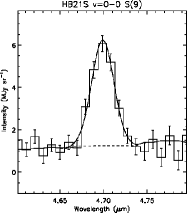
Figure 2 shows the AKARI spectra of HB 21. A few evident emission lines are seen from the spectra of “HB 21N” and “HB 21S.” On the other hand, no emission line is seen from the spectra of the background positions, “HB 21N BG” and “HB 21S BG”; hence, the background contribution of line emission is negligible. We identified all the detected emission lines are of H2, comparing the line positions to those detected in IC 443 (Shinn et al., 2011).
The line intensities were measured by fitting a Gaussian profile plus a synthetic continuum to the emission line spectrum. The synthetic continuum was made by median-smoothing the observed spectrum with a box kernel. The kernel width is wide enough to smooth the line features out; it is about 0.19 m. This continuum is displayed as a dashed line in Figures 3 and 4. We set the full-width-at-half-maximum of the Gaussian profile as the spectral resolution of IRC, m. When two lines are overlapped, we fitted both lines simultaneously. The fitting results are shown in Figures 3 and 4, and the measured line intensities are listed in Table Ortho-to-Para Ratio Studies of Shocked H2 Gas in the Two Supernova Remnants IC 443 and HB 21.
In order to derive the level population of the shocked H2 gas, we first performed the reddening correction to the measured line intensities. We employed the extinction curve of “Milky Way, ” (Weingartner & Draine, 2001; Draine, 2003), and adopted =(H I)+2(H2) cm-2 derived from the X-ray absorption towards the central region of HB 21 (Lee et al., 2001). Then, these reddening-corrected line intensities were used to derive the level population, assuming that the H2 emission is optically thin. This assumption is appropriate since the H2 emission lines become optically thick when cm-2, as noted in Shinn et al. (2011). If there was such a high cm-2 toward HB 21, the AKARI mid-infrared images (Shinn et al., 2009) should have shown absorbed features against background radiation, because the exceeds that of infrared dark clouds (Bergin & Tafalla, 2007).
We used the following equation to derive the extinction-corrected level population of the shocked H2 gas.
| (1) |
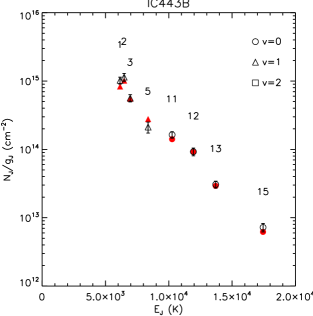
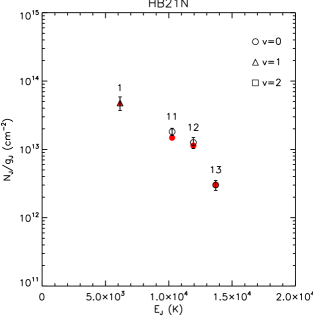
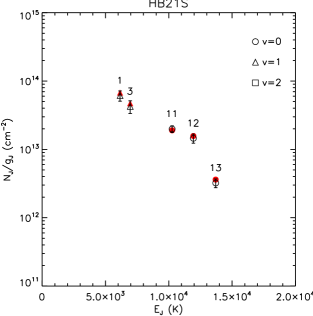
and are the reddening corrected line intensity and the Einstein-A radiative transition probability, respectively. , , and are the transition wavelength, Planck constant, and light speed, respectively. We employed the molecular physical constants tabulated in the simulation code CLOUDY (version C08.00; Ferland et al. 1998). The derived column densities are listed in Table Ortho-to-Para Ratio Studies of Shocked H2 Gas in the Two Supernova Remnants IC 443 and HB 21. Their population diagrams are shown in Figure 5; note that the LTE population appears as a straight line in this diagram.
The populations of ()=(0,11), (0,12), (0,13) show a zigzag pattern. The OPRs estimated with the single assumption are and for HB 21N and HB 21S, respectively ( K). These OPRs are non-equilibrium OPRs (cf. section 1). Note that IC 443B also showed the zigzag pattern (Shinn et al., 2011); the OPRs are estimated to be and for ()=(0,11-13) and (1,1-3), respectively ( K). We here underline that these () levels all reside at high energy, K.
In order to ascertain that the zigzag pattern seen from the levels ()=(0,11-13) reflects the intrinsic OPR , we examined as follows. We checked the flux calibration procedure including the data reduction pipeline, and found no indication of systematic features that can mimic the zigzag pattern. We also checked if any blended line exists for S(10) 4.41 m, which corresponds to the level ()=(0,12). There is no known strong atomic or ionic lines from shocks around 4.41 m (cf. Allen et al., 2008). The line blending between H2 emission lines is dealt with in section 3.2.1.
3.2 Power-law Thermal Admixture Model of Shocked H2 Gas with a Non-equilibrium Ortho-to-Para Ratio
The power-law thermal admixture model has been used to describe the level population of shocked H2 gas (Shinn et al., 2011, and references therein). We employed the same model used in Shinn et al. (2011), and slightly modified it for the reproduction of the non-equilibrium OPR, i.e., the zigzag pattern in the population diagram. The relative population between ortho- and para-levels is controlled by scaling the rate coefficients for the reactive collisions with H, which mediate the ortho-to-para and para-to-ortho transitions (cf. Le Bourlot et al., 1999). The final level population is obtained by integrating the following equation,
| (2) | |||||
| (3) |
where and are constants and K and K. The statistical equilibrium was assumed and the collisional partners are H2, He, and H. We assumed , and the abundance ratio of H to H2 was set as a free parameter .
Based on the previous observations of Shinn et al. (2011), we adopted K instead of 100 K unlike previous applications (e.g., Shinn et al., 2009, 2010). Shinn et al. (2011) found that two different densities are required to describe the level population of shocked H2 gas in the range of K: one with of cm-3 for K and the other of cm-3 for K. From these results, they recognized that only K gas is crucial to describe the level population of K. Therefore, we adopted K for the model calculation, since our data points spread over K (Figure 6).
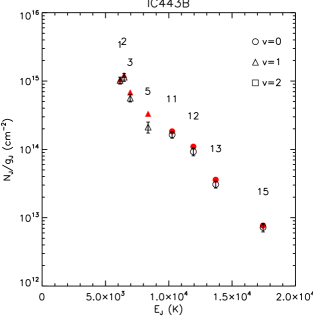
We then applied the model to the reddening-corrected level population of shocked H2 gas in IC 443B, HB 21N, and HB 21S. The fitting results are shown in Figure 6, and the corresponding model parameters are listed in Table Ortho-to-Para Ratio Studies of Shocked H2 Gas in the Two Supernova Remnants IC 443 and HB 21. In the case of IC 443B, we first tried to fit the data without any fixed parameters, but failed to have inversely diverging and ; increases over cm-3 and decreases below . These two parameters seem to be not well-constrained by the given data and error. Since such a high is unreasonable, we fixed the parameter . Two different fittings were performed with and . is chosen since it was obtained from the analysis of IC 443C (Shinn et al., 2011). is chosen since IC 443B seems to be experiencing a weaker shock than IC 443C, where was obtained. The intensity ratio is lower at IC 443B than IC 443C (Xu et al., 2011), and the “W-shaped” H2 morphology of IC 443 suggests that IC 443B may be denser than IC 443C (see Fig. 1 in Shinn et al., 2011). In the case of HB 21N and HB 21S, we fitted the data fixing both and , because the data points are too few. We just show the level population can be described by the power-law thermal admixture model. We adopted cm-3 and , which are thought to be typical values for shocked H2 gas of IC 443 (cf. Shinn et al., 2011). Figure 7 shows the contour of the model parameters for IC 443B. We did not perform the contour scan for HB 21N and HB 21S, since the data points are too few, compared to the number of model parameters.
IC 443B shows cm-3 somewhat higher than that of IC 443C, cm-3 (Shinn et al., 2011). This density difference may be related with the “W-shaped” H2 morphology mentioned above. of IC 443B is cm-2; here, means (H2; K), i.e., the column density of H2 gas whose temperature is higher than 1000 K. IC 443B shows larger than that of IC 443C, . This difference is natural because of IC 443C is mainly determined by the data of K, while it is not for of IC 443B. The obtained OPRs are . Interestingly, the OPR of IC 443B shows a smaller variation than the other parameters under the different adoptions of (cf. Table Ortho-to-Para Ratio Studies of Shocked H2 Gas in the Two Supernova Remnants IC 443 and HB 21). These OPRs are similar to those estimated from the levels ()=(0,11-13) and (1,1-3) assuming a single : and . The contour (Figure 7) shows that there is a weak anti-correlation between and , but no correlation between and the OPR. Figure 7 definitely shows the non-equilibrium OPR even in 95% confidence level.
HB 21N and HB 21S show of cm-2 and cm-2, respectively. This is about an order of magnitude smaller than that of IC 443C, which explains the consistent difference in the line intensities (Figure 2, Shinn et al., 2011). HB 21N and HB 21S show values of 2.6 and 3.3, smaller than IC 443B; this difference is hardly meaningful because the number of HB 21 data points is just half of IC 443B. The OPRs are 1.8 and 1.6 for HB 21N and HB 21S, respectively. These values are similar to those estimated from the levels ()=(0,11-13) assuming a single : and .
3.2.1 Spectral Fitting to the Observed Spectrum
In order to investigate the OPR of shocked H2 gas in IC 443B using all possible observational constraints, we additionally performed spectral fitting to the observed AKARI-IRC spectrum of IC 443B. The model spectrum is made by convolving the modeled intensity with a Gaussian kernel whose full-width-at-half-maximum is 0.03 m. The extinction effect is included using (Shinn et al., 2011) and the extinction curve of “Milky Way, ” (Weingartner & Draine, 2001; Draine, 2003). We used a synthetic continuum that is made by median-smoothing the observed spectrum with a 0.29 m box kernel, and the continuum is fixed during the fitting. The calibration systematic error of 10 % (cf. section 2) is quadratically included in the error of spectrum. The wavelength shift is included as a free parameter, and found to be m for the best fit. The fitting results are shown in Figure 8. We fitted the spectrum fixing and as in the level population fitting (Fig. 6). The best fit model parameters and the contours are shown in Table Ortho-to-Para Ratio Studies of Shocked H2 Gas in the Two Supernova Remnants IC 443 and HB 21 and Figure 9.
The OPR is found to be , which is a little higher than the ones from the level population fitting (Table Ortho-to-Para Ratio Studies of Shocked H2 Gas in the Two Supernova Remnants IC 443 and HB 21). However, the OPR is still less than 3.0 with a 95% significance limit (Fig. 9). The index also increases a little, while and are almost the same. The difference between two kinds of fitting is likely induced by the constraints from the weak and blended H2 emission lines, which are ignored in the level population fitting (Fig. 6). Such contributions can be seen in Table Ortho-to-Para Ratio Studies of Shocked H2 Gas in the Two Supernova Remnants IC 443 and HB 21; for example, the three lines around 4.41 m, S(10), S(11), and O(8).
For the HB 21 data, we could not get the range of OPR, because there are only a few emission lines strong enough to constraint the model parameters. We estimate the OPRs of HB 21N and HB 21S with a single assumption using the 4.2, 4.4, 4.7 m emission lines in section 3.1. They are found to be . If the contribution of S(11) 4.42 m to the 4.4 m line feature and the contribution of O(8) 4.16 m to the 4.2 m line feature are respectively around 13% and 10% as in IC 443B (cf. Table Ortho-to-Para Ratio Studies of Shocked H2 Gas in the Two Supernova Remnants IC 443 and HB 21), then the OPRs increase to . However, this estimation is still tentative. More near-infrared H2 emission line data are required to assess the OPR of shocked H2 gas in HB 21.
4 Discussion
4.1 Origin of the Non-equilibrium Ortho-to-Para Ratio Obtained from K
We obtained the results suggesting shocked H2 gas of non-equilibrium OPRs in IC 443B (OPR), HB 21N and HB 21S (OPR, cf. section 3.2.1). First, we examine the possibility that this non-equilibrium OPR originates from dissociative J-shocks, based on the results of Shinn et al. (2011). They studied shocked H2 gas in IC 443 (IC 443C and IC 443G), and found that the levels we here study ( K) are likely excited by dissociative J-shocks. Dissociative J-shocks mainly excite those levels at the H2 reformation zone (cf. Flower et al., 2003) through two main excitation mechanisms: the H2 formation pumping and the collisions with ambient gas (Hollenbach & McKee, 1989). Therefore, the non-equilibrium OPR most likely originate from the H2 reformation zone, if dissociative J-shocks are responsible for the level excitation of 7000 K 20000 K.
When the levels of 7000 K 20000 K is dominantly populated, the temperature is a few hundred kelvin (Flower et al., 2003). This temperature is too low to render the ortho-para interconversion. For example, the number of para-to-ortho conversion is about 0.6 for the typical J-shock seen in Flower et al. (2003). We use the rate coefficient of exp() cm3 s-1 for H I (Schofield, 1967), cm-3, yr, and K. Therefore, the OPR upon reformation behind dissociative J-shocks would remain unchanged until the gas cools down as low as the preshock gas. This means that the non-equilibrium OPR should be acquired when H2 is reformed, if dissociative J-shocks are responsible.
H2 reforms on grain surfaces or through the gas phase reaction (van de Hulst 1948; McDowell 1961; Field et al. 1966, Shull & Beckwith 1982, and references therein). Within the H2 reformation zone of dissociative J-shocks, the grain surface reformation is dominant, because the gas phase reformation is inefficient when the ionization fraction of shocked gas is below 2% (Neufeld & Dalgarno, 1989). The OPR of reformed H2 was usually assumed to be the equilibrium OPR in dissociative J-shock models (Hollenbach & McKee, 1989; Flower et al., 2003), following the studies on the level population of newly formed H2 (Black & Dalgarno, 1976; Bieniek & Dalgarno, 1979; Bieniek, 1980; Black & van Dishoeck, 1987; Flower et al., 2003). Thus, we need to more scrutinize previous theoretical and experimental studies relevant to the OPR of newly formed H2.
As far as we are aware, there are two studies that performed a quantum calculation for the H2 formation upon grains and mentioned the OPR (Meijer et al., 2001; Morisset et al., 2005). Among them, the results of Morisset et al. (2005) do not exclude the possibility that the newly-formed H2 has an OPR (cf. section 3.2.1). Meijer et al. (2001) and Morisset et al. (2005) respectively studied the Eley-Rideal (ER) and Langmuir-Hinshelwood (LH) formation mechanisms111See Tielens (2005) for the ER and LH mechanisms., among which the LH mechanism is more relevant to the interstellar environments (Pirronello et al., 2000). The level population upon formation is biased within for the LH mechanism, while it is scattered over all the considered vibrational levels () for the ER mechanism. They both calculated the OPR, and it is fluctuating within over the collision energy of meV in the LH mechanism, while it is close to 3 over the initial translational energy of meV in the ER mechanism. We think that the OPR can be acquired through the LH formation mechanism, if the collision energy of H atoms on grain surfaces has an appropriate distribution. Note that the biased level population () of the LH mechanism is redistributed over all levels through collisions with ambient postshock gas (i.e. ortho-to-ortho and para-to-para transitions).
We found two experimental works that studied the OPR of newly-formed H2 on grains (Perry & Price, 2003; Creighan et al., 2006). However, their results cannot tell if the newly-formed H2 can have an OPR or not, because of the experimental contaminations. They measured the level population of newly-formed H2 on a graphite surface, called “highly oriented pyrolytic graphite,” at a base pressure of Torr ( cm-3 K) much higher than the typical pressure of interstellar clouds, cm-3 K (Bergin & Tafalla, 2007). The obtained population is close to the LTE. However, it was known that the measured H2 population had been contaminated by the undissociated H2 that originates from the H atom source (Islam et al., 2010).
From the above discussion, we show that the non-equilibrium OPRs of can originate from dissociative J-shocks. We here note that the dissociative J-shock interpretation is not incompatible with the observed line ratios between H2 and H I. We compare the intensities of Br 4.05 m to those of S(11) 4.18 m. Table Ortho-to-Para Ratio Studies of Shocked H2 Gas in the Two Supernova Remnants IC 443 and HB 21 shows the expected and observed intensity of Br. The expected Br intensity is calculated from the observed S(11) intensity (Shinn et al., 2011, Table Ortho-to-Para Ratio Studies of Shocked H2 Gas in the Two Supernova Remnants IC 443 and HB 21), employing the dissociative J-shock model of Hollenbach & McKee (1989). We ignore the effect of extinction, because the wavelengths of Br and S(11) are similar. The adopted shock model parameters are cm-3, km s-1. Note that the dissociative J-shocks are likely propagating into interclump media of cm-3, according to Shinn et al. (2011). As seen from Table Ortho-to-Para Ratio Studies of Shocked H2 Gas in the Two Supernova Remnants IC 443 and HB 21, the observed intensities better agree with the model expectations, when the shock velocity is slower. The intensities of S(11) are also compatible with the model values, considering the possibilities of the multiple shock surfaces, the shock surface viewed edge-on, the not-fully-covered shock surface because of unresolved substructures, etc.
Now we examine other possibilities than the dissociative J-shocks. The shocked H2 gas of non-equilibrium OPR can be made by C-shocks or partially-dissociative J-shocks (Timmermann, 1998; Wilgenbus et al., 2000). However, these shocks are incapable of emanating the ionic lines observed in the shocked gas. When Shinn et al. (2011) interpreted the level population of shocked H2 gas in IC 443C and IC 443G (0 25000 K), they concluded that a combination of C-shocks and dissociative J-shocks is needed. Under this interpretation, the dissociative J-shocks are mandatory to explain the observed ionic emission lines, like [Ne II] 12.8 m and [C II] 158 m. Such lines were also observed at IC 443B (Noriega-Crespo et al., 2009). In HB 21, no detection of such ionic lines has been reported. However, the level population shape of shocked H2 gas over 0 K 20000 K is similar to that of IC 443C and IC 443G (Fig. 5, Shinn et al., 2009, 2010, 2011)—the power-law thermal admixture model with two density components is required to reproduce the level population. As in IC 443, dissociative J-shocks may be needed to explain the level population of shocked H2 gas in HB 21. We thus think that the non-equilibrium OPR is unlikely to originate from either C-shocks or partially-dissociative J-shocks.
4.2 Ortho-to-Para Ratios of Shocked H2 Gas in IC 443 and HB 21
The OPR obtained from the levels of 7000 K 20000 K is probably in non-equilibrium for IC 443B (section 3.2.1), while it is in equilibrium for IC 443C and IC 443G (Shinn et al., 2011). If we accept the conclusion from section 4.1, these OPRs are determined by the collision energy distribution of H atoms on grain surfaces. Therefore, the resultant OPRs means that the collision energy distribution is similar each other at IC 443C and IC 443G, while it is different for IC 443B. It is uncertain how the collision energy distribution is determined. The property of grain surface and the environment where grains and H I gas are embedded may be included in the determining factors. We here note that IC 443B is located at the vertex of the “W-shaped” H2 feature, while IC 443C and IC 443G are not (cf. Fig. 1 of Shinn et al., 2011). This implies that the density at IC 443B may be higher than the others (cf. Shinn et al., 2011).
The OPRs of HB 21N and HB 21S are similar each other (Table Ortho-to-Para Ratio Studies of Shocked H2 Gas in the Two Supernova Remnants IC 443 and HB 21). This indicates the collision energy distribution is similar at both regions, if we accept the conclusion from section 4.1. The OPRs of HB 21 are lower than those of IC 443. HB 21 shows a lower H2 column density than IC 443 (Neufeld et al., 2007; Shinn et al., 2009, 2010, 2011). This implies a lower density for HB 21, if a similar extension of shocked H2 gas along the line of sight is assumed for IC 443 and HB 21.
If our inference for the preshock density of IC 443 and HB 21 is the case, the preshock density and the obtained OPR show neither a correlation nor an anti-correlation. They are anti-correlated for IC 443B, IC 443C, and IC 443G, while they are correlated for IC 443 and HB 21. This indicates that the obtained OPRs are not simply determined by the preshock density. More information on physical parameters is required to understand how the obtained OPRs are determined at high energy levels of 7000 K 20000 K.
5 Conclusions
We present the near-infrared ( m) spectral observations of shocked H2 gas in the two SNRs IC 443 and HB 21. The observed regions are IC 443B, HB 21N, and HB 21S. At the energy range 7000 K 20000 K, IC 443B shows an OPR of ( in 95% confidence limit), which suggests the existence of non-equilibrium OPR. HB 21N and HB 21S also show indications of non-equilibrium OPRs in the range of . These may be the first objects observed with non-equilibrium OPR at such a high range. The level populations are well described by the power-law thermal admixture model ( K) with a single OPR, where the infinitesimal column density is proportional to the inverse power of the temperature.
We conclude that the obtained non-equilibrium OPR probably originates from the H2 reformation through dissociative J-shocks, based on several arguments. Shinn et al. (2011) found that the H2 levels of K are likely excited by dissociative J-shocks, where H2 is dissociated and then reformed. Previous quantum calculations do not exclude the possibility that the reformed H2 has an OPR of , when formed with an appropriate collision energy of H atoms on grain surfaces. The observed line ratio between H2 S(11) and Br is also compatible with the dissociative J-shock interpretation.
According to our conclusion, the difference in the obtained OPRs is caused by the different collision energy of H atoms on grain surfaces. It is uncertain how the collision energy is determined, but the property of grain surface and the environment where grains and H I gas are embedded may be included in the determining factors. We check if any simple relation is held between the obtained OPR and preshock density for IC 443 and HB 21, but it turns out unlikely.
More observational studies are required to confirm the non-equilibrium OPR; to validate our explanations for the obtained non-equilibrium OPR; and to grasp how a non-equilibrium OPR of shocked H2 gas is determined at the energy levels of 7000 K 20000 K. Our study suggests that dissociative J-shocks can make shocked H2 gas with a non-equilibrium OPR.
References
- Allen et al. (2008) Allen, M. G., Groves, B. A., Dopita, M. A., Sutherland, R. S., & Kewley, L. J. 2008, ApJS, 178, 20
- Bergin & Tafalla (2007) Bergin, E. A., & Tafalla, M. 2007, ARA&A, 45, 339
- Bieniek (1980) Bieniek, R. J. 1980, JPhB, 13, 4405
- Bieniek & Dalgarno (1979) Bieniek, R. J., & Dalgarno, A. 1979, ApJ, 228, 635
- Black & Dalgarno (1976) Black, J. H., & Dalgarno, A. 1976, ApJ, 203, 132
- Black & van Dishoeck (1987) Black, J. H., & van Dishoeck, E. F. 1987, ApJ, 322, 412
- Burton et al. (1992) Burton, M. G., Hollenbach, D. J., & Tielens, A. G. G. 1992, ApJ, 399, 563
- Caratti o Garatti et al. (2008) Caratti o Garatti, A., Froebrich, D., Eislöffel, J., Giannini, T., & Nisini, B. 2008, A&A, 485, 137
- Caratti o Garatti et al. (2006) Caratti o Garatti, A., Giannini, T., Nisini, B., & Lorenzetti, D. 2006, A&A, 449, 1077
- Chang & Martin (1991) Chang, C. A., & Martin, P. G. 1991, ApJ, 378, 202
- Creighan et al. (2006) Creighan, S. C., Perry, J. S. A., & Price, S. D. 2006, JChPh, 124, 114701
- Draine (2003) Draine, B. T. 2003, ARA&A, 41, 241
- Draine & McKee (1993) Draine, B. T., & McKee, C. F. 1993, ARA&A, 31, 373
- Ferland et al. (1998) Ferland, G. J., Korista, K. T., Verner, D. A., Ferguson, J. W., Kingdon, J. B., & Verner, E. M. 1998, PASP, 110, 761
- Field et al. (1966) Field, G. B., Somerville, W. B., & Dressler, K. 1966, ARA&A, 4, 207
- Flower et al. (2003) Flower, D. R., Le Bourlot, J., Pineau des Forêts, G., & Cabrit, S. 2003, MNRAS, 341, 70
- Giannini et al. (2006) Giannini, T., McCoey, C., Nisini, B., Cabrit, S., Caratti o Garatti, A., Calzoletti, L., & Flower, D. R. 2006, A&A, 459, 821
- Gredel (1994) Gredel, R. 1994, A&A, 292, 580
- Habart et al. (2005) Habart, E., Walmsley, M., Verstraete, L., Cazaux, S., Maiolino, R., Cox, P., Boulanger, F., & Pineau des Forêts, G. 2005, SSRv, 119, 71
- Hewitt et al. (2009) Hewitt, J. W., Rho, J., Andersen, M., & Reach, W. T. 2009, ApJ, 694, 1266
- Hollenbach & McKee (1989) Hollenbach, D., & McKee, C. F. 1989, ApJ, 342, 306
- Islam et al. (2010) Islam, F., Cecchi-Pestellini, C., Viti, S., & Casu, S. 2010, ApJ, 725, 1111
- Joye & Mandel (2003) Joye, W. A., & Mandel, E. 2003, in Astronomical Society of the Pacific Conference Series, Vol. 295, Astronomical Data Analysis Software and Systems XII, ed. H. E. Payne, R. I. Jedrzejewski, & R. N. Hook, 489
- Kaufman & Neufeld (1996) Kaufman, M. J., & Neufeld, D. A. 1996, ApJ, 456, 611
- Le Bourlot et al. (1999) Le Bourlot, J., Pineau des Forêts, G., & Flower, D. R. 1999, MNRAS, 305, 802
- Lee et al. (2001) Lee, H.-G., Rho, J., Koo, B.-C., Petre, R., & Decourchelle, A. 2001, in Bulletin of the American Astronomical Society, Vol. 33, Bulletin of the American Astronomical Society, 839
- Lefloch et al. (2003) Lefloch, B., Cernicharo, J., Cabrit, S., Noriega-Crespo, A., Moro-Martín, A., & Cesarsky, D. 2003, ApJ, 590, L41
- Maret et al. (2009) Maret, S., et al. 2009, ApJ, 698, 1244
- McDowell (1961) McDowell, M. R. C. 1961, Obs, 81, 240
- Meijer et al. (2001) Meijer, A. J. H. M., Farebrother, A. J., Clary, D. C., & Fisher, A. J. 2001, JPCA, 105, 2173
- Morisset et al. (2005) Morisset, S., Aguillon, F., Sizun, M., & Sidis, V. 2005, JChPh, 122, 194702
- Murakami et al. (2007) Murakami, H., et al. 2007, PASJ, 59, S369
- Neufeld & Dalgarno (1989) Neufeld, D. A., & Dalgarno, A. 1989, ApJ, 340, 869
- Neufeld et al. (2007) Neufeld, D. A., Hollenbach, D. J., Kaufman, M. J., Snell, R. L., Melnick, G. J., Bergin, E. A., & Sonnentrucker, P. 2007, ApJ, 664, 890
- Neufeld et al. (1998) Neufeld, D. A., Melnick, G. J., & Harwit, M. 1998, ApJ, 506, L75
- Neufeld et al. (2006) Neufeld, D. A., et al. 2006, ApJ, 649, 816
- Neufeld et al. (2009) —. 2009, ApJ, 706, 170
- Noriega-Crespo et al. (2009) Noriega-Crespo, A., Hines, D. C., Gordon, K., Marleau, F. R., Rieke, G. H., Rho, J., & Latter, W. B. 2009, in The Evolving ISM in the Milky Way and Nearby Galaxies, ed. K. Sheth, A. Noriega-Crespo, J. Ingalls, & R. Paladini (http://ssc.spitzer.caltech.edu/mtgs/ismevol/), E46
- Omont (2007) Omont, A. 2007, RPPh, 70, 1099
- Onaka et al. (2009) Onaka, T., Lorente, R., Ita, Y., Ohyama, Y., Tanabé, T., & Pearson, C. 2009, AKARI IRC Data User Manual for Post-Helium (Phase 3) Mission Version 1.1
- Onaka et al. (2007) Onaka, T., et al. 2007, PASJ, 59, S401
- Perry & Price (2003) Perry, J. S. A., & Price, S. D. 2003, Ap&SS, 285, 769
- Pirronello et al. (2000) Pirronello, V., Biham, O., Manicó, G., Roser, J. E., & Vidali, G. 2000, in Molecular Hydrogen in Space, ed. F. Combes & G. P. D. Forets, 71
- Quanz et al. (2007) Quanz, S. P., Henning, T., Bouwman, J., Linz, H., & Lahuis, F. 2007, ApJ, 658, 487
- Rho et al. (2001) Rho, J., Jarrett, T. H., Cutri, R. M., & Reach, W. T. 2001, ApJ, 547, 885
- Rodríguez-Fernández et al. (2000) Rodríguez-Fernández, N. J., Martín-Pintado, J., de Vicente, P., Fuente, A., Hüttemeister, S., Wilson, T. L., & Kunze, D. 2000, A&A, 356, 695
- Rosenthal et al. (2000) Rosenthal, D., Bertoldi, F., & Drapatz, S. 2000, A&A, 356, 705
- Roussel et al. (2007) Roussel, H., et al. 2007, ApJ, 669, 959
- Schofield (1967) Schofield, K. 1967, P&SS, 15, 643
- Shinn et al. (2009) Shinn, J.-H., Koo, B.-C., Burton, M. G., Lee, H.-G., & Moon, D.-S. 2009, ApJ, 693, 1883
- Shinn et al. (2010) —. 2010, AdSpR, 45, 445
- Shinn et al. (2011) Shinn, J.-H., Koo, B.-C., Seon, K.-I., & Lee, H.-G. 2011, ApJ, 732, 124
- Shull & Beckwith (1982) Shull, J. M., & Beckwith, S. 1982, ARA&A, 20, 163
- Skrutskie et al. (2006) Skrutskie, M. F., et al. 2006, AJ, 131, 1163
- Smith et al. (1997) Smith, M. D., Davis, C. J., & Lioure, A. 1997, A&A, 327, 1206
- Sternberg & Neufeld (1999) Sternberg, A., & Neufeld, D. A. 1999, ApJ, 516, 371
- Tielens (2005) Tielens, A. G. G. M. 2005, The Physics and Chemistry of the Interstellar Medium (Cambridge University Press)
- Timmermann (1998) Timmermann, R. 1998, ApJ, 498, 246
- Timmermann et al. (1996) Timmermann, R., Bertoldi, F., Wright, C. M., Drapatz, S., Draine, B. T., Haser, L., & Sternberg, A. 1996, A&A, 315, L281
- van de Hulst (1948) van de Hulst, H. C. 1948, HarMo, 7, 73
- Wang et al. (2010) Wang, W.-H., Cowie, L. L., Barger, A. J., Keenan, R. C., & Ting, H.-C. 2010, ApJS, 187, 251
- Weingartner & Draine (2001) Weingartner, J. C., & Draine, B. T. 2001, ApJ, 548, 296
- Wilgenbus et al. (2000) Wilgenbus, D., Cabrit, S., Pineau des Forêts, G., & Flower, D. R. 2000, A&A, 356, 1010
- Xu et al. (2011) Xu, J., Wang, J., & Miller, M. 2011, ApJ, 727, 81


| Region | Pointing Position | Observation ID | AOTaaAstronomical Observation Template. It is a pre-defined observation sequence. See the IRC Data User Manual for Post-Helium Mission. (Onaka et al., 2009). |
|---|---|---|---|
| (RA, Dec; J2000) | |||
| HB 21N | (20:47:26.891,+51:15:04.80) | 1420797.[1-4], 1420798.1 | IRCZ4 |
| HB 21N BG | (20:47:32.237,+51:16:34.86) | 1420799.[1-2] | IRCZ4 |
| HB 21S | (20:46:10.398,+49:58:15.20) | 1420800.[1-4], 1420801.1 | IRCZ4 |
| HB 21S BG | (20:46:04.220,+49:58:13.61) | 1420802.[1-2] | IRCZ4 |
Note. — The observation summary for the IC 443B data is in Shinn et al. (2011).
| Transition | Wavelength | Observed Intensity | |
|---|---|---|---|
| (m) | ( erg s-1 cm-2 sr-1) | ||
| HB 21N | HB 21S | ||
| 1-0 O(3) | 2.80 | 9.12.0 | 11.62.0 |
| 2-1 O(3) | 2.97 | 4.1 | |
| 1-0 O(4) | 3.00 | 5.7 | |
| 1-0 O(5) | 3.23 | 6.2 | 8.31.7 |
| 1-0 O(7) | 3.81 | 3.8 | |
| 0-0 S(13) | 3.85 | 4.9 | |
| 0-0 S(11) | 4.18 | 8.41.4 | 9.01.3 |
| 0-0 S(10) | 4.41 | 7.51.4 | 8.71.3 |
| 0-0 S(9) | 4.69 | 19.72.4 | 21.62.5 |
Note. — For those lines whose significance is lower than 3.0, the intensities are expressed with 90% upper confidence limits. The error includes both statistical and systematic components. See text for detail.
Note. — The extinctions were corrected, using =(H I)+2(H2) cm-2 (Lee et al., 2001) and the extinction curve of “Milky Way, ” (Weingartner & Draine, 2001; Draine, 2003).
IC443B&1.4 (=5.5/4.0) HB21N HB21S
Note. — The confidence limits are given with a 68% significance (cf. Fig. 7). means (H2; K). See section 3.2 for the detailed description about the parameters.
IC443B&1.89 (=401.4/212.0)
Note. — The confidence limits are given with a 68% significance (cf. Fig. 9). means (H2; K). See section 3.2 for the detailed description about the parameters.
Note. — The best fit models are from the spectral fitting (Figure 8) and the extinction effect is applied.