Photometric and spectroscopic observations of the F3+M3 eclipsing binary T-Lyr0-08070
Abstract
The multi-color photometric and spectroscopic observations of the newly discovered eclipsing binary T-Lyr0-08070 were obtained. The resultant light and radial velocities were analysed and the absolute parameters of the components were determined. The system is composed of an F3 and an M3 main-sequence stars. Masses and radii were estimated to be 1.370.23 M⊙ and 1.600.09 R⊙ for the primary and 0.320.04 M⊙ and 0.860.06R⊙ for the secondary star. The less massive secondary component has a radius at least two times larger with respect to its mass. Using the BVJHK magnitudes of the system we estimated an interstellar reddening of 0.22 mag and a distance to the system as 47936 pc.
keywords:
binaries; eclipsing - stars: fundamental parameters; individual — method: spectroscopy1 Introduction
Transit events for the T-Lyr0-08070 (Vmax=12.15 mag.) were detected during regular operations of the Trans-Atlantic Exoplanet Survey network (TrES). Fernandez et al. (2009) classified this star as a long-period single-lined eclipsing binary with an F-star primary and an unseen M-dwarf secondary. They obtained follow-up spectroscopic observations using 1.5 m Wyeth Reflector at the Oak Ridge Observatory and 1.5 m Tilinghast Reflector at Whipple Observatory. In order to reveal fundamental characteristics of the T-Lyr0-08070 they combined photometric data from TrES survey and KeplerCam photometry with those single-order echelle spectra in a wavelength window of 45 Å centered at 5187 Å. They obtained the radial velocities only for the F-star. Since their spectra cover a narrow wavelength interval, there is a clear dependence between the effective temperature and the metal abundance of the star. For this reason they have, modeled the spectra for metallicity index of -1.0, -0.5, 0.0 and +0.5 to obtain effective temperature, projected rotational velocity and surface gravity of the primary star. Fernandez et al. (2009) modeled the KeplerCam primary transit light curve employing the method of Mandel & Agol (2002), which was an analytical light curve analysis developed for planetary transit searches. Assuming orbit-rotation synchronization and adopting Fe/H=-0.5, the mass and radius of the primary star were derived as 0.95 and 1.36 . Under the same assumptions, they derived the mass and radius of the secondary star as 0.345 and 0.360 .
We planned new spectroscopic and photometric observations of the T-Lyr0-08070 to obtain the masses, radii and effective temperatures of the primary and secondary stars. The photometric light curves were obtained in the BVRI passbands and analysis are presented. The radial velocities for both components are also obtained and analysed.
2 Data acquisition
2.1 Spectroscopy
Optical spectroscopic observations of the T-Lyr0-08070 were obtained with the Turkish Faint Object Spectrograph Camera (TFOSC)111http://tug.tug.tubitak.gov.tr/rtt150_tfosc.php attached to the 1.5 m telescope on 8 nights (July, 2010) under good seeing conditions. Further details on the telescope and the spectrograph can be found at http://www.tug.tubitak.gov.tr. The wavelength coverage of each spectrum was 4000-9000 Å in 12 orders, with a resolving power of / 7 000 at 6563 Å and an average signal-to-noise ratio (S/N) was 120. The exposure times were between 10 and 60 minutes during observations. We also obtained a high S/N spectrum of the M dwarf GJ 740 (M0 V) and GJ 623 (M1.5 V) for use as templates in derivation of the radial velocities (Nidever et al., 2002).
The electronic bias was removed from each image and we used the ’crreject’ option for cosmic ray removal. Thus, the resulting spectra were largely cleaned from the cosmic rays. The echelle spectra were extracted and wavelength calibrated by using Fe-Ar lamp source with help of the IRAF echelle package (Tonry & Davis, 1979).
The stability of the instrument was checked by cross correlating the spectra of the standard star against each other using the fxcor task in IRAF. The standard deviation of the differences between the velocities measured using fxcor and the velocities in Nidever et al. (2002) was about 1.1 km s-1.
2.1.1 Spectral classification
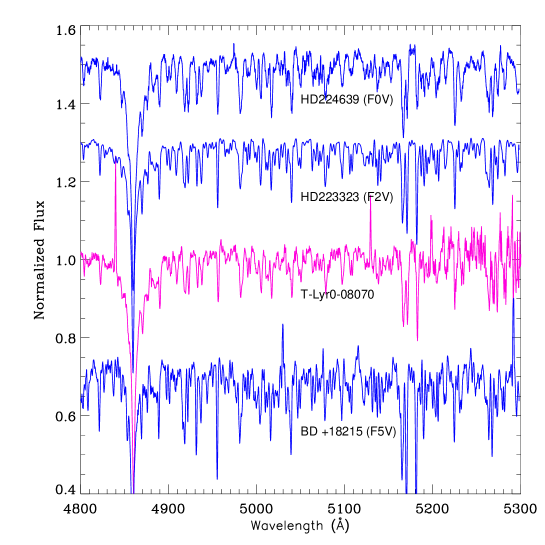
We have used our spectra to reveal the spectral type of the primary component of T-Lyr0-08070. For this purpose we have degraded the spectral resolution from 7 000 to 3 000, by convolving them with a Gaussian kernel of the appropriate width, and we have measured the equivalent widths () of photospheric absorption lines for the spectral classification. We have followed the procedures of Hernández et al. (2004), choosing helium lines in the blue-wavelength region, where the contribution of the secondary component to the observed spectrum is almost negligible. From several spectra we measured Å and Å. From the calibration relations –Spectral-type of Hernández et al. (2004), we have derived a spectral type of F3 for the primary star. In Fig.1 we compare the spectrum of T-Lyr0-08070 with the spectra of standard stars HD 224639 (F0V), HD 223623 (F2V) and HD 18215 (F5V). The spectra of standard stars are taken from the ELODIE archive222http://atlas.obs-hp.fr/elodie/ database. This comparison confirms the spectral-type of the more massive star derived from the EW measurements.
2.1.2 Rotational velocity
The width of the cross-correlation profile is a good tool for the measurement of (see, e.g., Queloz et al. 1998). The rotational velocities () of the two components were obtained by measuring the FWHM of the CCF peaks in nine high-S/N spectra of T-Lyr0-08070 acquired close to the quadratures, where the spectral lines have the largest Doppler-shifts. In order to construct a calibration curve FWHM–, we have used an average spectrum of the HD 128429, acquired with the same instrumentation. Since the rotational velocity of HD 128429 is very low but not zero (F5 V, 14 km s-1, e.g., Royer et al. (2002)), it could be considered as a useful template for F-type stars rotating faster than 10 km s-1. The spectrum of HD 128429 was synthetically broadened by convolution with rotational profiles of increasing in steps of 5 km s-1 and the cross-correlation with the original one was performed at each step. The FWHM of the CCF peak was measured and the FWHM- calibration was established. The values of the components of T-Lyr0-08070 were derived from the FWHM of their CCF peaks and the aforementioned calibration relations, for a few wavelength regions for the best spectra. This gave values of 581 km s-1 for the primary and 259 km s-1 for the secondary star. The rotational velocity of the primary star is in a good agreement with that estimated by Hernández et al. (2004).
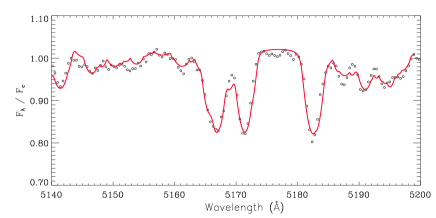
For construction of the synthetic spectrum of the system the spectra of the standard stars ( Psc and GJ 740), obtained with the same instrumentation, have been rotationally broadened by convolution with the appropriate rotational profile and then co-added, properly weighted by using physical parameters (, , , , ) of the components as input parameters and, then, Doppler-shifted according to the radial velocities of the components. and were determined in §2.1.1 and §2.1.2. and were obtained from the combination of the light and radial velocity curves analyses (see §4). In Fig. 2 we compare the observed spectrum of T-Lyr0-08070 around the Mg I triplet with the synthetic one for a system consisting of F3V+M3V type stars.
2.2 Photometric observations
In order to provide high-quality light curves of the system in different passbands, we used SI 1100 CCD Camera333http://www.specinst.com/ mounted on the 1 m telescope at the TÜBİTAK National Observatory, Turkey. SI 1100 Camera utilizes a Cryogenic cooler 4k4k, Fairchild 486 CCD that gives a 21 field and a pixel size of 0′′.72 when the binning is 22. Differential aperture photometry was performed to obtain the light curves. The observed magnitudes of T-Lyr0-08070 in the B and V passbands were compared with those for the comparison and check stars. The coordinates and magnitudes of the stars observed are given in Table 1. The B and V magnitudes of the variable are obtained in this study. The typical standard deviations of the differential magnitudes are about 0.005 mag.

| Star | B (mag) | V (mag) | J (mag) | H (mag) | K (mag) | ||
|---|---|---|---|---|---|---|---|
| T-Lyr0-08070 | 19h 19m 04s | 38∘ 40′ 57′′ | 12.747 | 12.150 | 11.507 | 11.321 | 11.261 |
| GSC 3121-01011 | 19h 19m 50s | 38∘ 40′ 57′′ | 10.81 | 9.92 | 8.173 | 7.694 | 7.633 |
| GSC 3121-00379 | 19h 19m 33 s | 38∘ 40′ 57′′ | 11.7 | 11.5 | 10.703 | 10.569 | 10.544 |
2.3 Effective temperature of the primary star
We find an observed color of B-V=0.600.02 mag for the binary system T-Lyr0-08070 at out-of-eclipse which should be reddened if the spectral type F3 is considered. The observed infrared colors of J-H=0.1860.039 and H-K=0.0600.035 given in the 2MASS catalog (Cutri et al., 2003) correspond to a spectral type of F32 is in a good agreement with that we derived by spectroscopy.
The effective temperature deduced from the calibrations of spectral type-effective temperature or intrinsic B-V color-effective temperature given by Drilling & Landolt (2000), de Jager & Nieuwenhuijzen (1987), Alonso et al. (1996), Flower (1996) and Popper (1980) is about 6 750 K. However we estimated a temperature of 6 670170 K for the primary star from the infrared colors - effective temperature calibrations of Tokunaga (2000). Temperature uncertainty of the primary component results from considerations of spectral type uncertainties, and calibration differences. As a weighted mean we adopted 6 700150 K for the effective temperature of the primary star.
3 Period determination
We obtained five times of minimum light for the system during photometric observations. These times of minima are given in Table 2 as averaged for the filters used. The times of minimum light obtained by Fernandez et al. (2009) were also included in the list. A linear least-squares fit to the data yields the following ephemeris
where the bracketed quantity is the uncertainty in the last digit(s) of the preceding number. All uncertainties quoted in this work are standard errors. The residuals of the fit are plotted in Fig. 3 and show no indication of any form of period change in about five years.
References: (1) Fernandez et al. (2009); (2) This work.
| Time of minimum | Cycle number | Reference | |
|---|---|---|---|
| (HJD 2 500 000+) | |||
| 3996.63260.0001 | -1221.0 | -0.0010 | 1 |
| 3996.63330.0001 | -1221.0 | -0.0004 | 1 |
| 3996.63400.0001 | -1221.0 | 0.0003 | 1 |
| 3996.63460.0001 | -1221.0 | 0.0009 | 1 |
| 5443.32310.0004 | 0.0 | 0.0003 | 2 |
| 5444.50830.0002 | 1.0 | 0.0002 | 2 |
| 5455.17080.0004 | 10.0 | -0.0008 | 2 |
| 5456.35500.0003 | 11.0 | -0.0014 | 2 |
| 5716.42860.0003 | 230.5 | -0.0002 | 2 |
4 Analysis
4.1 Radial velocity curve
To derive the radial velocities for the components of binary system, the 12 TFOSC spectra of the eclipsing binary were cross-correlated against the spectrum of GJ 740, a single-lined M0V star, on an order-by-order basis using the fxcor package in IRAF. The majority of the spectra showed two distinct cross-correlation peaks in the quadrature, one for each component of the binary. Thus, both peaks were fit independently in the quadrature with a profile to measure the velocity and errors of the individual components. If the two peaks appear blended, a double Gaussian was applied to the combined profile using de-blend function in the task. For each of the 12 observations we determined a weighted-average radial velocity for each star from all orders without significant contamination by telluric absorption features. Here we used as weights the inverse of the variance of the radial velocity measurements in each order, as reported by fxcor.
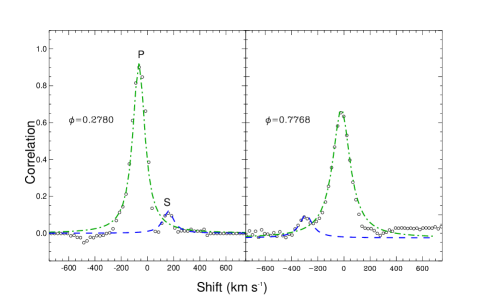
We adopted a fit algorithm to resolve cross-correlation peaks near the first and second quadratures when spectral lines are visible separately. Fig. 4 shows examples of cros-correlations obtained by using the largest FWHM at nearly first and second quadratures. The stronger peaks in each CCF correspond to the more luminous component which has a larger weight into the observed spectrum.
| HJD 2400000+ | Phase | Star 1 | Star 2 | ||
|---|---|---|---|---|---|
| 55390.3850 | 0.3204 | -70.5 | -3.5 | – | – |
| 55391.4725 | 0.2382 | -72.2 | -3.6 | – | – |
| 55392.3905 | 0.0130 | -34.3 | 11.1 | – | – |
| 55392.5751 | 0.1688 | -73.0 | -3.7 | – | – |
| 55393.2954 | 0.7768 | 13.8 | 0.7 | -210.7 | 9.9 |
| 55393.3438 | 0.8176 | 9.6 | 0.5 | -199.4 | 11.1 |
| 55394.5068 | 0.7992 | 12.9 | 0.6 | -207.9 | 12.8 |
| 55396.3351 | 0.3422 | -66.3 | -3.3 | – | – |
| 55396.4813 | 0.4656 | -40.2 | 7.4 | – | – |
| 55397.4438 | 0.2780 | -73.9 | -3.7 | 151.5 | 10.4 |
| 55398.5238 | 0.1894 | -74.7 | 6.2 | – | – |
| 55398.5700 | 0.2285 | -76.4 | -3.8 | 149.9 | 10.4 |
The heliocentric RVs for the primary (Vp) and the secondary (Vs) components are listed in Table 3 and plotted in Fig. 5 against the orbital phase. The RVs listed in Table 3 are the weighted averages of the values obtained from the cross-correlation of orders #4, #5, #6 and #7 of the target spectra with the corresponding order of the standard star spectrum. The weight has been given to each measurement. The standard errors of the weighted means have been calculated on the basis of the errors () in the RV values for each order according to the usual formula (e.g.Topping (1972)). The values are computed by fxcor according to the fitted peak height, as described by Tonry & Davis (1979).
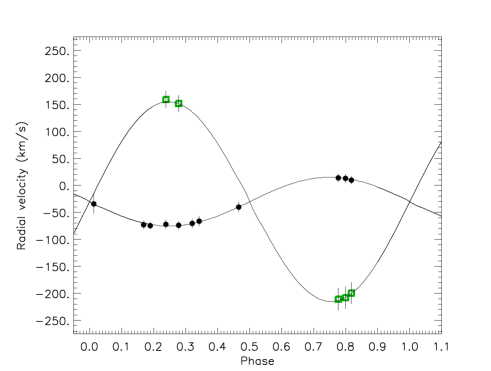
First we analysed the radial velocities for the initial orbital parameters. We used the orbital period held fixed and computed the eccentricity of the orbit, systemic velocity and semi-amplitudes of the RVs. The results of the analysis are as follow: = -302 km s-1, =453 and =19012 km s-1with a circular orbit. Using these values we estimate the projected orbital semi-major axis and mass ratio as: sin=5.500.06 and =0.2370.008.
4.2 Light curve modeling
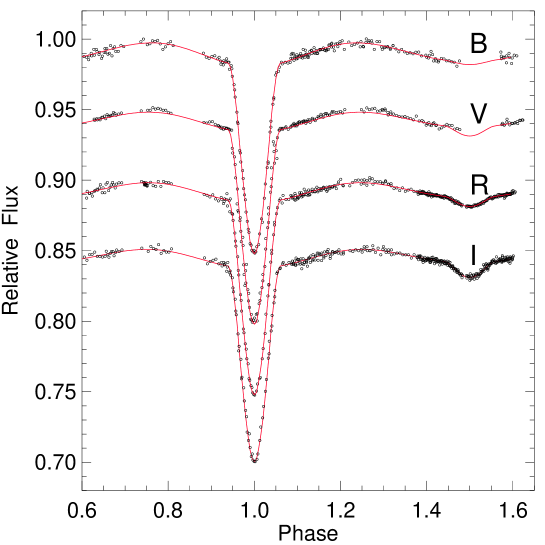
We used the most recent version of the eclipsing binary light curve modeling algorithm of Wilson & Devinney (1971) (with updates), as implemented in the phoebe code of Prša & Zwitter (2005). The code needs some input parameters, which depend upon the physical properties of the component stars. In the light curve solution we fixed some parameters whose values can be estimated from global stellar properties, such as effective temperature of the hotter component and mass-ratio of the system. The effective temperature of the primary star has already been derived from photometry and spectroscopy as 6 700 K and the mass-ratio as 0.237. A preliminary estimate for the effective temperature of the cooler component is made comparing the depths of the eclipses and mass-ratio. We adopted the linear limb-darkening coefficients from Van Hamme (1993) for the primary and secondary components, and the bolometric albedos from Lucy (1967), for each passband. The gravity brightening coefficients are taken as 0.32 for both components. The rotational velocities of the components are assumed to be synchronous with the orbital one. The adjustable parameters in the light curves fitting were the orbital inclination, the surface potentials, effective temperature of the secondary and the luminosity of the primary. Our final results of simultaneous solution are listed in Table 4 and the computed light curves (continuous line) are compared with the observations in Fig. 6. The fractional radii () given in Table 4 are the mean values. The proximity effects at out-off-eclipses are clearly seen. The uncertainities assigned to the adjusted parameters are the internal errors provided directly by the Wilson-Devinney code.
| Parameters | Adopted |
|---|---|
| 78.540.51 | |
| T (K) | 6 700[Fix] |
| T (K) | 3 200180 |
| 3.6500.012 | |
| 3.3140.089 | |
| 0.2850.004 | |
| 0.1540.009 | |
| (B) | 0.9980.008 |
| (V) | 0.9880.008 |
| (R) | 0.9100.008 |
| (I) | 0.8880.008 |
| 0.006 |
5 Absolute dimensions and distance to the system
The semi-amplitude of the radial velocities are obtained from the radial velocity analysis. The inclination of the orbit and the fractional radii of the components are determined from the light curve solutions. Therefore, we can compute the absolute parameters of the component stars. We present the fundamental physical parameters for the system T-Lyr0-08070 with their uncertainties in Table 5. The absolute parameters we obtained in this study are significantly different from those obtained by Fernandez et al. (2009), because they derived the parameters for only the transit light curve and the rotational velocity of the primary star. In particular, the mass and radius of the secondary star are very different when compared with those of Fernandez et al. (2009). They estimated a mass for the less massive star as 0.22, 0.25, 0.29 and 0.32 , and radius as 0.25, 0.27, 0.29 and 0.31 from the stellar isochrones for the values of Fe/H=-1.0, -0.5, 0.0 and +0.5, respectively. Using orbit-rotation synchronization they find mass and radius for the secondary star as 0.240 and 0.265 . Our radial velocity and light curve analyses yield a mass of 0.32 and a radius of 0.86 in solar units.
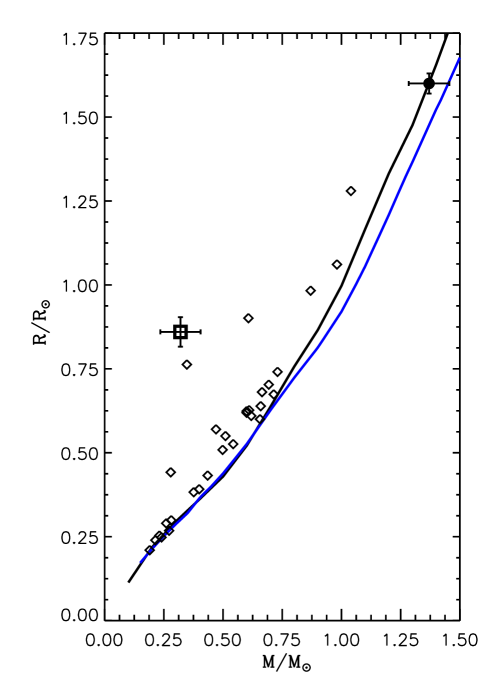
In Fig. 7 we compare locations of the low-mass stars in the mass-radius diagram. The radius of the M3 dwarf is at least two times larger than that predicted from the stellar models. The less massive components of the close binary systems having a mass smaller than the sun are generally oversized with respect to the theoretical models as indicated recently by Cakirli et al. (2010). However, their effective temperatures are generally lower than those of single main sequence stars with similar mass. Larger radii and lower effective temperatures are attributed to the solar-like activities (see Morales, Ribas & Jordi (2008)). Large spots on the stars prevent energy output, therefore, the star expands. While the radius increases the surface temperature decreases in active stars in close binary systems.
The BVJHK magnitudes of the binary and the comparison stars given in Table 1 allow us estimation of the color excess. Assuming the spectral type of the primary star as F3 we estimated the interstellar reddening as E(B-V)=0.22 mag using the tables given by Drilling & Landolt (2000). Using the radius and effective temperature of the primary star we compute its luminosity as 4.56 . Then taking this value and bolometric absolute magnitude for the sun as 4.74 one may compute its absolute bolometric magnitude as 3.08 ”mag”. The bolometric correction of -0.12 ”mag” taken from Drilling & Landolt (2000) we find an absolute visual magnitude of 3.21 ”mag” for the more massive star. The apparent visual magnitude of 12.162 extracting the light contribution of the secondary star to the total light, the absolute visual magnitude for the primary star and interstellar extinction of AV=0.68 ”mag” yield a distance to the system as 47936 pc. However, JHK magnitudes lead to a distance of about 630 pc with larger standard deviation. This difference may be originated from the bolometric corrections taken from different tables (Girardi et al. (2002) and Kervella et al. (2004)).
| Parameter | Primary | Secondary |
|---|---|---|
| Spectral Type | F32 | M31 |
| (R⊙) | 5.610.06 | |
| (km s-1) | -303 | |
| (∘) | 78.50.5 | |
| 0.2370.008 | ||
| Mass (M⊙) | 1.370.23 | 0.320.04 |
| Radius (R⊙) | 1.600.09 | 0.860.06 |
| () | 4.170.03 | 4.080.05 |
| (K) | 6700150 | 3170150 |
| (km s-1) | 581 | 259 |
| (km s-1) | 692 | 272 |
| 0.670.06 | -1.170.10 | |
| (pc) | 47936 | |
Acknowledgments
We thank TÜBİTAK National Observatory (TUG) for a partial support in using RTT150 and T100 telescopes with project numbers 10ARTT150-483-0, 11ARTT150-123-0 and 10CT100-101. We also thank responsible for the Bakırlıtepe observing station for their warm hospitality. This research has been made use of the ADS and CDS databases, operated at the CDS, Strasbourg, France and TÜBİTAK ULAKBİM Süreli Yayınlar Kataloǧu. The authors are grateful to the anonymous referee for his/her valuable comments.
References
- Alonso et al. (1996) Alonso, A., Arribas S., and Martinez-Roger, C., 1996, AA, 313, 873
- Cakirli et al. (2010) Cakirli O., Ibanoglu C., Dervisoglu A., 2010, RevMxAA, 46, 363
- Cutri et al. (2003) Cutri R. M., et al., 2003, The IRSA 2MASS All-Sky Point Source Catalog, NASA/IPAC Infrared Science Archive. http://irsa.ipac.caltech.edu/applications/Gator/
- Drilling & Landolt (2000) Drilling J. S., Landolt A. U., 2000, Allen’s astrophysical quantities, 4th ed. Edited by Arthur N. Cox. ISBN: 0-387-98746-0. Publisher: New York: AIP Press; Springer, 2000, p.381
- Fernandez et al. (2009) Fernandez J. M., Latham D. W, Tores G., Everett M. E., Mandushev G., Charbonneau D., O’Donovan F. T, Alonso R., Esquerdo G. A., Hergenrother C. W, and Stefanik P. P., 2009, ApJ, 701, 764
- Flower (1996) Flower P. J., 1996, ApJ, 469, 355
- Girardi et al. (2002) Girardi L., Bertelli G., Bressan A., Chiosi C., Groenewegen M. A. T., Marigo P., Salasnich B., Weiss, A., 2002, A&A, 391, 195
- Hernández et al. (2004) Hernández J., Calvet N., Briceño C., Hartmann L., Berlind P., 2004, AJ, 127, 1682
- Kervella et al. (2004) Kervella P., Bersier D., Mourard D., Nardetto N., Fouqué P., Coudé du Foresto V., 2004, A&A, 428, 587
- Lucy (1967) Lucy L. B., 1967, Z. Astrophys., 65, 89
- de Jager & Nieuwenhuijzen (1987) de Jager C., Nieuwenhuijzen H., 1987, AA, 177, 217
- Mandel & Agol (2002) Mandel, K., & Agol E., 2002, ApJ 580, L171
- Lopez-Morales et al. (2008) Morales J. C., Ribas I., Jordi C., 2008, A&A, 478, 507
- Nidever et al. (2002) Nidever D. L., Marcy G. W., Butler R. P., Fischer D. A., and Vogt S. S., 2002, ApJS, 141, 503
- Prša & Zwitter (2005) Prša A., Zwitter T. 2005, ApJ, 628, 426P
- Popper (1980) Popper D. M., 1980, Ann. Rev. AA, 18, 115
- Queloz et al. (1998) Queloz D., Allain, S., Mermilliod, J.-C., Bouvier, J., & Mayor, M., 1998, A&A, 335, 183
- Royer et al. (2002) Royer, F., Gerbaldi, M., Faraggiana, R., & Gomez, A. E. 2002, A&A, 381, 105
- Tokunaga (2000) Tokunaga A. T., 2000, ”Allen’s astrophysical quantities”, Fouth Edition, ed. A.N.Cox (Springer), p.143A
- Topping (1972) Topping J., 1972, ”Errors of Observation and Their Treatment”, (Chapman and Hall Ltd.), p.89
- Tonry & Davis (1979) Tonry, J., & Davis M., 1979, AJ 84, 1511
- van Hamme (1993) van Hamme, W. 1993 AJ, 106, 2096
- Wilson & Devinney (1971) Wilson R.E. & Devinney E.J., 1971, ApJ, 166, 605