On the Relation between Solar Activity and Clear-Sky Terrestrial Irradiance
Abstract
The Mauna Loa Observatory record of direct-beam solar irradiance measurements for the years 1958–2010 is analysed to investigate the variation of clear-sky terrestrial insolation with solar activity over more than four solar cycles. The raw irradiance data exhibit a marked seasonal cycle, extended periods of lower irradiance due to emissions of volcanic aerosols, and a long-term decrease in atmospheric transmission independent of solar activity. After correcting for these effects, it is found that clear-sky terrestrial irradiance typically varies by % over the course of the solar cycle, a change of the same order of magnitude as the variations of the total solar irradiance above the atmosphere. An investigation of changes in the clear-sky atmospheric transmission fails to find a significant trend with sunspot number. Hence there is no evidence for a yet unknown effect amplifying variations of clear-sky irradiance with solar activity.
keywords:
Atmospheric extinction; Integrated Sun observations; Solar cycle, observations; Sunspots, statistics1 Introduction
s:intro
Long-term records of clear-sky terrestrial solar irradiance are very useful to study changes in atmospheric transmission (e.g., Hoyt and Fröhlich, 1983). It is more difficult to derive changes in insolation due to solar variability from these data because the variations related to solar activity are much smaller than the changes in atmospheric transmission of different origin and the systematic and random errors in the data. Nevertheless, such an approach has been tried many times in the past.
The Smithsonian Astrophysical Observatory (SAO) observations from the first half of the 20th century are an important historical example for terrestrial irradiance measurements with the aim to detect solar variability from the ground (Abbot, Aldrich, and Fowle, 1932; Abbot, Aldrich, and Hoover, 1942; Aldrich and Hoover, 1954). The SAO observing campaigns were designed to derive a time series of the solar constant or total solar irradiance (TSI) above the atmosphere, but calibration issues (Allen, 1958), biases due to strong seasonal variations (Feulner 2011a), and changes in atmospheric transmission independent of solar activity (Ångström, 1970) – mostly related to volcanic aerosols and local pollution (Hoyt, 1979; Roosen and Angione, 1984) – can pose serious difficulties for investigations of irradiance changes related to solar activity if not properly accounted for.
Despite these problems, the SAO data continue to attract attention. Weber (2010, 2011) correlated the ground-based irradiance measurements from the SAO data with sunspot numbers and claimed to have found a strong variation of terrestrial insolation with solar activity, with differences of the order of 1% between solar maxima and minima (i.e., one order of magnitude larger than the variations in the TSI on top of the atmosphere). These findings were criticised by Feulner (2011a, b) who could show that they were due to seasonal bias and the effects of volcanic aerosols and local pollution. The seasonal bias arises from the fact that, by coincidence, days with large sunspot numbers in the SAO data predominantly lie in months with seasonally high atmospheric transmission, making irradiance values at times of high solar activity appear higher. The second bias is introduced because two out of three solar minima in the SAO data covering solar cycles 16, 17, and 18 are affected by reduced atmospheric transmission due to volcanic aerosols and local pollution. This effect makes solar irradiance on the ground during those two minima appear lower, thus again suggesting a stronger variation of terrestrial irradiance with solar activity. After correcting for the seasonal cycle and excluding periods of time affected by aerosols from volcanic eruptions and local pollution, the variations of terrestrial insolation are of the same order of magnitude as the TSI variations (Feulner, 2011a, b).
More recently, Hempelmann and Weber (2012) used terrestrial insolation data taken at Mauna Loa Observatory (MLO) and reported variations of the solar irradiance on the ground a factor of 10 larger than above the atmosphere. Here an improved analysis of these data is presented to independently quantify how much clear-sky terrestrial irradiance varies between solar maxima and minima.
This paper is organised as follows. Section \irefs:data describes the Mauna Loa terrestrial insolation data and corrections of the effects of the seasonal cycle, aerosols from volcanic eruptions, and a linear long-term trend independent of solar activity. In Section \irefs:correlation the correlation of the thus corrected irradiance with sunspot number is presented. Section \irefs:atf analyses the atmospheric transmission factor and its changes with sunspot number, before the results are discussed in the context of previous work in Section \irefs:disc. Finally, Section \irefs:concl summarises and concludes this paper.
2 Data Analysis
s:data
2.1 A First Look at the Raw Irradiance Data
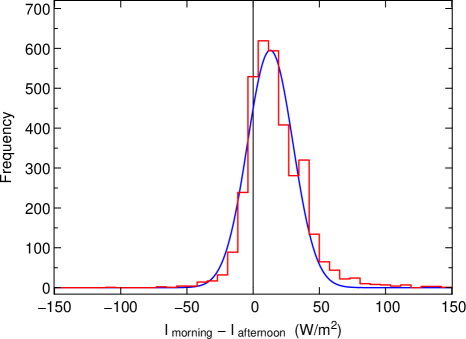
For the analysis in this paper, the ground-based direct-beam solar irradiance data taken since 1958 at Mauna Loa Observatory (MLO, latitude 19.533∘ N, longitude 155.578∘ W, elevation 3 400 m) are used (Ellis and Pueschel, 1971; Dutton, Deluisi, and Austring, 1985; Dutton et al., 1994; Dutton and Bodhaine, 2001). These measurements have been obtained at local noon as well as at airmass values of 2, 3, 4, and 5 (both in the morning and in the afternoon). In the following, results for the morning irradiance data at airmass 2 are presented. Airmass 2 is chosen since smaller airmass values correspond to smaller zenith angles and thus shorter paths through the atmosphere. Furthermore, as in most previous studies based on these data, the morning measurements are preferred over the afternoon data or a combined record of the two due to the absence of local influences on the atmospheric transmission because of downslope winds in the morning hours (Mendonca, 1969). Indeed, a comparison of irradiance morning and afternoon data at airmass two for days where both measurements are available shows that morning irradiance values are larger on average and thus apparently less affected by local disturbances in atmospheric transmission (see Figure \ireff:daydiff).
As a consistency check, the full analysis has been carried out for a combined record of morning and afternoon data and for the other airmass values as well, however, yielding very similar results which are not shown in this paper.

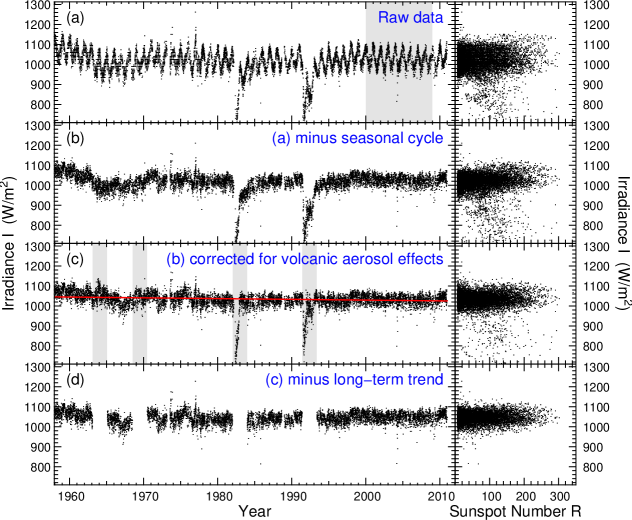
The raw irradiance data at morning airmass 2, for historic reasons given in units of Langley min-1 or cal cm-2 min-1, are shown in Figures \ireff:mlotimea and \ireff:mlotimeb. In this figure, they are compared to the globally averaged optical depth of volcanic aerosols at a wavelength of nm as compiled by Sato et al. (1993) for the years 1959–1993 and by Solomon et al. (2011) for 1994–2010 (Figure \ireff:mlotimeb) and to daily international (also called Wolf or Zürich) sunspot numbers111Available at http://sidc.oma.be/DATA/dayssn˙import.dat, date of access: 22 December 2011. (Figure \ireff:mlotimec).
Several interesting observations can be made in the raw data which are relevant for a proper analysis of correlations with solar activity:
-
i)
The irradiance data exhibit a pronounced seasonal cycle. As shown in Feulner (2011a), not correcting for seasonal variations can affect correlations with solar activity if different phases of solar activity are not evenly distributed over the seasons in the data.
-
ii)
There is a cluster of irradiance data around 0.5 cal cm-2 min-1 in the years 1975–1976. As one can clearly see the seasonal cycle and as these values are offset by 1 from the majority of the data; these are most likely due to typos in the record where values have a leading digit of 0 instead of 1. These typos can either be corrected or masked out; the latter option has been chosen in this paper.
-
iii)
The dimming effects of volcanic aerosols in the atmosphere can be seen directly in the data. These are most pronounced for the largest eruptions, i.e., El Chichón in 1982 and Pinatubo in 1991, of course, but irradiance values are also lower during volcanic episodes in the 1960s and 70s. This can be best seen in the expanded view presented in Figure \ireff:mlotimeb.
-
iv)
Looking at periods only weakly affected by volcanic aerosols over the entire record, one can see a slight decrease of terrestrial irradiance with time previously described in Solomon et al. (2011). It will be shown below that this long-term trend is well approximated by a linear fit and not connected to changes in sunspot number.
All these issues have to be taken care of before correlating the MLO terrestrial irradiance data with sunspot number in order to ensure an unbiased estimate of the influence of solar activity on clear-sky irradiance on the ground. In addition, the MLO data are also affected by changes in instrumentation and offsets in calibration which can also influence any trend analysis (e.g., Dutton and Bodhaine, 2001). These effects can be eliminated, however, by directly investigating atmospheric transmission factors (Ellis and Pueschel, 1971) as shown in Section \irefs:atf.
2.2 Corrections Applied to the Irradiance Data
s:corrections
As a first step, the raw MLO irradiance data for morning airmass 2 as shown in Figures \ireff:mlotimea and \ireff:mlotimeb are converted to SI units (W m-2) by multiplying by a factor of 697.4. These converted irradiance data are shown both as a time series and as a scatter plot vs. sunspot number in Figure \ireff:mlotimecorra. Furthermore, for each day with observations the MLO irradiance data are correlated with daily international sunspot numbers and interpolated volcanic aerosol optical depth data from the same day.
In the discussion above, three sources of systematic bias of the irradiance data were identified: the seasonal cycle, attenuation by volcanic aerosols, and a possible long-term trend. These effects will be discussed and, if possible, corrected in the following. The individual corrections and their effect on the time series as well as the correlation between irradiance and sunspot number are shown in Figure \ireff:mlotimecorr.
2.2.1 Seasonal Cycle
The pronounced seasonal cycle is one of the most obvious features of the raw irradiance time series shown in Figure \ireff:mlotimecorra. One way to correct for this effect is to take data from several years only little affected by volcanic aerosols and combine them to compute median monthly values for the irradiance (Feulner, 2011a). Daily values of this average seasonal irradiance cycle can then be computed from a cubic-spline fit through the data with periodic boundary conditions.
For the MLO data the years from 2000 to 2009 have been chosen to compute the average seasonal cycle (indicated by the grey shading in Figure \ireff:mlotimecorra) as this period of time is only weakly affected by volcanic aerosols. Furthermore, a linear trend with time has been subtracted before computing the monthly median irradiance values to remove any long-term changes in the irradiance baseline (be it from solar activity changes, trends in volcanic or other aerosols, or instrumental drift). The resulting cycle of seasonal irradiance anomalies is shown in Figure \ireff:seasons.
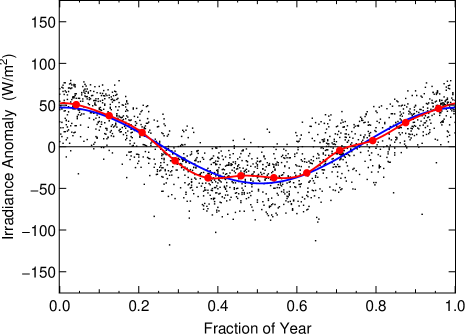
The irradiance data with the seasonal cycle anomaly removed are shown in Figure \ireff:mlotimecorrb. The irradiance variations through the year are clearly dominated by the changes in the distance to the Sun on Earth’s elliptical orbit. In addition there are minor, but statistically insignificant, seasonal anomalies, in particular in spring and summer.
Note that there is quite a bit of interannual variation in the seasonal irradiance cycle; therefore, a perfect correction of the effect cannot be expected. Comparing the irradiance time series with the seasonal cycle subtracted shown in Figure \ireff:mlotimecorrb to the raw irradiance data shows, however, that the seasonal cycle is effectively removed. In particular, the sequence in the irradiance vs. sunspot number scatter plot shown in the right-hand panel of Figure \ireff:mlotimecorrb exhibits less scatter and visually appears considerably better defined.
2.2.2 Effects of Volcanic Aerosols
The second atmospheric effect which has to be taken into account when investigating the correlation between solar activity and terrestrial insolation are the attenuating effects of volcanic aerosols. One way of dealing with episodes of volcanic eruptions is to exclude these periods from further analysis as has been done for the SAO terrestrial irradiance data in Feulner (2011a). This is not a viable option for the frequent volcanic eruptions affecting the MLO data, however. The expected irradiance variations due to solar activity are below 1% or W m-2 corresponding to an attenuation by volcanic aerosols with an optical depth of . Such a cut in aerosol optical depth would mean that more than half of the MLO irradiance record would have to be excluded from the analysis, and even then the remaining record would suffer from inhomogeneous attenuation by volcanic aerosols resulting in irradiance variations at least of the order of the changes expected from solar variability.
A preferable option would be to correct for the effects of volcanic eruptions using an independent dataset of the optical depth of volcanic aerosols. For the analysis in this paper, the Sato et al. (1993) compilation of global average optical depth of volcanic aerosols at wavelength nm is used for the years 1958–1993, extended with the Solomon et al. (2011) data until March 2010 and with a constant value until the end of 2010. The irradiance corrected for the seasonal cycle and the effects of volcanic aerosols is then calculated from the irradiance , which is corrected for the seasonal cycle only, using . In this formula, denotes the airmass, and is a correction factor converting the optical depth at 550 nm to the optical depth integrated over the whole visible solar spectrum. The correction factors for the four airmass values are determined empirically, finding , , and .
The time series and scatter plot for the irradiance corrected for seasons and volcanic aerosols is shown in Figure \ireff:mlotimecorrc. Overall the correction seems to work well for the late stages of volcanic eruptions. There are, however, considerable residuals during times of rapidly changing volcanic aerosol load, in particular for the Pinatubo and El Chichón eruptions. This is not surprising since the global average aerosol optical depth may not be fully representative for the local aerosol load above Mauna Loa, in particular in the period following the eruptions. Furthermore, the Sato et al. (1993) compilation provides monthly values which are not able to trace the fast changes visible in the daily irradiance record. Two-year periods after the four strongest eruptions (Agung, Fernadina, El Chichón, and Pinatubo) will be masked out for the analysis of the correlation between terrestrial irradiance and sunspot number presented below. Note that there is also a dip in the thus corrected irradiance around the year 1967, corresponding to a decrease in volcanic aerosol optical depth in the Sato et al. (1993) record. As the origin of this period of lower irradiance remains unclear, it will not be excluded from the analysis.
2.2.3 Long-Term Trend
Looking at the scatter plot of irradiance values corrected for the seasonal cycle and volcanic aerosols with sunspot number shown in the right-hand panel of Figure \ireff:mlotimecorrc one can indeed see a marked increase of terrestrial solar irradiance with sunspot number. At least part of this trend is clearly driven by what appears to be a separate sequence of measurements at high irradiance ( W m-2) at relatively high sunspot numbers ().
A comparison with the irradiance time series shows that the vast majority of these measurements are from the very first years of the record (years 1958–1961) which, according to Figure \ireff:mlotime, are unaffected by volcanic aerosols and coincide with the particularly strong maximum of solar cycle 19.
These observations are important since the irradiance data shown in Figure \ireff:mlotimecorrc exhibit a slowly decreasing trend over time. This general decrease in irradiance can be clearly seen during the last decade, for example, or by comparing the beginning of the record and the end. This trend in atmospheric transmission has been noted before and attributed to changes in the atmospheric background aerosol load (Solomon et al., 2011).
It will be shown below that this long-term trend can be detected in the data spanning almost five solar cycles. Note, for example, that the decrease can be seen over the entire solar cycle 23 with a constant slope despite large variations in sunspot number. The trend can thus be regarded as independent of solar activity and has to be subtracted to ensure an accurate analysis of the correlation between solar activity and terrestrial irradiance. To this end a linear trend is approximated to the entire record of irradiance data corrected for the seasonal cycle and volcanic aerosols, but excluding the two-year time intervals after the El Chichón and Pinatubo eruptions. Furthermore, the data used to fit the linear trend are restricted to the range to ensure that the fit of the long-term trend is not driven by changes in solar activity between the strong solar maximum of cycle 19 and the considerably less pronounced maximum of cycle 23. Fitting a linear trend using these data yields a slope of W m-2 yr-1. This is very similar to the trend found in Solomon et al. (2011). As will be shown below, a multivariate regression has been performed on to simultaneously analyse its linear trends with sunspot number and time as an additional test whether the trend in time reported here is indeed independent of solar activity, finding a very similar value for the long-term decrease in terrestrial irradiance with time.
Thus there is indeed a significant long-term decrease in terrestrial irradiance which is independent of solar activity and therefore has to be subtracted from the data before analysing any correlation of irradiance with sunspot number. The resulting irradiance time series of and its scatter plot are shown in Figure \ireff:mlotimecorrd. It should be noted that the conspicuous second sequence at large irradiance values in the scatter plot has now disappeared and that the overall correlation shows a considerably smaller slope than before the subtraction of the linear long-term trend.
3 Correlation of Terrestrial Irradiance with Sunspot Number
s:correlation
After applying the corrections for the seasonal cycle, for the attenuating effects of volcanic aerosols, and for the linear long-term trend, the MLO terrestrial irradiance data at morning airmass 2 can now be correlated with the sunspot number to investigate changes of terrestrial irradiance with solar activity.
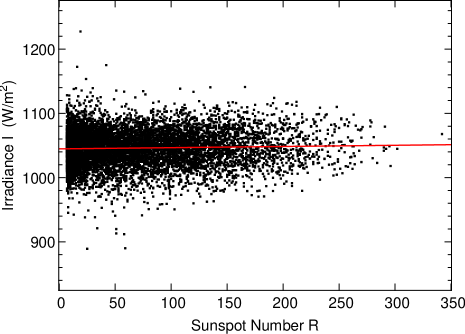
The corrected irradiance data as a function of sunspot number are presented in Figure \ireff:correlation. Fitting a line to this correlations yields a slope
| (1) |
The error has been computed from 10 000 bootstrapping simulations where the sample is first duplicated and added to the original sample, then modified by random errors, before half of the enlarged sample is randomly selected to perform the linear regression (see also Feulner, 2011a). A random error of 0.5% is assumed for the individual MLO irradiance measurements (Dutton and Bodhaine, 2001) during these bootstrapping simulations.
In the analysis so far, the long-term trend with time of the irradiance corrected for the seasonal cycles and the effects of volcanic aerosols has been removed before correlating with sunspot number . While this is highly illustrative, it is statistically more appropriate to perform a simultaneous multivariate linear regression of with respect to trends with and . Thus one can also independently test whether the linear trend in time reported in Section \irefs:corrections is indeed independent of solar activity as traced by the sunspot number . This test yields a linear trend of terrestrial irradiance with time of W m-2 yr-1, which is slightly larger than the value reported above, but compatible within the errors. The slope of the correlation with sunspot number derived in this way is
| (2) |
again in excellent agreement with the value from Equation (1).
Thus a simultaneous regression of a linear long-term trend with time and a linear trend with sunspot number to the terrestrial irradiance data not yet corrected for the linear trend yields results which are very similar to the ones described above. This is important because if the long-term trend in terrestrial irradiance had been caused by changes in solar activity, this long-term trend would be reflected in the sunspot numbers as well, and the regression would have yielded an insignificant trend with time. This clearly shows that the linear long-term trend described above is indeed not caused by solar activity.
As a test whether this result depends on the choice of sunspot number as indicator of solar activity, the simultaneous regression has been repeated for annual means of the open solar flux (Lockwood, Rouillard, and Finch, 2009), finding consistent values for the trends, albeit with larger errors ( W m-2 yr-1 and W m-2 Wb-1).
In summary, a positive trend of the corrected terrestrial irradiance data with sunspot number can be found in the MLO data which is significant on the level. The magnitude of these changes of solar irradiance on the ground with respect to changes in irradiance on top of the atmosphere and previous studies on correlations of terrestrial irradiance with solar activity will be discussed in Section \irefs:disc.
4 Correlation of Atmospheric Transmission with Sunspot Number
s:atf
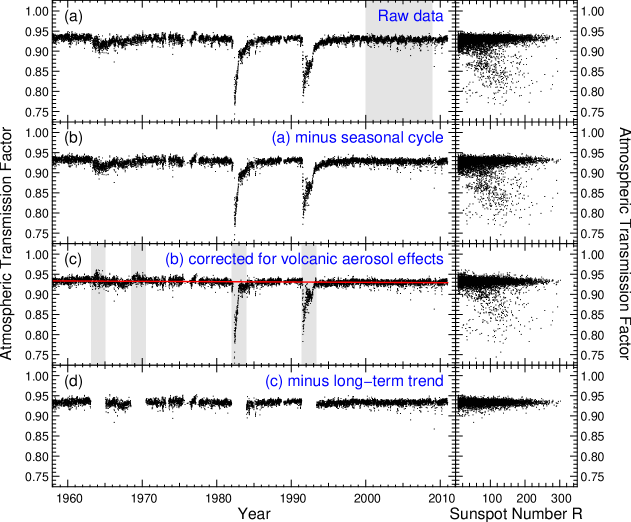
The analysis above investigated the correlation of terrestrial insolation with sunspot number to investigate the possibility of a so-far unknown amplification effect produced by changes in clear-sky atmospheric transmission. Alternatively, one can directly study the atmospheric transmission itself. The advantage of this approach is that one can make use of the rationing technique which eliminates both the variations in TSI and any instrumental calibration differences (Ellis and Pueschel, 1971). In this method, atmospheric transmission is analysed in terms of the atmospheric transmission factor (ATF) defined as follows:
| (3) |
where are the morning irradiance values at the different airmass values of 2, 3, 4, and 5. The ATF for the Mauna Loa data is shown in Figure \ireff:mlotimeatfa.
Before correlating the ATF with sunspot number , the same corrections have to be applied as for the irradiance data (see Section \irefs:corrections). The seasonal cycle in the ATF is computed as for the irradiance, but note that the dominant effect caused by the orbital motion of the Earth is already taken care of by the rationing technique. The remaining corrections for the effects of volcanic aerosols and the long-term trend (with a best-fitting value of yr-1) also follow the procedure discussed in detail for the irradiance. The stepwise corrections and their effect both on the time series and for the correlation with sunspot number are illustrated in Figure \ireff:mlotimeatf.
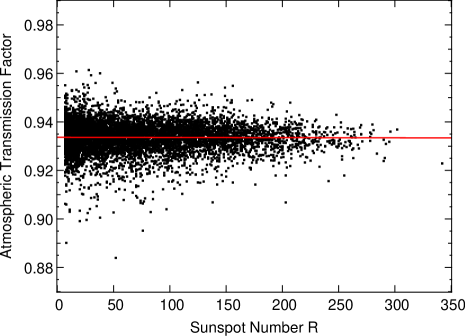
The correlation between the corrected atmospheric transmission factor ATF and sunspot number is shown in Figure \ireff:atfcorrelation. A linear fit to this correlation yields
| (4) |
As for the irradiance data, an improved analysis is performed in which both the long-term trend of the ATF with time and its correlation with sunspot number are fit simultaneously. This analysis yields a value of yr-1 for the long-term trend, in good agreement with the value derived above. The fact that the simultaneous linear regression of the ATF finds a significant long-term trend with time again confirms that this long-term trend is independent of solar activity. The linear correlation of the ATF with sunspot number has a slope of , again in agreement with Equation (4). Thus no significant change of atmospheric transmission with sunspot number can be detected in the Mauna Loa data.
To test for a possible dependence of this result on the choice of solar-activity indicator, the bivariate regression has been repeated replacing the sunspot number by the open solar flux (using annual averages of the data as for the analysis of the irradiance data). Again, the trends derived for the open solar flux are in good agreement with the trends computed using sunspot numbers, although the errors are larger ( yr-1 and Wb-1).
5 Discussion
s:disc
The analysis in Section \irefs:correlation shows that the corrected terrestrial insolation linearly increases with sunspot number with a slope W m-2. With typical differences in sunspot number of between solar maxima and minima, this translates into irradiance variations of W m-2 or % over the solar cycle. This is of the same order of magnitude as the variations in total solar irradiance (TSI) observed from satellites (e.g., Fröhlich and Lean, 2004; Gray et al., 2010) which suggests that clear-sky terrestrial irradiance variations with solar activity are not strongly amplified by any hitherto unknown atmospheric feedback processes.
The conflicting results in Hempelmann and Weber (2012) who find a one order of magnitude larger variation in terrestrial irradiance with solar activity ( W m-2 depending on the way the effects of volcanic eruptions are accounted for) can be understood from the fact that the authors have not corrected the terrestrial irradiance data for the slow long-term decrease in atmospheric transmission not related to changes in solar activity. The combination of large irradiance values at the beginning of the record with large sunspot numbers during the strong maximum of solar cycle 19 then results in a spuriously large slope of the irradiance vs. sunspot number correlation. In addition, excluding periods of up to three years after volcanic eruptions as done in Hempelmann and Weber (2012) is insufficient as attenuation effects at the percent level are visible in the data even after this time, resulting in changes of at least the order of magnitude of the changes related to solar variability (see the discussion in Section \irefs:corrections).
The lack of evidence for any unknown effect amplifying changes of terrestrial irradiance with solar activity in the MLO data is confirmed by an analysis of the correlation of the atmospheric transmission factor with sunspot number which failed to find a significant change of clear-sky atmospheric transmission with solar activity.
6 Conclusions
s:concl
In this paper, the Mauna Loa Observatory (MLO) direct-beam solar irradiance record has been analysed to investigate the correlation between solar activity and terrestrial insolation. After correcting for the seasonal cycle, the attenuating effects of volcanic aerosols, and a long-term decrease in atmospheric transmission independent of solar activity, clear-sky terrestrial irradiance is found to vary by % between maxima and minima of the 11-year solar activity cycle. These variations are of the same order of magnitude as the changes in total solar irradiance on top of the atmosphere over the solar activity cycle. An investigation of the atmospheric transmission shows that there is no significant trend of clear-sky atmospheric transmission with sunspot number. Thus there is no evidence for an unknown amplification effect of solar activity in terms of strong changes in clear-sky atmospheric transmission.
Acknowledgements
I would like to thank Ellsworth G. Dutton for providing me with the latest version of the Mauna Loa Observatory terrestrial solar irradiance data and for many helpful comments on these data. I am grateful to the anonymous referee for a thorough review. This research has made use of NASA’s Astrophysics Data System Bibliographic Services.
References
- Ångström (1970) Ångström, A.: 1970, Apparent solar constant variations and their relation to the variability of atmospheric transmission. Tellus 22, 205 – 218. doi:10.1111/j.2153-3490.1970.tb01522.x.
- Abbot, Aldrich, and Fowle (1932) Abbot, C.G., Aldrich, L.B., Fowle, F.E.: 1932, Annals of the Astrophysical Observatory of the Smithsonian Institution, Volume 5, Smithsonian Institution, Washington, DC.
- Abbot, Aldrich, and Hoover (1942) Abbot, C.G., Aldrich, L.B., Hoover, W.H.: 1942, Annals of the Astrophysical Observatory of the Smithsonian Institution, Volume 6, Smithsonian Institution, Washington, DC.
- Aldrich and Hoover (1954) Aldrich, L.B., Hoover, W.H.: 1954, Annals of the Astrophysical Observatory of the Smithsonian Institution, Volume 7, Smithsonian Institution, Washington, DC.
- Allen (1958) Allen, G.W.: 1958, Solar radiation. Quart. J. Roy. Meteor. Soc. 84, 307 – 318. doi:10.1002/qj.49708436202.
- Dutton and Bodhaine (2001) Dutton, E.G., Bodhaine, B.A.: 2001, Solar irradiance anomalies caused by clear-sky transmission variations above Mauna Loa: 1958-99. J. Climate 14, 3255 – 3262. doi:10.1175/1520-0442(2001)0143255:SIACBC2.0.CO;2.
- Dutton, Deluisi, and Austring (1985) Dutton, E.G., Deluisi, J.J., Austring, A.P.: 1985, Interpretation of Mauna Loa atmospheric transmission relative to aerosols, using photometric precipitable water amounts. J. Atmos. Chem. 3, 53 – 68. doi:10.1007/BF00049368.
- Dutton et al. (1994) Dutton, E.G., Reddy, P., Ryan, S., DeLuisi, J.J.: 1994, Features and effects of aerosol optical depth observed at Mauna Loa Hawaii: 1982-1992. J. Geophys. Res. 99, 8295 – 8306. doi:10.1029/93JD03520.
- Ellis and Pueschel (1971) Ellis, H.T., Pueschel, R.F.: 1971, Solar radiation: Absence of air pollution trends at Mauna Loa. Science 172, 845 – 846. doi:10.1126/science.172.3985.845.
- Feulner (2011) Feulner, G.: 2011, Comment on “Strong signature of the active Sun in 100 years of terrestrial insolation data” by W. Weber. Ann. Phys. (Berlin) 523, 946 – 950. Referred to as Feulner (2011b). doi:10.1002/andp.201100179.
- Feulner (2011) Feulner, G.: 2011, The Smithsonian solar constant data revisited: no evidence for a strong effect of solar activity in ground-based insolation data. Atmos. Chem. Phys. 11, 3291 – 3301. Referred to as Feulner (2011a). doi:10.5194/acp-11-3291-2011.
- Fröhlich and Lean (2004) Fröhlich, C., Lean, J.: 2004, Solar radiative output and its variability: evidence and mechanisms. Astron. Astrophys. Rev. 12, 273 – 320. doi:10.1007/s00159-004-0024-1.
- Gray et al. (2010) Gray, L.J., Beer, J., Geller, M., Haigh, J.D., Lockwood, M., Matthes, K., Cubasch, U., Fleitmann, D., Harrison, G., Hood, L., Luterbacher, J., Meehl, G.A., Shindell, D., van Geel, B., White, W.: 2010, Solar influences on climate. Rev. Geophys. 48, G4001. doi:10.1029/2009RG000282.
- Hempelmann and Weber (2012) Hempelmann, A., Weber, W.: 2012, Correlation between the sunspot number, the total solar irradiance, and the terrestrial insolation. Solar Phys. 277, 417 – 430. doi:10.1007/s11207-011-9905-4.
- Hoyt (1979) Hoyt, D.V.: 1979, Pyrheliometric and circumsolar sky radiation measurements by the Smithsonian Astrophysical Observatory from 1923 to 1954. Tellus 31, 217 – 229. doi:10.1111/j.2153-3490.1979.tb00900.x.
- Hoyt and Fröhlich (1983) Hoyt, D.V., Fröhlich, C.: 1983, Atmospheric transmission at Davos, Switzerland 1909-1979. Climatic Change 5, 61 – 71. doi:10.1007/BF00144680.
- Lockwood, Rouillard, and Finch (2009) Lockwood, M., Rouillard, A.P., Finch, I.D.: 2009, The rise and fall of open solar flux during the current grand solar maximum. Astrophys. J. 700, 937 – 944. doi:10.1088/0004-637X/700/2/937.
- Mendonca (1969) Mendonca, B.G.: 1969, Local wind circulation on the slopes of Mauna Loa. J. Appl. Meteorol. 8, 533 – 541. doi:10.1175/1520-0450(1969)0080533:LWCOTS2.0.CO;2.
- Roosen and Angione (1984) Roosen, R.G., Angione, R.J.: 1984, Atmospheric transmission and climate: results from Smithsonian measurements. Bull. Am. Meteorol. Soc. 65, 950 – 957. doi:10.1175/1520-0477(1984)0650950:ATACRF2.0.CO;2.
- Sato et al. (1993) Sato, M., Hansen, J.E., McCormick, M.P., Pollack, J.B.: 1993, Stratospheric aerosol optical depths, 1850-1990. J. Geophys. Res. 98, 22987 – 22994. doi:10.1029/93JD02553.
- Solomon et al. (2011) Solomon, S., Daniel, J.S., Neely, R.R., Vernier, J.-P., Dutton, E.G., Thomason, L.W.: 2011, The persistently variable “background” stratospheric aerosol layer and global climate change. Science 333, 866 – 870. doi:10.1126/science.1206027.
- Weber (2010) Weber, W.: 2010, Strong signature of the active Sun in 100 years of terrestrial insolation data. Ann. Phys. (Berlin) 522, 372 – 381. doi:10.1002/andp.201000019.
- Weber (2011) Weber, W.: 2011, Reply to the comment of G. Feulner. Ann. Phys. (Berlin) 523, 951 – 956. doi:10.1002/andp.201100171.