The Unchanging Circumgalactic Medium Over the Past 11 Billion Years
Abstract
This paper examines how the circumgalactic medium (CGM) evolves as a function of time by comparing results from different absorption-line surveys that have been conducted in the vicinities of galaxies at different redshifts. Despite very different star formation properties of the galaxies considered in these separate studies and different intergalactic radiation fields at redshifts between and , I show that both the spatial extent and mean absorption equivalent width of the CGM around galaxies of comparable mass have changed little over this cosmic time interval.
keywords:
galaxies:halos – galaxy: star formation – quasars: absorption lines – survey1 INTRODUCTION
It is understood that galaxy growth is regulated by three competing processes: mergers, gas accretion that supplies the fuel necessary to support star formation, and feedback that returns gas and heavy elements to intergalactic space and consequently disrupts continuing gas accretion (Ceverino & Klypin 2009). Which process dominates and over what period of time determines not only the properties of the general galaxy population in different epochs, but also the chemical enrichment history of the intergalactic medium (IGM). Circumgalactic space provides a critical laboratory for investigating the interplay between star-forming regions and the IGM.
A powerful means to study and characterize the circumgalactic medium (CGM) is to carry out absorption spectroscopy of background QSOs in the vicinities of distant galaxies. By searching for absorption features in the spectrum of the background QSO that are coincident in redshift with known galaxies in the foreground, empirical constraints on the CGM such as absorber strength and gas kinematics can be obtained at the projected separations between the galaxy and QSO pairs (e.g. Lanzetta et al. 1995; Bowen et al. 1995; Steidel et al. 2002). Unlike 21 cm observations which offer detailed two-dimensional maps of extended H I gas around individual galaxies, each QSO sightline provides only one measurement per galaxy. However, observations of a large sample of QSO-galaxy pairs with different projected separations can give a two-dimensional map of the CGM averaged over the entire galaxy sample.
Significant progress has been made over the past decade in mapping the CGM out to kpc projected distances at redshift using a large sample of QSO-galaxy pairs. This includes the spatial distributions of tenuous gas probed by the H I absorption transition (e.g. Chen et al. 1998, 2001a; Tripp et al. 1998; Prochaska et al. 2011), chemically-enriched cool ( K) clouds probed by the Mg II absorption doublet (e.g. Chen & Tinker 2008; Kacprzak et al. 2008; Barton & Cooke 2009; Chen et al. 2010a,b; Gauthier et al. 2010; Gauthier & Chen 2011), chemically-enriched ionized gas probed by the C IV absorption doublet, (e.g. Chen et al. 2001b), and highly ionized warm gas probed by the O VI absorption doublet (e.g. Chen & Mulchaey 2009; Prochaska et al. 2011; Tumlinson et al. 2011). However, studies of the CGM using QSO absorption spectroscopy become significantly more difficult with increasing redshift, both because the surface density of bright QSOs is low and because high-redshift galaxies are faint (for example, an galaxy has mag at ; e.g. Adelberger & Steidel 2000) and moderate-resolution spectroscopy of these faint galaxies requires a large amount of telescope resources (e.g. Steidel et al. 2004; Erb et al. 2003; Simcoe et al. 2006).
At the same time, deep galaxy surveys like the Keck Baryonic Structure Survey (Steidel et al. 2004), zCOSMOS (e.g. Lilly et al. 2007) and DEEP2 (Newman et al. 2012) have yielded a large sample of spectroscopically identified galaxies . With a higher surface density, galaxies identified in the background in these surveys in principle provide an efficient means of densely mapping the CGM of foreground galaxies identified in the same surveys (e.g. Adelberger et al. 2005). The caveat is, however, that galaxies are faint and individual galaxy spectra do not provide a sufficient signal-to-noise ratio (S/N) for identifying weak absorption features in the foreground. Therefore, it is necessary to average together a large number of galaxy spectra in order to obtain sensitive constraints on the CGM at these high redshifts (e.g. Steidel et al. 2010; Bordoloi et al. 2011). While using galaxy-galaxy pairs has substantially improved the efficiency of probing the CGM using absorption spectroscopy, it is worth noting that absorption constraints derived from stacked spectra only give the mean properties of the gas averaged over a sample of galaxies and do not constrain the incidence or covering fraction of the gas.
With different empirical studies now available in the literature to characterize the CGM in different epochs, it is interesting to examine how the properties of the CGM have evolved with time. Both galaxies and the IGM exhibit very different properties at different redshifts. For example, most galaxies at are seen actively forming stars at higher rates than most galaxies at low redshift (e.g. Ouchi et al. 2009). In addition, the ultraviolet background radiation field is more than ten times higher at than at (e.g. Haardt & Madau 2012). Observations of the CGM as a function of redshift may provide key insights into the physical processes that drive the gas dynamics and chemical enrichment in circumgalactic space. This paper addresses the redshift evolution of the CGM by comparing different absorption-line studies of halo gas conducted at different redshifts. Despite very different star formation properties of the galaxies and different intergalactic radiation fields at redshifts from to , I show that the extent and absorption strength of the CGM have not changed over the past 11 billion years. A cosmology, and , with a Hubble constant is adopted throughout the paper.
2 The Galaxy Samples
Five galaxy samples have been collected from the literature for studying the CGM across cosmic time. The galaxies are selected to have available constraints on the properties of their halo gas from absorption-line studies. In addition, the discussion focuses on the absorption species, H I, C IV, and Mg II for which measurements are available from multiple epochs. A brief description of the galaxy samples and associated absorption-line measurements follows.
2.1 The Chen et al. (1998, 2001ab) sample at
Chen et al. (1998, 2001a) presented a sample of 47 galaxies at projected distances of kpc111All numbers quoted in this paper have been corrected for the standard cosmology. (proper) from the lines of sight toward background QSOs and obtained measurements (or upper limits) of the associated absorption strength for individual galaxies in the spectra of the background QSOs. The galaxies in this sample span a broad range in rest-frame -band luminosities (from to with a median of ), a broad range in redshifts (from to 0.8920 with a median of ), and a range in impact parameter separations (from to kpc with a median of kpc). High spatial resolution optical images obtained from the Hubble Space Telescope were available for classifying the morphological types of these galaxies according to the disk-to-bulge ratio () derived from a two-dimensional surface brightness profile analysis. The galaxies were found to exhibit a broad range of optical morphologies, including bulge-dominated elliptical/S0 (), earl-type spiral galaxies (), late-type disks (), and galaxies with disturbed profiles that cannot be characterized by a normal disk or bulge.
To constrain the incidence and strength of tenuous gas around the 47 galaxies, Chen et al. (1998, 2001a) searched for the associated absorbers in the spectra of the background QSOs. They detected corresponding absorbers at velocity separations km s-1 from 34 galaxies and placed 3- upper limits to the rest-frame absorption equivalent width for the remaining 13 galaxies. The distribution of versus for this galaxy sample is shown in Figure 1 (solid circles). These authors report a strong versus anti-correlation (left panel of Figure 1; see also Lanzetta et al. 1995) that depends strongly on galaxy -band luminosity, but not on galaxy morphology, mean surface brightness, or redshift.
Using a likelihood analysis formulated to minimize the scatter in the versus anti-correlation, Chen et al. (1998, 2001a) concluded that the extent of tenuous gas around galaxies scales with galaxy -band luminosity as where kpc for Å (right panel of Figure 1) and that the mean gas covering fraction is % within . The improved versus anti-correlation after taking into account the luminosity normalization of the projected distances strongly supports that the absorbers trace tenuous gas in individual halos surrounding the galaxies rather than tenuous gas in galaxy groups or large-scale filaments around the galaxy overdensities.
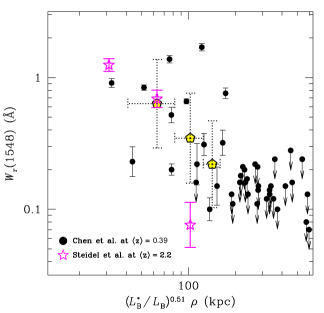
In a follow-up paper, Chen et al. (2001b) examined the incidence and strength of C IV absorption features in the vicinities of 50 galaxies. They detected C IV absorption features at velocity separations km s-1 from 14 galaxies and placed 3- upper limits to the rest-frame C IV 1548 absorption equivalent width for the remaining 36 objects. These authors found that while the versus distribution exhibits a large scatter, there appears to a distinct boundary between C IV-absorbing and non-absorbing regions in galactic halos. Based on a likelihood analysis formulated to minimize the scatter between detections and non-detections in the versus distribution, Chen et al. concluded that the extent of C IV-enriched gas scales with galaxy -band luminosity as where kpc. The luminosity-normalized versus distribution is presented in Figure 2 (solid circles).
Figure 2 shows that while the mean covering fraction of C IV-enriched gas within is high, %, around these low-redshift galaxies, the scatter in the versus relation is also large. To facilitate a comparison between different studies, the galaxies within 160 kpc of the QSO sightlines in the low-redshift study are divided into subsamples according to the impact parameter bins adopted by Steidel et al. (2010). The 1- clipped mean and dispersion of in each subsample of Chen et al. (2001b) are shown as the pentagon symbols and the associated errorbars.
Note that with a large scatter in , the strongest absorbers naturally dominate in calculating the mean value over a small sample of galaxies per impact parameter bin (cf. galaxies per impact parameter bin in the stacks of Steidel et al.). Applying a 1- clipping criterion allows a more accurate assessment of the mean intrinsic properties based on a rough estimate of the underlying distribution. As a result of the clipping criterion, one galaxy at luminosity-normalized kpc with an associated C IV absorber of Å is found to fall outside of the 1- range and excluded from the mean calculation. This is the only galaxy excluded in the 1- clipped mean calculation of the Chen et al. sample.
2.2 The Chen et al. (2010a) sample at
Using a sample of 94 galaxies spectroscopically identified at redshifts between and with a median redshift of and located at kpc from the line of sight of a background QSO, Chen et al. (2010a) examined the incidence and strength of Mg II absorption features around galaxies. The galaxies in this sample span a broad range in rest-frame -band luminosities, from to with a median of , and a broad range in rest-frame colors from to . In a follow-up study, Chen et al. (2010b) estimated the total stellar mass and mean star formation rate average over the last 10 Myr by analyzing the broad-band spectral energy distribution of these galaxies. The galaxies are found to span a stellar mass range from to with a median of and a range in specific star formation rate from to with a median of .
Excluding galaxies with known neighbors at kpc, Chen et al. (2010a) detected corresponding Mg II absorbers at velocity separations km s-1 47 galaxies and placed 2- upper limits to the rest-frame Mg II 2796 absorption equivalent width for the remaining 24 galaxies. Similar to the study of extended absorbing gas, these authors report a strong versus anti-correlation that depends strongly on galaxy -band luminosity or stellar mass, but not on galaxy colors or redshift (Chen et al. 2010a,b). Based on a likelihood analysis formulated to minimize the scatter in the versus anti-correlation, the authors concluded that the extent of Mg II-enriched gas around galaxies scales with galaxy -band luminosity as where kpc and that the mean gas covering fraction is % within for absorbers of Å.
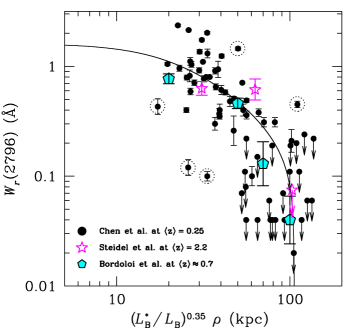
The luminosity-normalized versus distribution is presented in Figure 3 (solid circles). Outliers identified based on a 3- clipping criterion are highlight in dotted circles. Galaxies with close neighbors are indicated by open symbols.
2.3 The Steidel et al. (2010) sample at
Steidel et al. (2010) examined the CGM at using a sample of 512 close galaxy pairs separated by . At the median redshift of the galaxy pair sample , an angular separation of corresponds to projected separations of kpc. Galaxies in each pair are found at cosmologically distinct redshifts with line-of-sight velocity separation km s-1, and therefore the background galaxy serves as a random probe of unseen gas associated with the foreground galaxy (see also Adelberger et al. 2005). -band magnitudes of these galaxies range from to with a median (e.g. Steidel et al. 2004), corresponding to roughly at (e.g. Reddy & Steidel 2009). The mean stellar mass of these galaxies is found to be around (Shapley et al. 2005). Many of these galaxies are actively forming stars, showing relatively luminous UV fluxes and strong blueshifted self-absorption in the UV ISM lines (e.g. Shapley et al. 2003; Steidel et al. 2004; Adelberger et al. 2005).
To map the CGM of these star-forming galaxies, Steidel et al. first divided the galaxy sample in three impact parameter bins, kpc, kpc, and kpc, and in each bin they formed an average spectrum of the background galaxies after shifting the individual spectra to the rest frame of their foreground members. The mean spectra were of high and revealed several absorption features imprinted by the CGM of the foreground galaxies. These include hydrogen , C IV , and Si II , although the relatively low resolution of the spectra did not allow the authors to resolve the C IV doublet.
Measurements of the absorber strength versus impact separation from Steidel et al. (2010) are included in Figures 1 through 3 (star symbols) for direct comparisons with observations of the CGM at lower redshifts. Note that the measurements at kpc were made using stacks of high spectra of background QSOs in the rest frame of 21 foreground galaxies. In addition, the original C IV absorption strength reported by Steidel et al. (2010) include both components of the doublet. The values and associated uncertainties of for the galaxies in Figure 2 are estimated based on a range of possible C IV doublet ratio from 2:1 to 1:1 due to line saturation. Finally, Mg II absorption doublets are redshifted into the near-infrared spectral window at , and are therefore missed in the available optical spectra of Steidel et al. (2010). However, the Si+ and ions have comparable ionization potentials and are observed to coexist in a broad range of astrophysical environment (e.g. Sembach & Savage 1996;; Ganguly et al. 2005; Churchill et al. 2000). It is therefore justified to infer the associated Mg II absorption strength of the galaxies based on known absorption strength of Si II , from Steidel et al. Based on the observations of Churchill et al. (2000), I estimate that . The inferred of the galaxies are shown in Figure 3 as star symbols.
2.4 The Prochaska et al. (2011) sample at
Prochaska et al. (2011) conducted a galaxy survey in the fields of 14 QSOs at for which UV absorption spectra were available for searching and O VI absorption features associated with the low-redshift CGM. The survey reached % completeness for galaxies brighter than mag within radius of the QSO lines of sight. The galaxies in this sample span a broad range in rest-frame -band luminosities, from to with a median of , and a broad range in redshifts, from to 0.5 with a median of .
Considering only galaxies at kpc from the lines of sight toward background QSOs, the authors examined the incidence and strength of in the vicinities of these galaxies. Crosses in Figure 1 represent the results from Prochaska et al. (2011) with (right panel) and without (left panel) the luminosity scaling.
2.5 The Bordoloi et al. (2011) sample at
The zCOSMOS team (Lilly et al. 2007) has produced a large sample of spectroscopically identified galaxies with mag at over the 2 deg2 sky area covered by the COSMOS project (Scoville et al. 2007). Additional spectroscopic data have also been obtained in the follow-up zCOSMOS-deep effort that targeted fainter galaxies ( mag) in the inner 1 deg2 region of the COSMOS field with photometric redshifts . Taking advantage of the existing large galaxy survey data, Bordoloi et al. (2011) adopted the approach of Steidel et al. (2010) and examined the properties of the metal-enriched CGM at intermediate redshifts based on the incidence and strength of Mg II absorbers in the vicinities of zCOSMOS galaxies.
Specifically, Bordoloi et al. first identified foreground galaxies with redshift accurately known at from the zCOSMOS-bright sample. These authors then identified background galaxies with spectra available from zCOSMOS-deep. Although the zCOSMOS-deep spectra did not have sufficient quality for measuring the redshifts for some of these objects, the selection criterion ensures that the majority of these objects are at and therefore their optical spectra are still useful for searching for intervening absorption features at . Cross-correlating the two galaxy samples, Bordoloi et al. identified a sample of galaxies at and located within kpc of a background galaxy. The spectra of the background galaxies were co-added in the rest frame of the foreground objects. The spectral coverage allowed these authors to search for Mg II absorption features associated with the foreground galaxies and to examine the properties of the metal-enriched CGM based on the observed spatial distribution of . The observed versus distribution for blue galaxies from Bordoloi et al. (2011) is shown as cyan crosses in Figure 3.
Note that the consideration of only blue galaxies from Bordoloi et al. is justified here by their mean stellar mass range , which is comparable to galaxies in the Chen et al. sample (§ 2.2) and Steidel et al. (§ 2.3) samples shown in the same figure. The red galaxies in the Bordoloi et al. sample are more massive with . In addition, Chen et al. (2010b) showed that the majority of galaxies in the Chen et al. (2010a) sample fall on the blue sequence. Few galaxies exhibit colors that are consistent with red galaxies in the field. Most of their red galaxies also turned out to be in a group environment and were excluded from their analysis. The incidence and strength of Mg II absorbers around massive red galaxies have been found suppressed relative to younger and lower mass objects (e.g. Gauthier et al. 2010, Gauthier & Chen 2011; Bordoloi et al. 2011). The red sample of Bordoloi et al. is therefore not considered in this study.
Finally, the exact distribution of -band luminosity in Bordoloi et al. sample is not known. However, at , the limiting magnitude of the zCOSMOS sample corresponds to (see e.g. Faber et al. 2007). Therefore the measurements of Bordoloi et al. have not been corrected for luminosity differences in Figure 3.
3 Discussion
The collection of five absorption-line surveys in the vicinities of distant galaxies offers a unique opportunity to examine for the first time how the properties of the CGM have evolved with redshift. It is immediately clear from Figures 1, 2, and 3 that the observed absorber strength versus luminosity-normalized projected distance does not vary from to for ionized gas probed by either hydrogen, C IV, or Mg II transitions. To assess the statistical significance of the observed lack of redshift evolution, I perform a test to compare the absorption properties of the CGM at different redshifts. The results are summarized in Table 1.
Specifically, I first adopt the best-fit power-law function of Chen et al. (2001a) at as the fiducial model. Then I estimate the probability of the observed radial distribution of hydrogen absorption around galaxies being drawn from the fiducial model. I find that the probability of the two samples sharing the same parent distribution is %. Next, I repeat the same approach for Mg II absorbing gas, adopting the best-fit model profile of Chen et al. (2010a) at as the fiducial model and estimating the probability of each of the Bordoloi et al. (2011) and Steidel et al. (2010) samples being drawn from the fiducial model. I find that the probability of galaxies possessing the same radial absorption profile of low-ionization species since is better than 97%. The result for C IV absorbing gas is more uncertain, because fewer galaxies were found at luminosity-normalized kpc in the low-redshift sample. Owing to the observed large scatter in Figure 2, no analytic model presents a good fit to the data. The test is therefore performed based on comparisons of the binned data (pentagons versus star symbols in Figure 2). This exercise also yields a high probability of 80% that the low- and high-redshift samples share similar C IV absorption properties in the CGM. In summary, the test therefore supports the conclusion that the CGM exhibits little change in the absorption properties over the redshift range from to .
| Sample | Probe | test | |
|---|---|---|---|
| hydrogen absorption | |||
| Chen et al. (1998, 2001a) | QSO-galaxy | 0.36 | |
| Steidel et al. (2010) | Galaxy-galaxy | 2.20 | 99% |
| Prochaska et al. (2011) | QSO-galaxy | 0.18 | 99% |
| C IV absorption | |||
| Chen et al. (2001b) | QSO-galaxy | 0.39 | |
| Steidel et al. (2010) | Galaxy-galaxy | 2.20 | 80% |
| Mg II absorption | |||
| Chen et al. (2010a) | QSO-galaxy | 0.25 | |
| Steidel et al. (2010)a | Galaxy-galaxy | 2.20 | 97% |
| Bordoloi et al. (2011) | Galaxy-galaxy | 99% | |
| aAs described in the text, the Mg II absorption strength here | |||
| is inferred from the reported Si II 1260 transition. | |||
Note that the lack of variation applies to both mean absorption equivalent width and the spatial extent of the CGM traced by either hydrogen or heavy ions such as C3+ and Mg+. The absorption features adopted for the comparison are all strong transitions and are likely saturated. Although measurements of the rest-frame absorption equivalent width for saturated lines do not constrain the underlying total gas column densities, they constrain the mean number of absorbing clumps and gas kinematics along the lines of sight (e.g. Petitjean & Bergeron 1990; Prochter et al. 2006). It is therefore important to keep in mind that the agreement in the mean absorption equivalent width between the CGM at low and high redshifts reflects primarily similar kinematics and volume filling factor of gaseous clumps, not total gas density, in galactic halos. But whether or not the absorption lines are saturated does not change the conclusion that the spatial extent ( kpc) of the chemically CGM has varied little with time. Here I consider possible systematics and implications.
3.1 Point sources versus extended background light
A fundamental difference between CGM studies at low and high redshifts is the use of point-like QSOs versus spatially extended galaxies as the background light source. The UV continuum emission regions of QSOs are 1 pc (e.g. Blackburne et al. 2012), while galaxies at have a typical half-light radius of kpc (e.g. Law et al. 2007). If the foreground gaseous clouds do not fully cover the background galaxies, then the absorption equivalent width would appear to be weaker than what is seen in the spectrum of a background QSO when the QSO light is fully covered by the clouds. Comparisons between measurements made along QSO and galaxy sightlines therefore need to take into account the effect of possible partial covering fractions.
A key result in the low-redshift surveys summarized in § 2 is that the covering fraction of extended gas around galaxies is nearly unity. Specifically, the mean covering fraction of tenuous gas probed by is % within ; the mean covering fraction of C IV-enriched gas within is %; and the mean covering fraction of Mg II-enriched gas within is %. Accounting for possible partial covering fractions is therefore unlikely to change the measurements of Bordoloi et al. (2011) and Steidel et al. (2010) by more than 20%. A high gas covering fraction is confirmed in CGM surveys at using QSO probes by Lovegrove & Simcoe (2011) and by Adelberger et al. (2005), albeit with large uncertainties due to a small sample size.
3.2 Random velocity offsets between galaxies and absorbers
Random velocity offsets between absorbing gas and the systemic motion of the absorbing galaxy can in principle result in a suppressed absorption signal in stacked spectra (e.g. Ellison et al. 2000). If this is a dominant effect, then the measurements of Bordoloi et al. (2011) and Steidel et al. (2010) should be treated as lower limits.
The velocity separation between galaxies and absorbers identified along QSO lines of sight is well characterized by a Gaussian distribution function (e.g. Lanzetta et al. 1997; Chen et al. 2010a). Specifically, the velocity dispersion between Mg II absorbers and their absorbing galaxies is found to be km s-1 (Chen et al. 2010a). To assess the magnitude of such systematic bias, I perform a Monte Carlo simulation that creates stacks of 50 to 100 individual mocked absorption spectra with a spectral resolution of km s-1 (comparable to the spectral quality for the high-redshift CGM studies) and varying from to . A synthetic absorption feature is randomly placed in each mocked spectrum following a Gaussian distribution function around a fiducial position. I experiment with different widths of the Gaussian distribution function, ranging from to km s-1 and measure the absorption equivalent widths in the stacked spectra. The results of the Monte Carlo simulation study shows that for 0.1-Å absorbers one can recover the full absorption equivalent width at km s-1. At km s-1, the absorption equivalent width may be underestimated by %. Given that the velocity dispersion between galaxies and their absorbers is less than 200 km s-1, I find it unlikely that the absorption equivalent width measurements in stacked spectra are significantly underestimated due to random velocity offsets between gas and galaxies.
3.3 The nature of galaxies at different redshifts
The spatial profiles of the CGM absorption shown in Figures 1 through 3 are based on luminosity-normalized projected distances. This is motivated by the expectation that more massive galaxies possess more extended gas (e.g. Mo & Miralda-Escude 1996). Because the observations are calibrated with respect to -type galaxies in different epochs, it is also necessary to examine the intrinsic properties of galaxies at different redshifts before attempting to understand the lack of variation in the observed spatial distributions of absorbers around distant galaxies.
Using an abundance matching approach, several authors have estimated the mean halo mass for galaxies of different luminosity/mass at different epochs (e.g. Zheng et al. 2007; Conroy et al. 2008). At low redshifts, galaxies are found to reside on average in halos based on a luminosity-dependent mapping between galaxies and dark matter halos (Zheng et al. 2007). Likewise, Conroy et al. (2008) found that the majority of spectroscopically identified star-forming galaxies at reside in halos of . Therefore, galaxies appear to reside in halos of comparable mass at these different redshifts.
This conclusion remains if one infers the mean halo mass of these galaxies based on the mean observed stellar masses. At both low and high redshifts, these galaxies are typically found to contain , which leads to a typical dark matter halo mass of (e.g. Conroy & Wechsler 2009; Moster et al. 2010; Behroozi et al. 2010). Together the results of this exercise confirm that the comparisons shown in Figures 1 through 3, after the normalization to galaxies, are for halos of comparable mass and therefore support the conclusion that the spatial extent and mean absorption strength of the CGM in halos of comparable mass have changed little since .
3.4 Implications
The consistent spatial profiles of different species in the CGM from to are difficult to interpret, whether the observed absorbers originate in starburst driven outflows (e.g. Martin & Bouché 2009; Weiner et al. 2009; Rubin et al. 2010) or in infalling clouds (e.g. Heitsch & Putman 2009). In particular, galaxies at are seen actively forming stars and super galactic winds may be effective in replenishing the CGM with metal-enriched gas (e.g. Murray et al. 2011). In contrast, galaxies at are more quiescent with a diverse star formation history and super galactic winds are not expected to be the primary explanation for the high incidence and covering fraction of metal-enriched, cool halo gas out to 100 kpc.
At the same time, the intergalactic ultraviolet radiation field has declined by more than a factor of ten from to . Cool clouds are expected to form at larger galactic distances at lower redshifts (e.g. Mo & Miralda-Escude 1996). If the observed absorbers originate in infalling cool clouds, then the spatial profile is expected to be more extended at lower redshift, which also disagrees with the trend shown in § 2.
In summary, comparisons between different absorption-line surveys conducted in the vicinities of galaxies at different redshifts have revealed a puzzling finding. Despite very different star formation properties of the galaxies considered in these separate studies and different intergalactic radiation fields at redshifts between and , the spatial extent and mean absorption strength of the CGM around galaxies of comparable mass appear to be unchanged over this cosmic time interval. The observed lack of variation in the CGM properties at different redshifts provides a critical test of theoretical models of gas flows around galaxies.
Acknowledgments
It is a pleasure to thank Nick Gnedin, Sean Johnson, Andrey Kravtsov, Lynn Matthews, and Michael Rauch for important discussions. I thank Sean Johnson, Lynn Matthews and Michael Rauch for helpful comments on an earlier version of this paper.
References
- [1] Adelberger, K. L., & Steidel, C. C. 2000, ApJ, 544, 218
- [2] Adelberger, K. L., Shapley, A. E., Steidel, C. C., Pettini, M., Erb, D. K., & Reddy, N. A. 2005, ApJ, 629, 636
- [3] Barton, E. J. & Cooke, J. 2009, AJ, 138, 1817
- [4] Behroozi, P. S., Conroy, C., & Wechsler, R. H. 2010, ApJ, 717, 379
- [5] Blackburne, J. A., Kochanek, C. S., Chen, B., Dai, X., & Chartas, G. 2012, ApJ submitted (arXiv:1112.0027)
- [6] Bordoloi, R. et al. 2011, ApJ, 743, 10
- [7] Bowen, D. V., Blades, J. C., & Pettini, M. 1995, ApJ, 448, 634
- [8] Ceverino, D. & Klypin, A. 2009, ApJ, 695, 292
- [9] Chen, H.-W., Lanzetta, K. M., Webb, J. K., & Barcons, X. 1998, ApJ, 498, 77
- [10] Chen, H.-W., Lanzetta, K. M., Webb, J. K., & Barcons, X. 2001a, ApJ, 559, 654
- [11] Chen, H.-W., Lanzetta, K. M., & Webb, J. K. 2001b, ApJ, 556, 158
- [12] Chen, H.-W. & Tinker, J. L. 2008, ApJ, 687, 745
- [13] Chen, H.-W. & Mulchaey, J. S. 2009, ApJ, 701, 1219
- [14] Chen, H.-W., Helsby, J. E., Gauthier, J.R., Shectman, S. A., Thompson, I.B., & Tinker, J. L. 2010a, ApJ, 714,1521
- [15] Chen, H.-W., Wild, V., Tinker, J. L., Gauthier, J.-R., Helsby, J. E., Shectman, S. A., & Thompson, I. B. 2010b, ApJ, 724, L176
- [16] Churchill, C. W., Mellon, R. R., Charlton, J. C., Jannuzi, B. T., Kirhakos, S., Steidel, C. C., & Schneider, D. P. 2000, ApJS, 130, 91
- [17] Conroy, C., Shapley, A. E., Tinker, J. L., Santos, M. R., & Lemson, G. 2008, ApJ, 679, 1192
- [18] Conroy, C. & Wechsler, R. H. 2009, ApJ, 696, 620
- [19] Ellison, S. L., Songaila, A., Schaye, J., & Pettini, M. 2000, AJ, 120, 1175
- [20] Erb, D. K., Shapley, A. E., Steidel, C. C., Pettini, M., Adelberger, K. L., Hunt, M. P., Moorwood, A, F. M., & Cuby, J.-G. 2003, ApJ, 591, 101
- [21] Faber, S. M., Willmer, C. N. A., Wolf, C. et al. 2007, ApJ, 665, 265
- [22] Ganguly, R., Sembach, K. R., Tripp, T. M., & Savage, B. D. 2005, ApJS, 157, 251
- [23] Gauthier, J.-R., Chen, H.-W., & Tinker, J. L. 2010, ApJ, 716, 1263
- [24] Gauthier, J.-R. & Chen, H.-W., 2011, MNRAS, 418, 2730
- [25] Haardt, F. & Madau, P. 2012, ApJ, 746, 125
- [26] Heitsch, F. & Putman, M. E., 2009, ApJ, 698, 1485
- [27] Kacprzak, G. G., Churchill, C. W., Steidel, C. C., & Murphy, M. T. 2008, AJ, 135, 922
- [28] Lanzetta, K. M., Bowen, D. V., Tytler, D., & Webb, J. K. 1995, ApJ, 442, 538
- [29] Lanzetta, K. M., Webb, J. K., & Barcons, X. 1997, in Proc. 13th IAP Colloq., Structure and Evolution of the Intergalactic Medium from QSO Absorption Line Systems, ed. P. Petitjean & S. Charlot (Paris: Editions Fronti res), 213
- [30] Law, D. R., Steidel, C. C., Erb, D. K., Pettini, M., Reddy, N. A., Shapley, A. E., Adelberger, K. L., & Simenc, D. J. 2007, ApJ, 656, 1
- [31] Lilly, S. J., Le Fèvre, O., Renzini, A., et al. 2007, ApJS, 172, 70
- [32] Lovegrove, E. & Simcoe, R. A. 2011, ApJ, 740, 30
- [33] Martin, C. L., & Bouché, N. 2009, ApJ, 703, 1394
- [34] Moster, B. P., Somerville, R. S., Maulbertsch, C., van den Bosch, F. C., Macciò, A. V., Naab, T., & Oser, L. 2010, ApJ, 710, 903
- [35] Murray, N., Ménard, B., & Thompson, T. A. 2011, ApJ, 735, 66
- [36] Newman, J., Cooper, M. C., Davis, M. et al. 2012, submitted to ApJS (arXiv:1203.3192)
- [37] Ouchi, M., Mobasher, B., Shimasaku, K. et al. 2009, ApJ, 706, 1136
- [38] Petitjean, P. & Bergeron, J. 1990, A&A, 231, 309
- [39] Prochaska, J. X., Weiner, B., Chen, H.-W., Mulchaey, J., & Cooksey, K. 2011, ApJ, 740, 91
- [40] Prochter, G. E., Prochaska, J. X., & Burles, S. M. 2006, ApJ, 639, 766
- [41] Reddy, N. A., & Steidel, C. C. 2009, ApJ, 692, 778
- [42] Rubin, K. H. et al. 2010, ApJ, 719, 1503
- [43] Scoville, N., Aussel, H., Brusa, M., et al. 2007, ApJS, 172, 1
- [44] Sembach, K. R. & Savage, B. D. 1996, ApJ, 457, 211
- [45] Shapley, A. E., Steidel, C. C., Pettini, M., & Adelberger, K. L. 2003, ApJ, 588, 65
- [46] Shapley, A. E., Steidel, C. C., Erb, D. K., Reddy, N. A., Adelberger, K. L., Pettini, M., Marmby, P., & Huang, J. 2005, ApJ, 626, 698
- [47] Simcoe, R. A., Sargent, W. L. W., Rauch, M., & Becker, G. 2006, ApJ, 637, 648
- [48] Steidel, C. C., Kollmeier, J. A., Shapley, A. E., Churchill, C. W., Dickinson, M., & Pettini, M. 2002, ApJ, 570, 526
- [49] Steidel, C. C., Shapley, A. E., Pettini, M., Adelberger, K. L., Erb, D. K., Reddy, N. A., & Hunt, M. P. 2004, ApJ, 604, 534
- [50] Steidel, C. C., Erb, D. K., Shapley, A. E., Pettini, M., Reddy, N., Bogosavljević, M., Rudie, G. C., & Rakic, O. 2010, ApJ, 717, 289
- [51] Tinker, J. L. & Chen, H.-W. 2008, ApJ, 679, 1218
- [52] Tripp, T. M., Lu, Limin, & Savage, B. D. 1998, ApJ, 508, 200
- [53] Tumlinson, J., Thom, C., Werk, J. K. et al. 2011, Science, 334, 948
- [54] Weiner, B. J. et al. 2009, ApJ, 692, 187
- [55] Zheng, Z., Coil, A. L., & Zehavi, I. 2007, ApJ, 667, 760