Chandra and HST Observations of the Supersoft ULX in NGC 247: Candidate for Standard Disk Emission
Abstract
We report on multiwavelength observations of the supersoft ultraluminous X-ray source (ULX) in NGC 247 made with the Chandra X-ray Observatory and Hubble Space Telescope (HST). We aligned the X-ray and optical images using three objects present on both and identified a unique, point-like optical counterpart to the ULX. The X-ray to optical spectrum is well fitted with an irradiated disk model if the extinction measured for Cepheids in NGC 247 is used. Assuming only Galactic extinction, then the spectrum can be modeled as a standard thin accretion disk. Either result leads to the conclusion that a disk interpretation of the X-ray spectrum is valid, thus the source may be in the X-ray thermal state and contain an intermediate mass black hole of at least 600 . In contrast to other supersoft ULXs which are transient and exhibit a luminosity temperature relation inconsistent with a disk interpretation of the X-ray emission, the NGC 247 ULX has a relatively steady flux and all available X-ray data are consistent with emission from a disk in the thermal state.
Subject headings:
accretion, accretion disks – black hole physics – galaxies: individual (NGC 247) – X-ray: binaries1. Introduction
Ultraluminous X-ray sources (ULXs) are off-nuclear accreting black holes (BHs) with isotropic luminosities well above the classical Eddington limit of normal stellar mass BHs. Powering such high apparent luminosities requires accretion onto either ordinary stellar mass BHs () with strong beaming and/or super-Eddington luminosities, massive stellar BHs () with mild beaming and/or near Eddington luminosities, or intermediate mass BHs (IMBHs; ). An IMBH with quasi-isotropic sub-Eddington radiation is the preferred explanation for at least two ULXs (Feng & Kaaret, 2010; Servillat et al., 2011). Thus, ULXs play a key role in the study of physics under extreme accretion, and comprise a promising population for the search for IMBHs which are important for the study of stellar evolution and the formation of supermassive black holes. Please see Feng & Soria (2011) for a recent review.
Great interest has been focused on a subclass of ULXs that exhibit supersoft spectra and dramatic flux variability from erg s-1 up to nearly erg s-1. Their X-ray spectra are dominated by photons below 2 keV, and the soft emission component is thermal-like with a temperature of around 0.1 keV. Due to their high peak luminosity and chaotic variability, they differ from canonical supersoft sources which could be nuclear-burning white dwarfs or X-ray supernova remnants (van den Heuvel et al., 1992; Immler & Lewin, 2003). There is no clear physical interpretation of supersoft ULXs. Either stellar mass BHs viewed at high inclination or IMBHs with cool disks (like in the thermal state) could account for some, but not all, of the observational facts.
Typical supersoft ULXs that have been described in detail include Antennae X-13 (Fabbiano et al., 2003), M101 ULX-1 (Pence et al., 2001; Kong & Di Stefano, 2005; Mukai et al., 2005), M81 ULS1 (Swartz et al., 2002; Liu, 2008), NGC 4631 X1 (Carpano et al., 2007; Soria & Ghosh, 2009), and NGC 247 ULX (Jin et al., 2011). The flux versus temperature relation of supersoft ULXs is the strongest argument against the IMBH scenario, as the supersoft ULXs show a nearly constant temperature while the flux varies by up to a factor of . This is strongly inconsistent with the observed properties of accretion flows around Galactic BH binaries. Specifically, it is inconsistent with the relation expected when the emitting surface area is fixed as expected for an accretion disk terminating at the innermost stable circular orbit. NGC 247 ULX is unusual amongst the supersoft ULXs: it has never been observed in a low flux state – the observed X-ray flux has varied by no more than a factor of 3 in the 0.1–2 keV band in the available observations (Jin et al., 2011). Thus, NGC 247 ULX is a candidate IMBH and worth deep investigation, particularly on its multiwavelength emission, which has been found useful to constrain binary evolution and overall disk modeling.
The NGC 247 ULX showed an unabsorbed luminosity in the 0.3–10 keV band reaching up to erg s-1 and clear variability in both short and long timescales (Winter et al., 2006; Jin et al., 2011). The dominant component in its emission spectrum can be described by a blackbody spectrum with a temperature of about 0.1 keV (Read et al., 1997; Winter et al., 2006; Jin et al., 2011). In the 2009 XMM-Newton observation, which was so far the deepest one for the object, a weak but significant power-law component with a photon index around 2.5 was detected above 2 keV and an absorption feature around 1 keV was necessary to adequately fit the spectrum (Jin et al., 2011).
We obtained a Chandra observation to precisely determine the ULX X-ray position and HST imaging with a few filters to identify its optical counterpart and measure color and magnitude information. The observations and results are described in Section 2 and discussion of the physical interpretation is presented in Section 3. A distance of 3.4 Mpc (Gieren et al., 2009) to NGC 247 is adopted in the paper.
2. Observations, Analyses, and Results
2.1. Observations
The Chandra observation (ObsID 12437; PI: H. Feng) was made on 2011 February 1 with an exposure of 5 ks. The focal plane instrument was the Advanced CCD Imaging Spectrometer (ACIS). About 5′ to the north west of NGC 247 ULX lies a known background quasi-stellar object (QSO) PHL 6625, which was proposed as a reference object to align the Chandra and HST images, following the successful use of this technique to identify the optical counterpart of IC 342 X-1 (Feng & Kaaret, 2008). The Chandra telescope was pointed at the mid-point of the ULX and QSO and an offset of 1.1′ was applied to the detector position so that the aimpoint fell toward the center of ACIS-S3 and both sources were imaged on the same chip.
The Advanced Camera for Surveys (ACS) with the Wide Field Channel (WFC) was adopted for the HST observations (Proposal ID 12375; PI: H. Feng) which were made on 2011 October 11 in two orbits. The field of view of ACS WFC is not large enough to cover both the ULX and QSO. Two exposures with an overlapped region were used to create a mosaic image. The F606W filter was selected because the archive contained images of nearby regions in this filter that could be used to expand the mosaic. Exposures with the F435W and F658N filters were also taken around the ULX. All observations are listed in Table 1.
| ObsID | Date | Instrument | Exp. | |
|---|---|---|---|---|
| (s) | ||||
| Chandra | 12437 | 2011-02-01 | ACIS-S | 4988 |
| j9ra77020 | 2006-09-20 | ACS/WFC/F606W | 1507 | |
| j9ra78020 | 2006-09-21 | ACS/WFC/F606W | 1507 | |
| HST | jblm01020⋆ | 2011-10-11 | ACS/WFC/F435W | 904 |
| jblm01030⋆ | 2011-10-11 | ACS/WFC/F606W | 846 | |
| jblma1010 | 2011-10-11 | ACS/WFC/F606W | 846 | |
| jblm01010⋆ | 2011-10-11 | ACS/WFC/F658N | 1200 |
Note. — ⋆that contains the ULX.
2.2. Data reduction
With CIAO 4.4 and CALDB 4.4.7, a new level 2 events file was created for the Chandra observation using the chandra_repro script. Source detection was done with the wavdetect tool on the 0.3–8 keV image. 172 net photons were detected from the ULX. Its X-ray spectral shape and flux, though not well constrained, are consistent with those measured with the 2009 XMM-Newton observation.
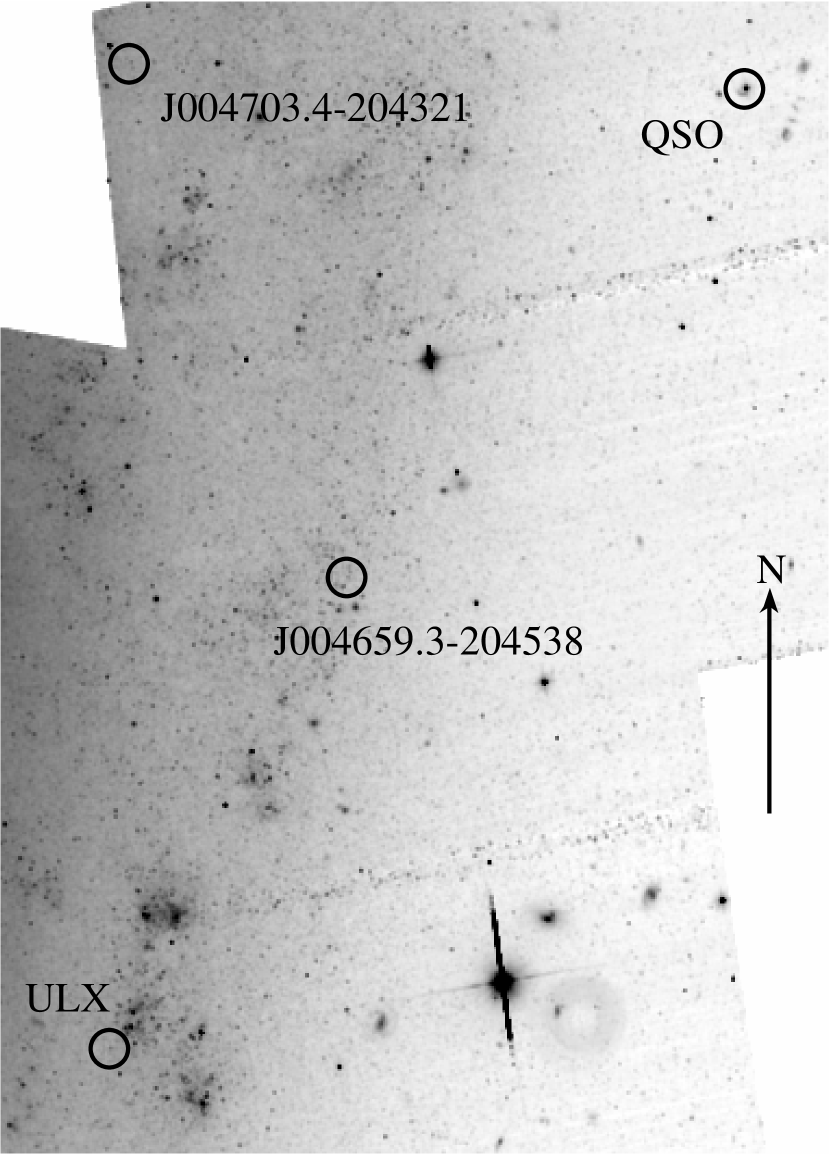
For HST observations, the flat-fielded (_flt) images delivered from the standard pipeline were adopted for data reduction. The cosmic ray flags in the data quality array were removed to avoid leaking into the final drizzled image if there is an overlap. Except for the two observations in 2006 from the archive, the bias striping noise was removed using acs_destripe and correction to the charge transfer efficiency was done using PixCteCorr. Then, drizzled images were created using the multidrizzle task, in which cosmic ray removal was executed. For the four F606W images, their relative transformations were calculated with the geomap task using objects in the overlapped region found by daofind and xyxymatch. The multidrizzle task was used to create the mosaic image that is shown in Figure 1, which was aligned to the Two Micron All Sky Survey (2MASS; Skrutskie et al., 2006) grid for better absolute astrometry.
2.3. Astrometry and optical identification
| Source | R.A. | decl. | err | |
|---|---|---|---|---|
| (J2000.0) | (J2000.0) | (″) | ||
| QSO | X | 00 46 51.823 | 20 43 28.30 | 0.104 |
| X′ | 00 46 51.810 | 20 43 28.36 | ||
| O | 00 46 51.811 | 20 43 28.38 | ||
| J004659.3204538 | X | 00 46 59.376 | 20 45 38.49 | 0.219 |
| X′ | 00 46 59.370 | 20 45 38.63 | ||
| O | 00 46 59.368 | 20 45 38.63 | ||
| J004703.4204321 | X | 00 47 03.508 | 20 43 21.63 | 0.308 |
| X′ | 00 47 03.489 | 20 43 21.50 | ||
| O | 00 47 03.490 | 20 43 21.48 | ||
| ULX | X | 00 47 03.882 | 20 47 44.04 | 0.074 |
| X′ | 00 47 03.883 | 20 47 44.30 | 0.17 | |
| O | 00 47 03.884 | 20 47 44.23 |
Note. — X – original Chandra position derived from wavdetect; X′ – corrected X-ray position by alignment with the three reference objects; O – position of the optical counterpart on the mosaic F606W image. The error radius is quoted at 90% confidence, converted from 68% intervals at 1-dimension assuming Rayleigh distribution.
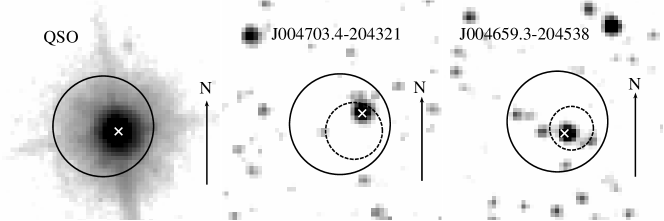
Alignment of the Chandra and HST images was performed in two steps. First, the background QSO was used to register the two images. The relative shift can be corrected in this way but scale and rotation errors remain. Besides the ULX and QSO, there were 5 X-ray sources detected in the field of the mosaic image. Two of them with a significance over 5 have a unique optical source within 0.6″, which are XMMU J004659.3204538 and XMMU J004703.4204321 (Jin et al., 2011). Taking into account of the scale and rotation uncertainties of Chandra images111http://cxc.harvard.edu/cal/Hrma/PlateScale.html, which are typically 0.0001″/pixel and , respectively, at the 68% confidence level, we identified unique optical counterparts. These are shown in Figure 2, where the solid circles indicate the Chandra original positions with an absolute uncertainty of 0.6″ and the dashed circles represent the corrected positions with error circles after alignment using the QSO.
Then, the QSO, J004659.3204538, and J004703.4–204321 were employed as reference objects to further align the images, which allowed us to fit the relative shift, scale, and rotation between the two images. Using the geomap tool, fitting the transformation resulted in a root-mean-square of 0.02″, indicative of adequate fitting. The new relative position error for the ULX is mainly from statistical errors on the X-ray positions of the reference sources, which were added quadratically. The systematic error due to the asymmetry of the point spread function (PSF) is insignificant according to simulation with MARX. The relative position error of the ULX after alignment is 0.17″, leading to a unique identification in optical. All positions and uncertainties are listed in Table 2.
2.4. HST Photometry
| Band | |||
|---|---|---|---|
| F435W | |||
| F606W | |||
| F658N | |||
Note. — is the observed flux in units of erg cm-2 s-1 Å-1; The magnitudes have Vega zeropoints and are extinction corrected assuming different values. is the two-point power-law index () between F435W and F606W.
For the ULX, aperture photometry was performed on each image using the IRAF package APPHOT. The calcphot task in the SYNPHOT package was used for aperture correction and flux conversion. The Galactic extinction along the direction of NGC 247, estimated from the COBE dust map (Schlegel et al., 1998), is mag, which is a lower limit. Gieren et al. (2009) reported a mean extinction of in NGC 247 via the optical Cepheids studies, indicative of significant extinction within the host galaxy. The values derived from two Cepheids (cep008 and cep018) near the ULX region are 0.17 and 0.22, respectively, close to the mean value. The X-ray neutral hydrogen column density of the ULX was found to be around cm-2 (Jin et al., 2011). Following the correlation between and extinction (Predehl & Schmitt, 1995), we obtained assuming . Usually, the extinction derived from X-ray absorption is an overestimate and should be regarded as an upper limit. For the ULX, an extinction of is too high to be physical as it leads to an optical spectrum steeper than the Rayleigh-Jeans law (). Thus, we only consider the extinctions and 0.18 in the following. The observed flux density, extinction corrected magnitudes in the observed bands and the standard Johnson and bands, which moderately match the F435W and F606W throughputs, respectively, are listed in Table 3.
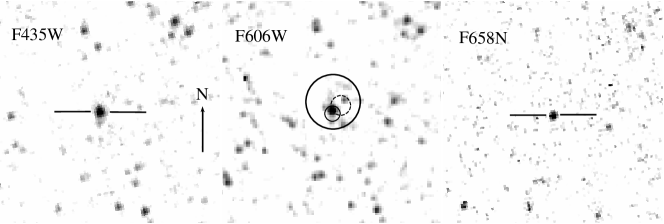
In the F658N filter, which is a narrow band including the H and [N ii] lines, the observed flux density is erg cm-2 s-1 Å-1. Flux from the F606W filter, with a band that contains the F658N band, was used to estimate the continuum contribution in the narrow band. Assuming the continuum has a power-law spectrum fitting the F435W and F606W fluxes, we estimate that the continuum contributed erg cm-2 s-1 Å-1 in the F658N band. This suggests that no H line flux is detected. We note there is no nebulosity around the ULX apparent in the F658N image.
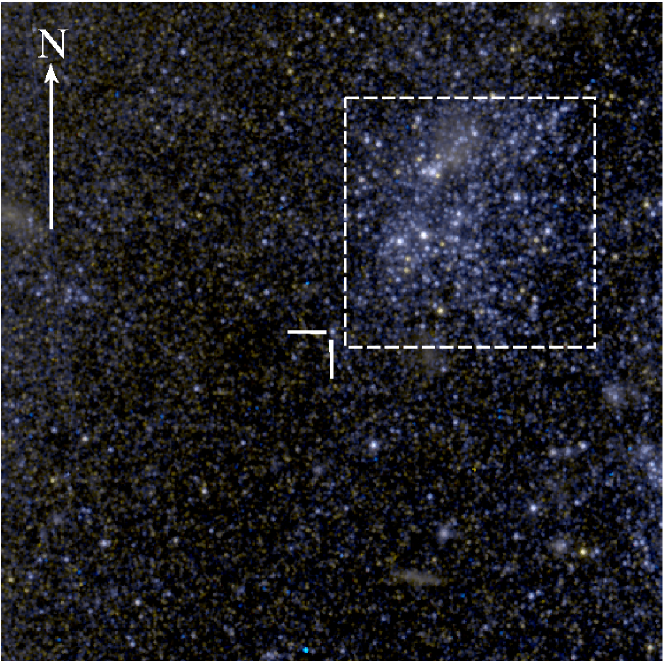
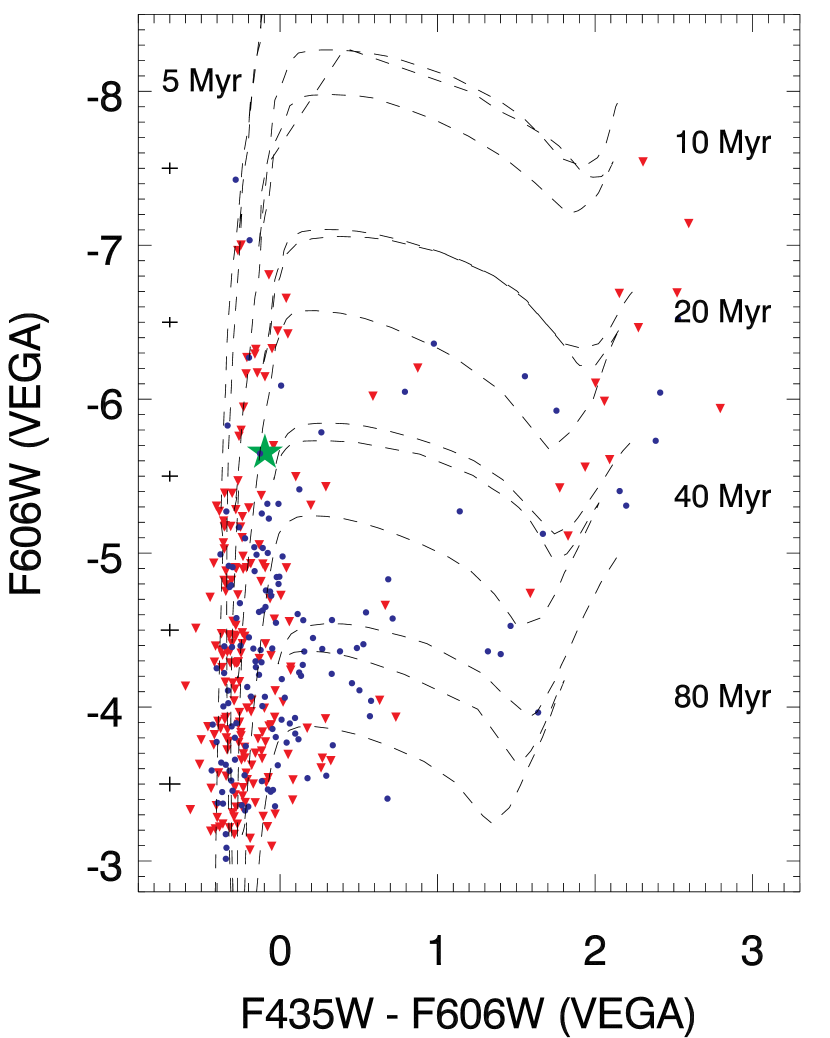
Figure 3 shows a color composite image around the region of NGC 247 ULX, produced using the F435W and F606W images. The ULX appears near a loose stellar association with a size of (). We performed PSF photometry for stars within a -radius stellar field around NGC 247 ULX. Objects with flux below 10 times sky deviation or with during PSF fits are excluded. Then, applying Vega zero points, the dereddened magnitude are calculated assuming and plotted in the the color magnitude diagram (CMD), see Figure 4. Typical errors are 0.04 for the magnitudes and 0.06 for the colors in the range . No spectroscopic metallicity has been reported for NGC 247. Following Davidge (2006), we adopt based on the integrated brightness of the galaxy and CMD analysis. The isochrones222http://stev.oapd.inaf.it/cgi-bin/cmd of 5, 10, 20, 40, and 80 Myr (Marigo et al., 2008; Girardi et al., 2010) are also shown in Figure 4. Stars in either the association or in the field show a continual star formation history to the present date, but most bright stars in the association have ages consistent with 10–20 Myr. The field stars are, in general, slightly dimmer and older than those in the association.
2.5. Multiwavelength modeling
| Model | |||||||||||
|---|---|---|---|---|---|---|---|---|---|---|---|
| 1 | 36.8/40 | ||||||||||
| 2 | 39.0/40 | ||||||||||
| 3 | 36.6/40 |
Note. — Model 1: wabs edge (diskbb + powerlaw); Model 2: wabs edge (bbodyrad + powerlaw); Model 3: redden wabs edge diskir. is the X-ray absorption column density in ; is the absorption edge in keV; is the optical depth; is the temperature of the thermal component in keV; is the inner radius in km; is the inclination angle; is the power-law photon index; is the power-law normalization at 1 keV in photons keV-1cm-2s-1; is the fraction of bolometric luminosity thermalized in the outer disk; and are respectively the outer and inner disk radius; is the ratio of flux between the Compton component and the un-illuminated disk. All errors and limits are at 90% confidence level. Model 1 & 2 are quoted from Jin et al. (2011).
No simultaneous X-ray and optical observations are available for the ULX. In order to evaluate the X-ray to optical flux ratio, we estimated the X-ray flux range from two XMM-Newton observations (Jin et al., 2011). is defined as , where is the observed X-ray flux in the 0.3-3.5 keV band in and is the observed visual magnitude (Maccacaro et al., 1982). We adopted erg cm-2 s-1 and and obtained , which is larger than that of active galactic nuclei, clusters of galaxies, normal galaxies and normal stars, and is marginally consistent with the value for BL Lac objects. A blazar nature can ruled out for this source due to its supersoft spectrum. Therefore, NGC 247 ULX is most likely an X-ray binary (Maccacaro et al., 1988; Stocke et al., 1991).
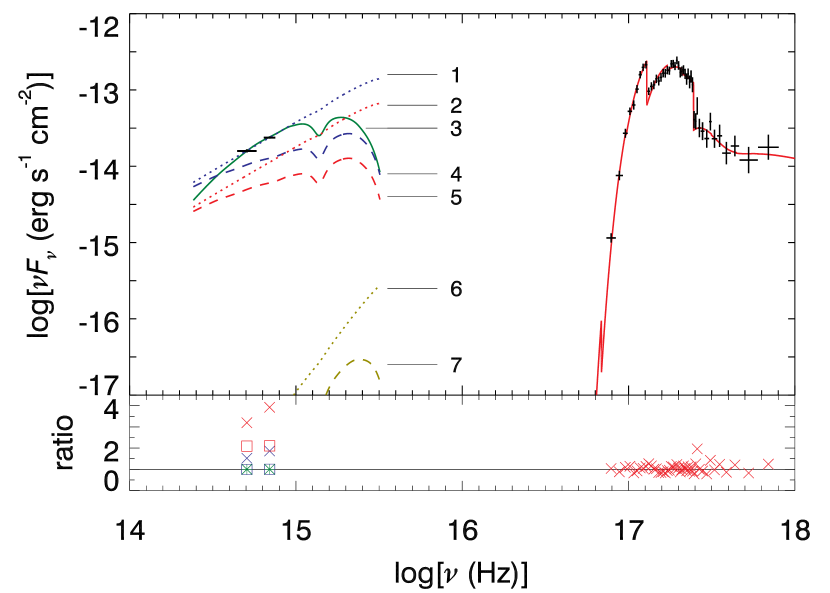
The X-ray spectrum of the ULX can be decomposed into two components, a dominant soft thermal component (either blackbody or disk blackbody) with a temperature about 0.1 keV plus a weak hard power-law component (Jin et al., 2011), see Table 4. The mono-temperature blackbody component underestimates the optical flux by 4 orders of magnitude, as shown in Figure 5. In contrast, the optical flux extrapolated from the disk blackbody model is consistent with or close to the observations, depending on the assumed extinction. For the 2001 XMM-Newton observation, the predicted optical flux is fully consistent with that observed assuming and is 1.5–2 times lower than observed assuming . The discrepancy is 2 times larger for the 2009 XMM-Newton observation. The two-point power-law index between the F435W and F606W bands is assuming and assuming , see Table 3. For the standard accretion disk model, the apparent power-law index in the intermediate band (i.e. the optical band for this case) is 1/3. Thus, with the assumption of Galactic extinction, both the optical flux and spectral shape are consistent with that predicted for the disk model. For an extinction of , the inconsistent flux could be explained by variability, however, the spectral index would be significantly higher than 1/3 and difficult to explain with a standard disk model.
Assuming , we attempted to fit the X-ray and optical data with a Comptonized, irradiated disk model (diskir; Gierliński et al., 2009), which has been applied successfully to several ULXs, e.g. NGC 5408 X-1, Holmberg II X-1 and HLX-1 (Kaaret & Corbel, 2009; Grisé et al., 2012; Tao et al., 2012; Soria et al., 2012). The 2009 XMM-Newton observation was adopted, which was the only one with sufficient statistics for detection of the Compton tail (Jin et al., 2011), and the spectrum was extracted and grouped following Jin et al. (2011). Besides a soft thermal component and a Compoton tail, an absorption feature near 1 keV, close to the highly ionized Fe-L edge, was added to achieve an adequate fit. The feature may be due to highly ionized accretion disk winds that are found ubiquitously in the soft state of Galactic BHs (Ponti et al., 2012). The XMM-Newton spectrum and the two optical data points were fitted to a diskir plus edge model subject to interstellar absorption using the chi square statistics. The multiband fitting parameters are listed in Table 4 (Model 3) along with X-ray fitting parameters (Model 1 & 2) quoted from Jin et al. (2011). The parameters of interest are those affecting the optical emission, including the fraction of bolometric flux thermalized in the outer disk () and the ratio of outer to inner disk radii (). Scaling the X-ray luminosity to the normalization derived from the 2001 XMM-Newton observation, becomes by fixing at 3.2 (otherwise the parameters are poorly constrained). We conclude that for an extinction of , as suggested by observations of Cepheids in the host galaxy, X-ray irradiation in the outer disk is able to produce both the high optical flux and steep optical spectral slope.
3. Discussion
The Chandra and HST images were properly aligned using three objects present on both, leading to a relative position error slightly less than 0.2″. This enables a unique identification of the optical counterpart of NGC 247 ULX as a point-like source lying near a loose stellar association. While most stars in the association brighter than the ULX counterpart have ages of 10–20 Myr (Figure 4), a few of them are consistent with younger (5 Myr) or older (40 Myr) populations. This suggests that the association may have undergone continual star formation and be composed of OB associations formed at different epochs.
The most likely extinction to stars in the nearby stellar field, as described in Section 2.4, is close to the value derived from Cepheids in the host galaxy, . Because NGC 247 is a nearly face-on galaxy, we have no constraint on the location of the ULX with respect to the disk plane. In the Milky Way, most HMXBs are found in the Galactic plane while LMXBs tend to be widely distributed in the halo. If the source is in front of the disk plane, a Galactic extinction of is likely. The X-ray extinction () is ruled out by the physical constraint that no thermal spectrum can be steeper than the Rayleigh-Jeans law.
The source appears like a B8–A5 Ib supergiant assuming , or a B1–B7 Ib assuming . However, the apparent colors and magnitudes should not be used for classification of the companion star, as the optical light from ULXs could be dominated by emission on the accretion disk (Kaaret, 2005; Tao et al., 2011; Grisé et al., 2011).
A single temperature blackbody model fits the X-ray data well, and could be interpreted as emission from the photosphere of a massive outflow associated with super-Eddington accretion that shadows the inner disk and also the hard X-rays if viewed at high inclination angle. However, this model underestimates the optical flux by 4 orders of magnitude. Thus, in this scenario, the optical and X-ray emission must be due to different mechanisms. A disk with the inner part obscured or truncated, or the companion star, could be the origin of the optical emission. Future spectroscopic observations may be able to distinguish these two possibilities.
A disk blackbody model, in contrast, reasonably accounts for both the X-ray and optical observations. If one considers only the Galactic extinction, which implies that the source is nearer to us than the disk plane of NGC 247, then both the observed fluxes and spectral index in the optical band are fully consistent with the standard disk model extrapolated from the 2001 XMM-Newton observation. These suggest that we may have seen a pure (or dominant) standard thin accretion disk that extends from optical to X-rays, across a radial range of 3 orders of magnitudes, with little if any irradiation.
If this is the nature of the optical emission, it suggests the presence of an IMBH, and the outer disk radius needs be at least 300 times the inner radius in order to have an optical spectrum unbroken at the F606W band. Based on the disk blackbody model (Table 4 Model 1), the disk inner radius is derived to be km assuming a face-on disk, corresponding to a BH mass of using the Schwarzschild metric. This suggests that the ULX was accreting at 4% of the Eddington limit during the 2009 XMM-Newton observation, or 10% during the 2001 XMM-Newton observation, typical of accretion rates for Galactic black holes in the thermal state (Gierliński & Done, 2004). Future optical and infrared observations are important to test such a scenario. In particular, simultaneous X-ray and optical observations would provide a strong test of the model and photometry or spectroscopy in the near-infrared band would be useful to determine the size of the accretion disk.
Adopting the higher extinction as measured for Cepheids in the host galaxy, the observed optical flux is a few times higher than extrapolation of the disk model, which can be regarded as being consistent with the degree of X-ray variability, since the Einstein, ROSAT, XMM-Newton, and Chandra observations show an apparent flux change by a factor of 3 in the 0.1-2 keV range. However, the two-point spectral index is no longer consistent with that predicted for the standard thin disk. Thus, disk irradiation is needed to account for the excess optical emission.
It is interesting to compare the results obtained for the irradiated disk model with those derived for NGC 5408 X-1, which is the ULX with the most detailed simultaneous X-ray and optical observations available (Grisé et al., 2012). The disk contribution is one of the highest among ULXs and its optical flux is about 3–8 times higher than predicted for the disk model in the band. The luminosity fraction of the Comptonization component in NGC 5408 X-1 ranges around 0.4–0.7, consistent with the identification of the steep power-law state. Despite the large errors, the excess optical flux above the intrinsic disk emission, proportional to , was found to scale with the luminosity fraction of the Compton tail in the X-ray band (Table 4 in Grisé et al., 2012), similar to the results found for the Galactic BH binary XTE J1817330 while in the same state (Figure 8 in Gierliński et al., 2009). For NGC 247 ULX, its Compton tail fraction is less than 0.1, consistent with in the thermal state. The inferred fractional luminosity thermalized in the outer disk, if the 2001 XMM-Newton observation is adopted, is consistent with values found in the thermal state of XTE J1817330 (Gierliński et al., 2009). In sum, both the X-ray and multiband modeling suggests that NGC 5408 X-1 is likely in the steep power-law state while NGC 247 ULX is in the thermal state.
Thus, we conclude that NGC 247 ULX shows no disk irradiation if there is only Galactic extinction, and some irradiation if there is extinction within the host galaxy. In both cases, a disk interpretation of the X-ray data and identification of the source as being in the X-ray thermal state are valid.
As mentioned in the introduction, the strong argument against a thermal disk interpretation of supersoft ULXs is their transient behavior. In Galactic black hole binaries, the disk temperature, geometry, density, optical depth, and the emergent spectral shape will vary dramatically along with a flux change up to a factor of . However, the measured temperature is similar for supersoft ULXs in their low and high states. In other words, they appear to be supersoft no matter how the flux changes. In contrast, NGC 247 ULX is never found in the low state. It has been observed 8 times: with Einstein (1), ROSAT (4), XMM-Newton (2), and Chandra (1). The measured X-ray flux in the 0.1–2 keV band varied only over a factor of 3 in these observations. In Table 5, we list the number of low and high states and the ratio of maximum to minimum luminosity for 5 supersoft ULXs that have been extensively studied. The typical luminosity is erg s-1 in the high state and erg s-1 in the low state. The lack of low state in NGC 247 may suggest that it is unlike other supersoft ULXs, and the disk interpretation may still be valid. The only evidence that is potentially inconsistent with a disk interpretation for NGC 247 ULX is that it exhibits strong short-term variability (Jin et al., 2011), although the power spectrum density has the same shape with that seen in the thermal state of BH binaries. It is unkown whether or not the soft state at such a high luminosity has similar timing properties as in stellar mass BH binaries, which usually are at least 10 times dimmer.
Following Gierliński et al. (2009), the effective temperature of the outer irradiated disk can be expressed as
where and is the fraction of Compton emission thermalized in the inner disk, which was fixed to be 0.1 in our fits. Using our best-fit spectral parameters, the outer disk temperature is estimated to be about 13000 K for NGC 247 ULX. This is higher than the Hydrogen ionization temperature of about 6500 K and suggests that the disk is not subject to disk instability (King et al., 1996). This may explain the fact that the ULX has always been observed in the high state for three decades. The derived outer disk radius of cm indicates that the Roche-lobe radius must be at least this large.
To summarize, the HST observations reveal that NGC 247 ULX is a good candidate to be an IMBH with dominant standard disk emission. Future observations from near-UV to near-infrared are needed to test the optical disk spectrum, and repeated X-ray observations of moderate depth are needed to test the relation predicted for the thermal state.
References
- Carpano et al. (2007) Carpano, S., Pollock, A. M. T., King, A. R., Wilms, J., & Ehle, M. 2007, A&A, 471, L55
- Davidge (2006) Davidge, T. J. 2006, ApJ, 641, 822
- Fabbiano et al. (1992) Fabbiano, G., Kim, D.-W., & Trinchieri, G. 1992, ApJS, 80, 531
- Fabbiano et al. (2003) Fabbiano, G., King, A. R., Zezas, A., Ponman, T. J., Rots, A., & Schweizer, F. 2003, ApJ, 591, 843
- Feng & Kaaret (2008) Feng, H., & Kaaret, P. 2008, ApJ, 675, 1067
- Feng & Kaaret (2010) Feng, H., & Kaaret, P. 2010, ApJ, 712, L169
- Feng & Soria (2011) Feng, H., & Soria, R. 2011, New Astron. Rev., 55, 166
- Gieren et al. (2009) Gieren, W., et al. 2009, ApJ, 700, 1141
- Gierliński & Done (2004) Gierliński, M., & Done, C. 2004, MNRAS, 347, 885
- Gierliński et al. (2009) Gierliński, M., Done, C., & Page, K. 2009, MNRAS, 392, 1106
- Girardi et al. (2010) Girardi, L., et al. 2010, ApJ, 724, 1030
- Grisé et al. (2011) Grisé, F., Kaaret, P., Pakull, M. W., & Motch, C. 2011, ApJ, 734, 23
- Grisé et al. (2012) Grisé, F., et al. 2012, ApJ, 745, 123
- Immler & Lewin (2003) Immler, S., & Lewin, W. H. G. 2003, in Supernovae and Gamma-Ray Bursters, ed. K. Weiler (Berlin: Springer-Verlag), 91
- Jin et al. (2011) Jin, J., Feng, H., Kaaret, P., & Zhang, S.-N. 2011, ApJ, 737, 87
- Kaaret (2005) Kaaret, P. 2005, ApJ, 629, 233
- Kaaret & Corbel (2009) Kaaret, P., & Corbel, S. 2009, ApJ, 697, 950
- King et al. (1996) King, A. R., Kolb, U., & Burderi, L. 1996, ApJ, 464, L127
- Kong & Di Stefano (2005) Kong, A. K. H., & Di Stefano, R. 2005, ApJ, 632, L107
- Liu (2008) Liu, J. 2008, ApJS, 177, 181
- Liu (2009) Liu J. F. 2009, ApJ, 704, 1628
- Maccacaro et al. (1982) Maccacaro, T., et al. 1982, ApJ, 253, 504
- Maccacaro et al. (1988) Maccacaro, T., et al. 1988, ApJ, 326, 680
- Makishima et al. (2000) Makishima, K., et al. 2000, ApJ, 535, 632
- Marigo et al. (2008) Marigo, P., Girardi, L., Bressan, A., Groenewegen, M. A. T. Silva, L., & Granato, G. L. 2008, A&A, 482, 883
- Mukai et al. (2005) Mukai, K., Still, M., Gorbet, R. H. D., Kuntz, K. D., & Barnard, R. 2005, ApJ, 634, 1085
- Pence et al. (2001) Pence, W. D., Snowden, S. L., Mukai, K., & Kuntz, K. D. 2001, ApJ, 561, 189
- Ponti et al. (2012) Ponti, G., Fender, R. P., Begelman, M. C., Dunn, R. J. H, Neilsen, J., & Coriat, M. 2012, MNRAS, 422, 11
- Predehl & Schmitt (1995) Predehl, P., & Schmitt, J. H. M. M. 1995, A&A, 293, 889
- Read et al. (1997) Read, A. M., Ponman, T. J., & Strickland, D. K. 1997, MNRAS, 286, 626
- Schlegel et al. (1998) Schlegel, D. J., Finkbeiner, D. P., & Davis, M. 1998, ApJ, 500, 525
- Servillat et al. (2011) Servillat, M., Farrell, S. A., Lin, D., et al. 2011, ApJ, 743, 6
- Skrutskie et al. (2006) Skrutskie, M. F., et al. 2006, AJ, 131, 1163
- Soria & Ghosh (2009) Soria, R., & Ghosh, K. K. 2009, ApJ, 696, 287
- Soria et al. (2012) Soria, R., Hakala, P. J., Hau, G. K. T., Gladstone, J. C., & Kong, A. K. H. 2012, MNRAS, 420, 3599
- Stocke et al. (1991) Stocke, J. T., Morris, S. L., Gioia, I. M., Maccacaro, T., Schild, R., Wolter, A., Fleming, T. A., & Henry, J. P. 1991, ApJS, 76, 813
- Swartz et al. (2002) Swartz, D. A.,Ghosh, K. K., Suleimanov, V.,Tennant, A. F., & Wu, K. 2002, ApJ, 574, 382
- Tao et al. (2011) Tao, L., Feng, H., Grisé, F., & Kaaret, P. 2011, ApJ, 737, 81
- Tao et al. (2012) Tao, L., Kaaret, P., Feng, H., & Grisé, F. 2012, ApJ, 750, 110
- van den Heuvel et al. (1992) van den Heuvel, E. P. J., Bhattacharya, D., Nomoto, K., & Rappaport, S. A. 1992, A&A, 262, 97
- Vogler & Pietsch (1996) Vogler, A., & Pietsch, W. 1996, A&A, 311, 35
- Winter et al. (2006) Winter, L. M., Mushotzky, R. F., & Reynolds, C. S. 2006, ApJ, 649, 730