TENTATIVE DETECTION OF DEUTERATED METHANE TOWARD THE LOW-MASS PROTOSTAR IRAS 04368+2557 IN L1527
Abstract
The millimeter-wave rotational transition line () of deuterated methane CH3D has tentatively been detected toward the low-mass Class 0 protostar IRAS 04368+2557 in L1527 with the Heinrich Hertz Submillimeter Telescope. This is the first detection of CH3D in interstellar clouds, if confirmed. The column density and fractional abundance of CH3D are determined to be cm-2 and , respectively, where we assume the rotational temperature of 25 K. The column density and fractional abundance of the gaseous CH4 are estimated to be cm-2 and , respectively, by adopting the molecular D/H ratios of 2–7 % reported for various molecules in L1527. The fractional abundance of CH4 is higher than or comparable to that found in high-mass star-forming cores by infrared observations. It is sufficiently high for triggering the efficient production of various carbon-chain molecules in a lukewarm region near the protostar, which supports the picture of the warm carbon-chain chemistry.
1 Introduction
Methane (CH4) is the most fundamental hydrocarbon molecule in space, and is thought to play an important role in interstellar chemistry and planetary chemistry. The gas phase CH4 has been identified toward bright infrared sources like high-mass young stellar objects by observing the infrared vibration-rotation spectra of the (C-H stretching: 3 m) and (CH2 bending: 7 m) bands (Lacy et al., 1991; Boogert et al., 2004; Knez et al., 2009). Such observations are also carried out toward comets, planets, and satellites like Titan (e.g. Penteado et al., 2005). Furthermore, CH4 is known as one of the major constituents of icy grain mantles in interstellar clouds. The infrared absorption of the ( m) and ( m) bands have been observed toward various sources including low-mass protostars (e.g. Lacy et al., 1991; berg et al., 2008, 2011). In spite of this progress, our understanding of the distribution and the abundance of CH4 in the gas phase is still limited particularly for cold interstellar medium including low-mass star-forming regions. This is because CH4 has no permanent dipole moment, and does not emit the pure rotational spectral lines which can readily be observed with radio telescopes. Furthermore, the low-mass protostars are not bright enough for high-resolution infrared absorption spectroscopy.
One practical way to overcome this situation is to observe its mono-deuterated species, CH3D, which emits the pure rotational spectral lines due to its small electric dipole moment (0.005657 D) (Wofcy et al., 1970; Watson et al., 1979). However, the past efforts to detect the line (232.6 GHz) of CH3D were not successful even toward Orion-KL (Pickett et al., 1980; Womack et al., 1996). Since active high-mass star-forming regions contain many kinds of saturated complex organic molecules, their contamination make it difficult to detect the line. At that time, it was thought that detection of the CH3D line would be difficult in low-mass star-forming regions because of its relatively low column density in comparison with high-mass star-forming regions.
Recently, it was recognized that CH4 plays a crucial role in chemical processes occurring in low-mass star forming regions. Sakai et al. (2008; 2009a) found low-mass star-forming regions which harbor extremely rich carbon-chain molecules. They are L1527 in Taurus and IRAS15398-3359 in Lupus. According to the interferometric observation toward L1527, carbon-chain molecules and their related species show a steep increase in abundance inward of 500–1000 AU (Sakai et al., 2010), where the gas kinetic temperature is higher than 20 K (Shirley et al., 2002; Jrgensen et al., 2002). Furthermore, they reside even in the gas infalling to the protostar. In order to explain the observational results, it is proposed that carbon-chain molecules are regenerated near the protostar triggered by evaporation of the solid CH4 on dust grains (Warm Carbon Chain Chemistry: WCCC) (Sakai et al., 2008). The desorption temperature of CH4 is about 25 K (Collings et al., 2004), which is lower than that of H2O ( K). Hence CH4 can be evaporated in a lukewarm region ( K) around a newly born protostar. The CH4 evaporated from dust grains reacts with C+ to form C2H, which gives C2H2 and C2H by electron recombination reactions. Further reactions of C2H2 and C2H with C+ produce longer carbon-chain molecules. A basic part of this scheme is confirmed by chemical model calculations (Aikawa et al., 2008; Hassel et al., 2008; Harada and Herbst, 2008). The WCCC picture is consistent with the observed distribution of the carbon-chain molecules in L1527 (Sakai et al., 2010).
Because of a high expected abundance of CH4, the WCCC sources would be a good target to search for the CH3D line. The molecular D/H ratios are measured to be consistent for various molecules toward L1527 (Sakai et al. 2009b, ), and hence, we can make a reasonable estimation for the abundance of gaseous CH4 from the observation of CH3D. The result will verify the WCCC mechanism, and will lead us to a deeper understanding of a role of CH4 in interstellar chemistry. With this motivation, we conducted a sensitive observation of the CH3D line toward L1527.
2 Observations
We first observed the line (232.644301 GHz) of CH3D toward the low-mass protostar, IRAS 04368+2557 in L1527 with the IRAM 30 m telescope in April 2008. The observed position was . We employed the A230/B230 receiver as a frontend. The beam size is 10.′′6. In this observation, we found a hint of the CH3D line at the right velocity with the intensity of 20 mK (), although the confidence level is only 2.3 .
Encouraged by this result, we then conducted a long integration observation of this line toward the same position with Heinrich Hertz Submillimeter Telescope (HHT) 111The HHT is operated by the Arizona Radio Observatory (ARO), Steward Observatory, University of Arizona. in January 2011 and February 2012. The ALMA Band 6 () mm prototype receiver was used as a frontend in the 4 IF dual polarization mode, whose system noise temperatures ranged from 180 K to 250 K. In the observation in 2011, the CH3D line was placed in the lower sideband with the CS line (244.9355565 GHz) in the upper sideband. The sideband rejection was about -13 dB. The beam size and the main beam efficiency of the telescope are listed in Table 1. In the observation in 2012, the CH3D line was placed in the upper sideband with the C18O line (219.5603541 GHz) in the lower sideband. The telescope pointing was checked every 1.5 hours by observing the continuum emission of Jupiter, or the CS() emission of S231 and IRC10216, and was maintained to be better than 10′′. A small daily variation of the intensity was calibrated by using the CS or C18O line. The backend used was filterbanks whose bandwidth and resolution are 64 MHz and 250 kHz, respectively. The frequency resolution corresponds to the velocity resolution of 0.32 km s-1, which is comparable to or slightly smaller than the line width in this source (0.3-0.6 km s-1: Sakai et al. 2008; 2009). The observation was made in position-switching mode with the off-position of arcminutes. The final spectrum was placed on the scale using observations of Jupiter.
3 Results
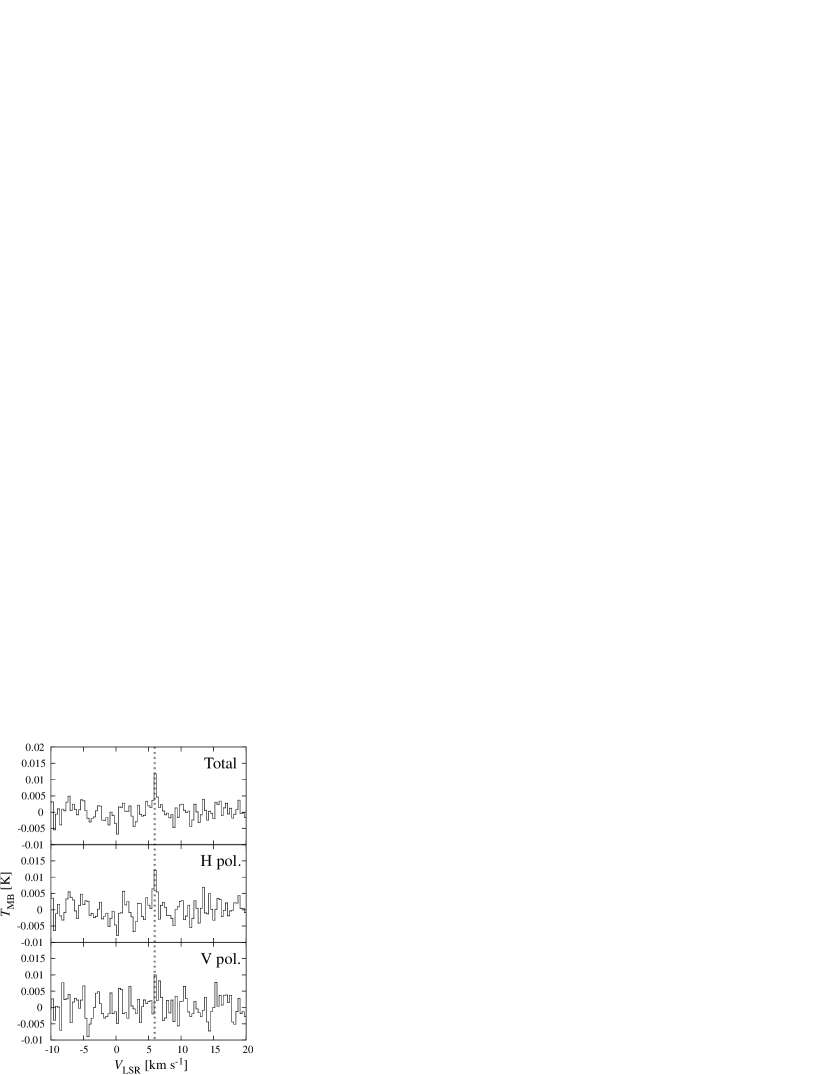
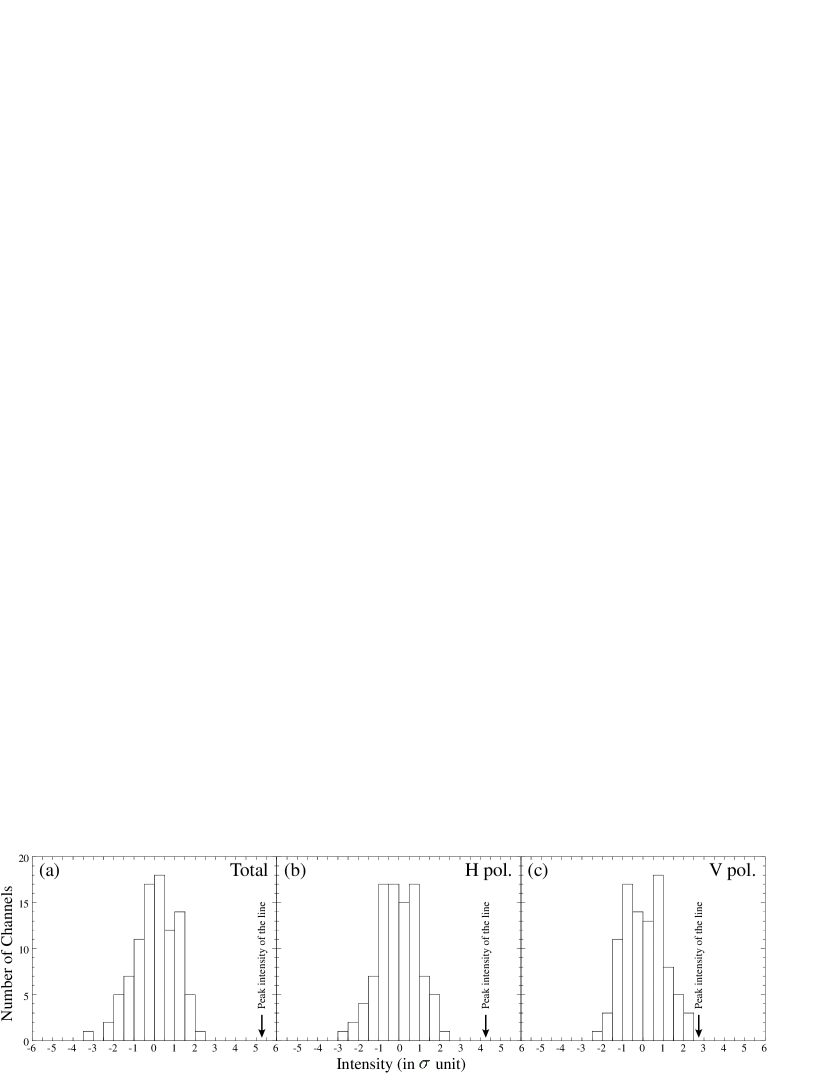
In the 2011 observation with HHT, we tentatively detected the line of CH3D toward the low-mass protostar IRAS 04368+2557 in L1527, as shown in Figure 1. The line can be recognized in the both (H and V) polarization data, although it is marginally seen in the V polarization data due to a larger noise level. The line is not well resolved due to a limited frequency resolution of the backend employed. In preparation of the spectra, each 5 minute integration scan were carefully checked to eliminate the bad scan data with a heavy baseline distortion and/or an apparent strong noise spikes, as a usual data reduction process. Note that no apparent spikes appear at the line channel. For the total spectrum, the confidence level of the detection is 7.9 in the integrated intensity, and 5.2 in the peak intensity. This line shows the strongest intensity in the observed band (128 spectral channels), and the noise reveals a Gaussian distribution, as shown in Figure 2. Hence, the line is significantly detected in the total spectrum. The noise distributions of the H and V polarization spectra are also shown in Figures 2b and 2c, respectively. They show the Gaussian form, although the V polarization data have a slightly poor shape.
To confirm the line, we also carried out the observation with the different frequency setting in 2012, where the CH3D line is set in the upper sideband, and marginally confirmed the line with the 3.6 confidence level. However, we unfortunately suffered from serious spurious signals probably due to instability of the receiver and the backend in the 2012 observation in contrast to the 2011 observation, and hence, we did not use the 2012 data for the final spectrum.
The linewidth and the LSR velocity are consistent with those of other carbon-chain molecules observed in this source (e.g. Sakai et al. 2008; 2009b). We carefully checked the molecular line databases such as CDMS (Mller et al., 2005), JPL Catalog (Pickett et al., 1998), and confirmed that no appropriate line exists at the frequency of 0.5 km s-1 except for the CH3D line. We also confirmed no strong line in the image band. The lines of saturated complex organic molecules like HCOOCH3, C2H5CN, and (CH3)2O, which give congested spectra, are not detected in L1527 even with a very sensitive observation (Sakai et al., 2007). This is in contrast to the high mass star-forming regions like Orion KL, and also to the low-mass star-forming regions with the hot corino activity (e.g. IRAS162932422; Cazaux et al. 2003). Furthermore, the linewidth in L1527 is narrower than those in Orion KL (5 km s-1) and IRAS162932422 (2 km s-1). Although L1527 harbors long various carbon-chain molecules and their isomers, their rotational transitions in the 200 GHz region generally have very high upper state energies (100 cm-1, for carbon-chains with for or more carbon atoms) and are difficult to be excited in L1527. Therefore, an accidental matching of other lines would be unlikely, and our identification of this line to CH3D is the most reasonable.
The column density of CH3D is estimated to be cm-2 from the integrated intensity by assuming the LTE (local thermodynamic equilibrium) condition with the excitation temperature of 25 K, which corresponds to the evaporation temperature of CH4 from dust grains. The source size is assumed to be 20′′ (Sakai et al., 2010). Here the error is calculated from three times the standard deviation of the integrated intensities. The fractional abundance of CH3D is evaluated to be , where the H2 column density is assumed to be cm-2 (Jrgensen et al., 2002). Temperature dependences of the column density and the fractional abundance are carefully inspected, as summarized in Table 2. The column density and the fractional abundance vary roughly linearly with the temperature over the range from 15 to 35 K. In this temperature range, the difference is within a factor of 2.
varies within a factor of 2. The CH3D column density is much less than the upper limit reported for Orion-KL ( cm-2) by three orders of magnitude (Womack et al., 1996). When we assume the deuterium fractionation ratio of 2–7 % by referring the ratios for various carbon-chain molecules observed toward L1527 (Sakai et al. 2009b, ), the CH4 column density is evaluated to be (1.3–4.6) cm-2 by using the CH3D column density for the excitation temperature of 25 K. Hence, the fractional abundance of CH4 is (4.3–15.2) . In this calculation, we do not explicitly consider the statistical factor due to four equivalent hydrogen atoms in CH4, because the deuterium fractionation ratios observed in L1527 are within the above range regardless of the number of equivalent hydrogen atoms (i.e. 0.05, 0.03, 0.07, and 0.04 for l-C3D/l-C3H, C4HD/C4H2, c-C3HD/c-C3H2, and NH2D/NH3, respectively).
4 Discussions
In this study, we tentatively detected the rotational spectral line of CH3D in interstellar space for the first time. Although no cataloged lines do not match to the observed line, it might be a line of unknown species. To rule out this possibility completely, we need to observe the other rotational transitions. The intensities of the (465 GHz; K) and (698 GHz; K) lines are predicted to be 21 mK and 12 mK by assuming the excitation temperature of 25 K and the linewidth of 0.5 km s-1. However, their sensitive observations are difficult because of the relatively heavy atmospheric absorption at these frequencies. We have therefore decided to publish the present result as the tentative detection of CH3D, considering its importance in astrochemistry.
The gas-phase CH4 abundance has been reported for a few high-mass star-forming regions by observing the infrared absorption lines. Lacy et al. (1991) found that the gas-phase CH4 abundance is typically 10-3 times the CO abundance. If we assume the fractional abundance of CO to be 10-4, this corresponds to the fractional abundance of 10-7. This value is lower than that observed in the present study by an order of magnitude. On the other hand, Boogert et al. (2004) reported the gas-phase CH4 abundance to be higher than toward the core of NGC7538 IRS9, and Knez et al. (2009) recently reported it to be toward NGC7538 IRS1. These abundances are comparable to our result, although their observation traces much hotter region (=55–674 K) than our present observation.
According to the chemical model calculation of dynamically evolving cores by Aikawa et al, (2008), CH4 is mainly produced in grain mantles, and it is evaporated in a lukewarm region near the protostar. The gas-phase CH4 abundance in L1527 comparable to or slightly lower than that expected from their chemical model calculation (). It should be noted that the fractional abundance of CH3D is also comparable to or slightly lower than the result of their new chemical model calculation involving the deuterated species () (Aikawa et al., 2012). If the emitting region of the CH3D line is smaller than 20′′, the abundance of CH3D becomes higher, giving a better agreement with the model result.
In this relation, it is interesting to compare our result with the solid CH4 abundance. The infrared absorption spectrum of solid CH4 is not available for L1527, because the protostar is heavily obscured even in the mid-infrared region. However, it is detected in another WCCC source, IRAS15398-3359 (berg et al., 2008; Sakai et al. 2009a, ). The abundance of the solid CH4 relative to the H2O ice is reported to be 0.06. When we assume the fractional abundance of the H2O ice relative to the gas-phase H2 to be 10-4, the fractional abundance of the solid CH4 is estimated to be . This is almost comparable to the gas-phase CH4 abundance found in L1527.
Recent observational studies of low-mass star-forming regions reveal a significant chemical diversity among the low-mass Class 0 protostars. Two distinct cases are hot corinos and the WCCC sources. The hot corino chemistry is characterized by rich saturated organic molecules like HCOOCH3 and CH3CH2CN, which are evaporated from grain mantles. The representative sources are IRAS 16293-2422 and NGC1333 IRAS4A/B (e.g. Cazaux et al., 2003; Bottinelli et al., 2004; Sakai et al., 2006). In these sources, carbon-chain molecules are generally deficient. In contrast, the saturated organic molecules have not been detected so far in the WCCC sources in spite of very sensitive single-dish observations (e.g. Sakai et al., 2007). Such a chemical variation originates from the difference in the evaporated species, and thereby in chemical composition of grain mantles. In the WCCC mechanism, the abundances of carbon-chain molecules critically depends on the amount of CH4 evaporated from grain mantles. If the gas-phase CH4 abundance is higher than the abundance of OH (typically ; e.g. Herbst and Leung 1989), CH4 can be a major destructor of C+ instead of OH in a lukewarm region where H2O is still frozen out. Then, the WCCC occurs when the CH4 abundance exceeds this level. The CH4 abundance derived for L1527 certainly fulfills this requirement, which further strengthens the WCCC picture in L1527.
In order to verify a role of CH4 in the observed chemical diversity, it is important to measure the CH4 abundances in various low-mass star-forming regions. As demonstrated in this study, observations of CH3D can be a useful method for this purpose.
References
- Aikawa et al. (2008) Aikawa, Y., Wakelam, V., Garrod, R. T., and Herbst, E. 2008, ApJ, 674, 984.
- Aikawa et al. (2012) Aikawa, Y., Wakelam, V., Hersant, F., Garrod, R. T., and Herbst, E. 2012, ApJ, submitted.
- Bottinelli et al. (2004) Bottinelli, S., et al. 2004, ApJ, 615, 354.
- Boogert et al. (2004) Boogert, A. C. A., Blake, G. A., and K. berg, K. I. 2004, ApJ, 615, 344;
- Cazaux et al. (2003) Cazaux, S., Tielens, A. G. G. M., Ceccarelli, C., Castets, A., Wakelam, V., Caux, E., Parise, B., and Teyssier, D. 2003, ApJ, 593, L51.
- Collings et al. (2004) Collings, M. P., Anderson, M. A., Chen, R., Dever, J. W., Viti, S., Williams, D. A., & McCoustra, M. R. S. 2004, MNRAS, 354, 1133.
- Harada and Herbst (2008) Harada, N., and Herbst, E. 2008, ApJ, 685, 272.
- Hassel et al. (2008) Hassel, G. E., Herbst, E., and Garrod, R. T. 2008, ApJ, 681, 1385.
- Herbst and Leung (1989) Herbst, E. and Leung, C. M. 1989, ApJS, 69, 271.
- Jrgensen et al. (2002) Jrgensen, J. K., Schier, F. L., and van Dishoeck, E. 2002, A&A, 389, 908.
- Knez et al. (2009) Knez, C., Lacy, J. H., Evans, N. J., van Dishoeck, E. F., Richter, M. J. 2009, ApJ, 696, 471.
- Lacy et al. (1991) Lacy, J. H., Carr, J. S., Evans, Neal J. II, Baas, F., Achtermann, J. M., and Arens, J. F. 1991, ApJ, 376, 556.
- Mller et al. (2005) Mller, H. S. P., Schlder, F., Stutzki, J., and Winnewisser, G. 2005, J. Mol. Struct., 742, 215.
- berg et al. (2008) berg, K. I., Boogert, A. C. A, Pontoppidan, K. M., Blake, G. A., Evans, N. J., Lahuis, F., and van Dishoeck, E. F. 2008, ApJ, 678, 1032.
- berg et al. (2011) berg, K. I. et al. 2011, ApJ, 740, 109.
- Penteado et al. (2005) Penteado, P. F., Griffith, C. A., Greathouse, T. K., and de Bergh, C. 2005, ApJ, 629, L53.
- Pickett et al. (1980) Pickett, H. M., Cohen, E. A., and Phillips, T. G. 1980, ApJ, 236, L43.
- Pickett et al. (1998) Pickett, H. M., Poynter, R. L., Cohen, E. A., Delitsky, M. L., Pearson, J. C., and Muller, H. S. P. 1998, J. Quant. Spectrosc. & Rad. Transfer, 60, 883.
- Sakai et al. (2006) Sakai, N., Sakai, T., and Yamamoto, S. 2006, PASJ, 58, L15.
- Sakai et al. (2007) Sakai, N., Sakai, T., and Yamamoto, S. 2007, Ap&SS, 313, 153
- Sakai et al. (2008) Sakai, N., Sakai, T., Hitora, T., and Yamamoto, S. 2008a, ApJ, 672, 371.
- (22) Sakai, N., Sakai, T., Hirota, T., Burton, M., and Yamamoto, S. 2009a, ApJ, 697, 769.
- (23) Sakai, N., Sakai, T., Hirota,T., and Yamamoto, S. 2009b, ApJ, 702, 1025.
- Sakai et al. (2010) Sakai, N., Sakai, T., Hirota,T., and Yamamoto, S. 2010, ApJ, 722, 1633.
- Shirley et al. (2002) Shirley, Y. L., Evans, Neal J. II, and Rawlings, J. M. C. 2002, ApJ, 575, 337.
- Watson et al. (1979) Watson, J. K. G., Takamia, M., and Oka, T. 1979, J. Chern. Phys., 70, 15.
- Womack et al. (1996) Womack, M., Apponi, A. J., and Ziurys, L. M. 1996, ApJ, 461, 897.
- Wofcy et al. (1970) Wofsy, S. C., Muenter, J., S., and Klemperer, W., 1970, J. Chern. Phys., 53, 10.
| Parameter | Value |
|---|---|
| Telescope | HHT |
| 0.75 | |
| HPBW | 32 [arcsec] |
| Rest Frequencya | 232644.301 0.075 [MHz] |
| 12 2 [mK] | |
| () | 7.4 2.8 [mK km s-1] |
| 6.0 [km s-1] | |
| rms | 2.2 [mK] |
| Temperature | (CH3D) [cm-2]a | (CH3D)a,b | (CH4) [cm-2]c | (CH4)b,c |
|---|---|---|---|---|
| 15 K | (6.3) | (2.1) | (0.9–3.1) | (3.0–10.5) |
| 25 K | (9.1) | (3.0) | (1.3–4.6) | (4.3–15.2) |
| 35 K | (12.9) | (4.3) | (1.8–6.4) | (6.1–21.4) |