Secular evolution in action: central values and radial trends in the stellar populations of boxy bulges
Abstract
We determine central values and radial trends in the stellar populations of the bulges of a sample of 28 edge-on S0–Sb disk galaxies, 22 of which are boxy/peanut-shaped (and therefore barred). Our principal findings are the following. (1) At a given velocity dispersion, the central stellar populations of galaxies with boxy/peanut-shaped bulges are indistinguishable from those of early-type (elliptical and S0) galaxies. Either secular evolution affects stellar populations no differently to monolithic collapse or mergers, or secular evolution is not important in the central regions of these galaxies, despite the fact that they are barred. (2) The radial metallicity gradients of boxy/peanut-shaped bulges are uncorrelated with velocity dispersion and are, on average, shallower than those of unbarred early-type galaxies. This is qualitatively consistent with chemodynamical models of bar formation, in which radial inflow and outflow smears out pre-existing gradients.
keywords:
galaxies: abundances — galaxies: bulges — galaxies: elliptical and lenticular, cD — galaxies: spiral1 Introduction
Among the observational clues and tests for theories of galaxy formation and evolution are the well-known empirical correlations between the optical absorption line strengths of early-type galaxies (ellipticals and S0s, ETGs hereafter) and their dynamical or photometric properties (e.g. Terlevich et al., 1981; Bender et al., 1993; Kuntschner, 2000). For increasing stellar velocity dispersion or mass, central and global observations of the line strengths (and therefore stellar populations) of ETGs show them to be older and more metal-rich, and more abundant in -elements relative to Fe (e.g. Thomas et al., 2005; Kuntschner et al., 2010). Radial trends in stellar populations are a powerful additional discriminant. Monolithic collapse models (e.g. Eggen, Lynden-Bell, & Sandage 1962; Larson 1974; Carlberg 1984) predict steep negative metallicity gradients of .111We follow convention by characterizing radial gradients with linear fits in , and using the notation , where X is [], [] or . Hierarchical models predict that these gradients become generally shallower as they are diluted by mergers (e.g. White, 1980; Di Matteo et al., 2009).
Observations of stellar population gradients in ETGs (e.g. Davies et al., 1993; Mehlert et al., 2003; Kuntschner et al., 2006; Spolaor et al., 2009; Kuntschner et al., 2010; Roediger et al., 2011) show that, on average, and . However, , and below a central velocity dispersion of km s-1 (equivalent to a dynamical mass ), there is some evidence of a correlation: more massive systems have steeper negative metallicity gradients (e.g. Spolaor et al., 2009; Kuntschner et al., 2010). Above this characteristic mass, the correlation between gradient and velocity dispersion or mass disappears, but the average metallicity gradient is still negative.
Analysis of the stellar populations of the bulges of spiral galaxies is more challenging than in ETGs: bulges are fainter and embedded in disks, and they may have complicated or ongoing star formation histories, nebular emission, and significant dust absorption. Nevertheless, the consensus is that the stellar populations of bulges in S0-Sbc disk galaxies are very similar to those in ellipticals and S0s. At a given velocity dispersion, their line strengths and the implied stellar populations are, on average, the same as those of earlier types (Proctor & Sansom, 2002; Thomas & Davies, 2006; Falcón-Barroso et al., 2006; MacArthur et al., 2009). In combination with dynamical and structural similarities, this is evidence that the bulges of these galaxies formed in a similar way to ETGs. However, the good agreement between bulges and ETGs breaks down in the bulges of late-type spirals. For example, Ganda et al. (2007) observed that the bulges of a sample of 18 Sb–Sd galaxies have smaller indices and larger indices at a given stellar velocity dispersion . The differences may be evidence that these bulges formed or are currently affected by different processes to ETGs and the bulges of earlier-type disks, the most likely being the secular and internal rearrangement of disk material (Kormendy & Kennicutt, 2004).
The radial behaviour of the stellar populations of bulges in spiral galaxies is relatively uncertain. The major studies are Moorthy & Holtzman (2006, long-slit observations of the bulges of 38 galaxies ranging from S0 to Sbc), Falcón-Barroso et al. (2006) and Peletier et al. (2007, SAURON integral field observations of the bulges of 24 Sa galaxies), Ganda et al. (2007, SAURON integral-field observations of the bulges of 18 Sb–Sd galaxies), Jablonka et al. (2007, minor-axis long-slit observations of the bulges of 30 edge-on S0 to Sc galaxies), Morelli et al. (2008, long-slit observations of the bulges 18 S0–Sbc galaxies) and MacArthur et al. (2009, long-slit observations of the bulges of 8 Sa–Sd galaxies). Among the areas of agreement of these studies is the finding that most bulges have negative metallicity gradients. Compared to ETGs, however, there is rather more scatter in these gradients and more diversity in the structure of the radial profiles. This observation brings us on to the subject of bars (and, by implication, boxy/peanut-shaped bulges), since they may be the origin of that diversity.
Simulations of the chemodynamical evolution of barred disk galaxies find that the bars drive an inflow of gas within corotation and outflow beyond (e.g. Friedli et al., 1994; Friedli, 1998). This radial transport naturally flattens pre-existing population gradients. Moreover, simulations by Wozniak (2007) predict local minima of stellar age at the ends of bars. Observational tests of these predictions are crucial, because bars are found in two-thirds of disk galaxies and likely play a significant role in transforming the stellar populations of their hosts. Perez et al. have made the first systematic attempt to study radial stellar population trends in barred galaxies (Pérez et al., 2007, 2009; Pérez & Sánchez-Blázquez, 2011, PSB11 hereafter). They used optical spectra taken with long slits oriented along the bar major axes of 20 face-on and moderately-inclined barred S0–Sb galaxies.
This Letter studies central values and radial trends in the stellar populations of bulges of barred galaxies by determining absorption line strengths and single stellar population (SSP) equivalent ages, [] and []. We use the Bureau & Freeman (1999) sample of edge-on disk galaxies. The majority (22/28) of the galaxies in this sample host bulges that are boxy or peanut-shaped, i.e. bars viewed in projection (e.g. Combes et al., 1990; Kuijken & Merrifield, 1995; Bureau & Freeman, 1999; Chung & Bureau, 2004; Kormendy & Kennicutt, 2004). In Section 2 we describe the sample, observations and data reduction. In Section 3 we discuss the central and global stellar populations, and in Section 4 we discuss the radial trends and gradients. Full results (i.e. complete radial profiles) for the stellar kinematics, gas kinematics, Lick indices, and SSP-equivalent population properties are presented in Williams (2011).
2 Observations and data reduction
Our sample galaxies are the 28 edge-on galaxies presented in Bureau & Freeman (1999) and Chung & Bureau (2004). Those works describe the sample and observations used here in more detail, but in brief half of the galaxies are S0s, half are spirals, and 22/28 host a boxy or peanut-shaped bulge. We took long-slit spectra using the Double Beam Spectrograph (DBS) on the 2.3 m telescope at Siding Springs Observatory. In the instrumental setup used, the DBS takes two spectra, each covering a range of Å. The blue arm was centred on the continuum absorption features around the triplet. The red arm was centred on the H emission line when detected or moved to the Calcium triplet. The red spectra therefore suffer from emission or strong atmospheric absorption and cover a wavelength range where stellar population models are poorly constrained. The blue arm spectra are therefore the sole focus of this work.
We reduced the data from the blue arm using standard IRAF long-slit techniques, yielding a flat-fielded, wavelength-calibrated, sky-subtracted long-slit spectrum along the major axis of each galaxy. Cumulative exposure times ranged from 200 to 400 minutes per object. The reduced two-dimensional spectra were linearly binned in wavelength and cover the spectral range 4755–5710 Å. The spectral resolution of the instrument is 1.2 Å full-width half-maximum (equivalent to km s-1 at 5150 Å). The spatial axis has a pixel scale of 0.91 arcsec pixel-1 and covers a maximum of 5′.
Chung & Bureau (2004) have already presented absorption line stellar kinematics for these data, but we rederived them for the present work for two reasons. Firstly, we need to spatially bin to a higher signal-to-noise ratio () to better measure absorption line strengths. Secondly, more powerful and flexible analysis libraries and codes are now available, which allow us to treat emission lines more precisely (Cappellari & Emsellem, 2004; Sarzi et al., 2006). Outside the central few pixels, where the was already large, we spatially binned each spectra to a per Å.
We extracted stellar and gas kinematics using identical techniques to those described in Williams et al. (2011), i.e. using penalized pixel fitting (PPXF; Cappellari & Emsellem 2004) and GANDALF (Sarzi et al., 2006). As in Williams et al. (2011), we used a subset of 88 stars from the MILES library of 985 observed stellar spectra (Sánchez-Blázquez et al., 2006b) as templates. We then used GANDALF to clean any , [O iii] and [N i] emission, which are the three main nebular emission features present in our wavelength range. The emission line occurs in the central passband of the absorption Lick index, while [O iii] and [N i] occur in the continuum passbands of the Fe5015 and indices, respectively. We imposed the kinematics of the [O iii] emission line on the and [N i] lines. This simplification is justified for our limited goals (cleaning emission) because (1) in the high galaxies in our sample, where the kinematics of the emission line can be reliably constrained, there is no evidence that they differ systematically from those of the [O iii] line, and (2) there is no evidence that the and [O iii] emission line kinematics differ by an amount greater than their uncertainties in similar analyses of either the SAURON ETG sample (Sarzi et al., 2006) or the SAURON early-type (Sa/Sb) spiral bulge sample (Falcón-Barroso et al., 2006).
Using the stellar kinematics and emission-cleaned spectra, we use the method of Kuntschner et al. (2006) to measure the strengths of the absorption lines present in our data (H, Fe5015, Mg , Fe5270, Fe5335 and Fe5406) in the Lick/IDS system (Burstein et al., 1984; Worthey, 1994; Trager et al., 1998). We compare these Lick index measurements to an interpolated grid of Thomas, Maraston, & Bender (2003) SSP models, yielding SSP-equivalent luminosity-weighted ages, metallicities [] and -element enhancement [] (using the method of Proctor et al., 2004). We exclude the Fe5270 or Fe5335 feature (depending on the galaxy redshift) because of bad columns on the CCD of the blue arm of the DBS. We exclude Fe5406 in the most distant galaxy (ESO 597-G036) because that line is redshifted into the strong [O i] sky line at 5577 Å.
3 Central line strengths and SSP properties
The smallest aperture from which it is meaningful to extract data is set by the seeing limit of the observations and the width of the slit, i.e. . We refer to the average quantities within this aperture as ‘central’.
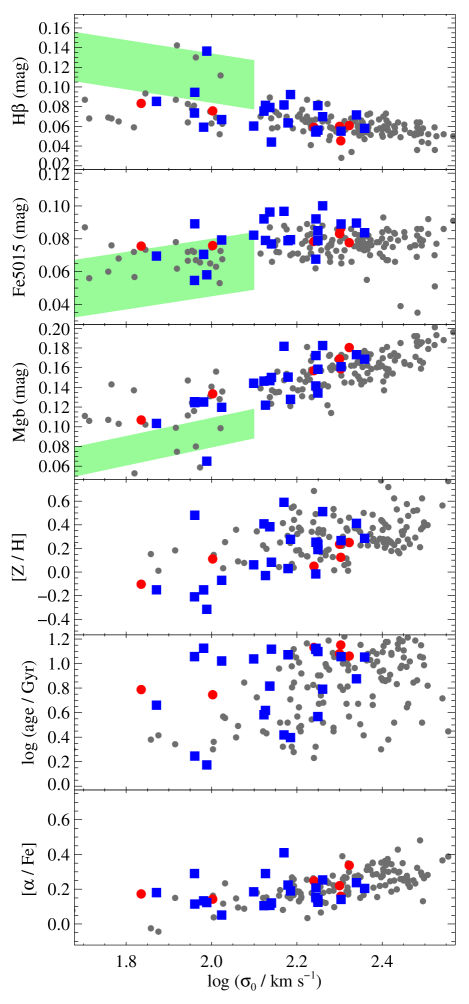
In Fig. 1 we show, as a function of central stellar velocity dispersion , the central values of three representative Lick indices and the SSP-equivalent age, , and of our sample galaxies. We also show comparison data for ETGs. We find no evidence that the central populations of our barred disk galaxies differ from those of ETGs at a given velocity dispersion.
Almost all of these galaxies are barred, and therefore good candidates for observing the effects of secular evolution in their stellar populations. At least in terms of their central values, however, the stellar populations of these barred S0–Sb disk galaxies are no different to those of ETGs (or indeed the six unbarred disk galaxies in our own sample). This implies that either secular evolution does not affect the stellar populations of the centers of bulges of barred S0–Sb galaxies, or its effects are no different to those of monolithic collapse and mergers, the putative formation mechanisms of ETGs. We note that this result is consistent with the findings of Thomas & Davies (2006), who studied the central stellar populations of spiral bulges across a broad range of Hubble types, but did not consider the role of bars in particular. Since our sample is restricted to S0–Sb galaxies, our result does not necessarily contradict the apparent observation of secular evolution effects on the central stellar populations of later-type (Sb–Sd) bulges by Ganda et al. (2007).
4 Radial metallicity gradients
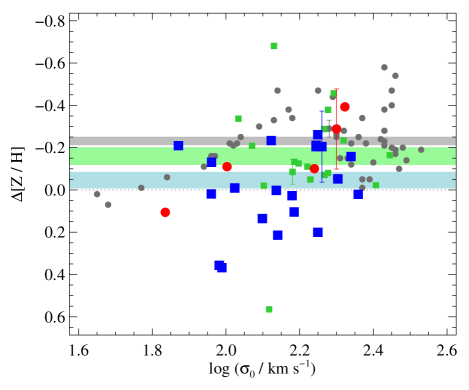
To measure , we fit a straight line to [] as a function of . We use the full radial extent of the data, which cover, on average, the inner 30 arcsec, i.e. the bulge of these local galaxies. We exclude all points inside the seeing limit, which we considered separately in the previous section. We plot as a function of central velocity dispersion in Fig. 2. The data for 2 of our 28 galaxies were only of sufficient to measure the central populations, so are excluded from our gradient analysis. For comparison, we show the [] and [] gradients from a catalogue of ETGs assembled by Spolaor et al. (2010). The original sources of these data are Proctor (2003), Brough et al. (2007), Reda et al. (2007), Sánchez-Blázquez et al. (2007), Spolaor et al. (2008), and Spolaor et al. (2010). All are based on long-slit observations, and all sources except Proctor (2003) use the Thomas et al. (2003) SSP models. We note in any case that, while the choice of SSP models may affect the absolute stellar population parameters derived, the radial gradients are unlikely to be strongly affected (Kuntschner et al., 2010).
From Fig. 2 we conclude the following. (1) There is no evidence that in our boxy bulges is correlated with velocity dispersion. (2) The boxy bulges of our sample of barred galaxies have shallower metallicity gradients than those of ETGs, both on average and at a given velocity dispersion. The mean value of for the boxy and peanut-shaped bulges is and there are several cases of positive metallicity gradients. In contrast, the mean of the Spolaor et al. (2010) catalogue of ETGs is . These results are qualitatively consistent with the simulations of Friedli et al. (1994), who find that outflows and inflows in barred galaxies make pre-existing radial gradients less steep. Since the pre-existing age and [] gradients of ETGs and bulges are, on average, flat, it is not a surprise that, on average, and for our sample as well. We omit these results from Fig. 2, but the results for age and [] profiles are presented and fully discussed in Williams (2011).
One may reasonably worry that line-of-sight effects in our sample of edge-on barred galaxies are responsible for some or all of the flattening of their radial gradients. While we cannot quantify this effect, we argue that it must be small for two reasons. (1) There is no systematic difference between the radial gradients of our 14 S0s (edge-on galaxies largely free of dust) and 14 spirals (edge-on galaxies with prominent dust lanes). This suggests the role of dust is small. (2) As shown in Fig. 2, we see a similar result — shallower gradients in barred galaxies — in data taken from the bulges of a face-on sample of barred galaxies that cannot suffer from line-of-sight flattening (PSB11). The statistical significance of the difference between metallicity gradients in the PSB11 galaxies and unbarred ETGs is admittedly weak (the mean for the PSB11 sample is ), but the strong and clear correlation between and seen in unbarred ETGs with (Spolaor et al., 2010) is totally absent from both our sample of boxy bulges and the PSB11 barred galaxies.
5 Discussion
In summary, we have shown that the stellar populations at the very centres of the bulges found in barred S0–Sb galaxies do not differ from those of ETGs of the same velocity dispersion. On larger physical scales, however, these bulges do differ from ETGs: they lack the correlation between metallicity gradient and velocity dispersion found in ETGs, and their average stellar population metallicity gradients are shallower than unbarred ETGs with the same velocity dispersion.
It is clear that the role of bars in transforming the stellar populations of disk galaxies is a significant gap in our understanding of galaxy evolution. This work suggests several possible avenues for further study. Simulations should attempt to go beyond the qualitative statement that bars should make pre-existing abundance gradients shallower, either by drawing their initial abundance profiles from samples such as Spolaor et al. (2010) and Kuntschner et al. (2010), in which is correlated with velocity dispersion, or by using full cosmological simulations with sufficient resolution to capture bar-driven evolution. Simulations should also make predictions of the vertical gradients of barred galaxies as a function of radius (e.g. Friedli, 1998; Williams et al., 2011). Integral-field observations of the boxy/peanut-shaped bulges of edge-on galaxies are the ideal observational tests of such predictions. Observations of face-on galaxies are complementary to this work, and integral-field data raise the possibility of looking for anticipated azimuthal variations in stellar populations, such as local minima in age at the bar ends (Wozniak, 2007; Pérez et al., 2007).
Acknowledgements
We thank Isabel Pérez and Patricia Sanchez-Blázquez for generously sharing comparison data used in the construction of Fig. 2, and Alfonso Aragon-Salamanca and Roger Davies for useful discussions. MJW acknowledges with gratitude the hospitality of Malcolm Bremer and the University of Bristol Astrophysics Group. MB acknowledges support from the STFC rolling grant ‘Astrophysics at Oxford’ PP/E00114/1 and ST/H002456/1.
References
- Bender et al. (1993) Bender R., Burstein D., Faber S. M., 1993, ApJ, 411, 153
- Brough et al. (2007) Brough S., Proctor R., Forbes D. A., Couch W. J., Collins C. A., Burke D. J., Mann R. G., 2007, MNRAS, 378, 1507
- Bureau & Freeman (1999) Bureau M., Freeman K. C., 1999, AJ, 118, 126
- Burstein et al. (1984) Burstein D., Faber S. M., Gaskell C. M., Krumm N., 1984, ApJ, 287, 586
- Cappellari & Emsellem (2004) Cappellari M., Emsellem E., 2004, PASP, 116, 138
- Carlberg (1984) Carlberg R. G., 1984, ApJ, 286, 403
- Chung & Bureau (2004) Chung A., Bureau M., 2004, AJ, 127, 3192
- Combes et al. (1990) Combes F., Debbasch F., Friedli D., Pfenniger D., 1990, A&A, 233, 82
- Davies et al. (1993) Davies R. L., Sadler E. M., Peletier R. F., 1993, MNRAS, 262, 650
- Di Matteo et al. (2009) Di Matteo P., Pipino A., Lehnert M. D., Combes F., Semelin B., 2009, A&A, 499, 427
- Eggen et al. (1962) Eggen O. J., Lynden-Bell D., Sandage A. R., 1962, ApJ, 136, 748
- Falcón-Barroso et al. (2006) Falcón-Barroso J. et al., 2006, MNRAS, 369, 529
- Friedli (1998) Friedli D., 1998, in Astronomical Society of the Pacific Conference Series, Vol. 147, Abundance Profiles: Diagnostic Tools for Galaxy History, D. Friedli, M. Edmunds, C. Robert, & L. Drissen, ed., p. 287
- Friedli et al. (1994) Friedli D., Benz W., Kennicutt R., 1994, ApJ, 430, L105
- Ganda et al. (2007) Ganda K. et al., 2007, MNRAS, 380, 506
- Jablonka et al. (2007) Jablonka P., Gorgas J., Goudfrooij P., 2007, A&A, 474, 763
- Kormendy & Kennicutt (2004) Kormendy J., Kennicutt, Jr. R. C., 2004, ARAA, 42, 603
- Kuijken & Merrifield (1995) Kuijken K., Merrifield M. R., 1995, ApJL, 443, L13
- Kuntschner (2000) Kuntschner H., 2000, MNRAS, 315, 184
- Kuntschner et al. (2006) Kuntschner H. et al., 2006, MNRAS, 369, 497
- Kuntschner et al. (2010) Kuntschner H., et al., 2010, MNRAS, 408, 97
- Larson (1974) Larson R. B., 1974, MNRAS, 166, 585
- MacArthur et al. (2009) MacArthur L. A., González J. J., Courteau S., 2009, MNRAS, 395, 28
- Mehlert et al. (2003) Mehlert D., Thomas D., Saglia R. P., Bender R., Wegner G., 2003, A&A, 407, 423
- Moorthy & Holtzman (2006) Moorthy B. K., Holtzman J. A., 2006, MNRAS, 371, 583
- Morelli et al. (2008) Morelli L. et al., 2008, MNRAS, 389, 341
- Peletier et al. (2007) Peletier R. F. et al., 2007, MNRAS, 379, 445
- Pérez & Sánchez-Blázquez (2011) Pérez I., Sánchez-Blázquez P., 2011, A&A, 529, A64+
- Pérez et al. (2007) Pérez I., Sánchez-Blázquez P., Zurita A., 2007, A&A, 465, L9
- Pérez et al. (2009) Pérez I., Sánchez-Blázquez P., Zurita A., 2009, A&A, 495, 775
- Proctor (2003) Proctor R. N., 2003, PhD thesis, University of Central Lancashire
- Proctor et al. (2004) Proctor R. N., Forbes D. A., Beasley M. A., 2004, MNRAS, 355, 1327
- Proctor & Sansom (2002) Proctor R. N., Sansom A. E., 2002, MNRAS, 333, 517
- Reda et al. (2007) Reda F. M., Proctor R. N., Forbes D. A., Hau G. K. T., Larsen S. S., 2007, MNRAS, 377, 1772
- Roediger et al. (2011) Roediger J. C., Courteau S., MacArthur L. A., McDonald M., 2011, MNRAS, 416, 1996
- Sánchez-Blázquez et al. (2007) Sánchez-Blázquez P., Forbes D. A., Strader J., Brodie J., Proctor R., 2007, MNRAS, 377, 759
- Sánchez-Blázquez et al. (2006a) Sánchez-Blázquez P., Gorgas J., Cardiel N., González J. J., 2006a, A&A, 457, 787
- Sánchez-Blázquez et al. (2006b) Sánchez-Blázquez P. et al., 2006b, MNRAS, 371, 703
- Sarzi et al. (2006) Sarzi M., et al., 2006, MNRAS, 366, 1151
- Spolaor et al. (2008) Spolaor M., Forbes D. A., Proctor R. N., Hau G. K. T., Brough S., 2008, MNRAS, 385, 675
- Spolaor et al. (2010) Spolaor M., Kobayashi C., Forbes D. A., Couch W. J., Hau G. K. T., 2010, MNRAS, 408, 272
- Spolaor et al. (2009) Spolaor M., Proctor R. N., Forbes D. A., Couch W. J., 2009, ApJ, 691, L138
- Terlevich et al. (1981) Terlevich R., Davies R. L., Faber S. M., Burstein D., 1981, MNRAS, 196, 381
- Thomas & Davies (2006) Thomas D., Davies R. L., 2006, MNRAS, 366, 510
- Thomas et al. (2003) Thomas D., Maraston C., Bender R., 2003, MNRAS, 339, 897
- Thomas et al. (2005) Thomas D., Maraston C., Bender R., Mendes de Oliveira C., 2005, ApJ, 621, 673
- Trager et al. (1998) Trager S. C., Worthey G., Faber S. M., Burstein D., Gonzalez J. J., 1998, ApJS, 116, 1
- White (1980) White S. D. M., 1980, MNRAS, 191, 1P
- Williams (2011) Williams M. J., 2011, PhD thesis, University of Oxford, http://ora.ox.ac.uk/objects/uuid:936168ab-f49a-410a-9e1b-80c7ad7cf556
- Williams et al. (2011) Williams M. J., Zamojski M. A., Bureau M., Merrifield M. R., Kuntschner H., de Zeeuw P. T., 2011, MNRAS, 414, 2163
- Worthey (1994) Worthey G., 1994, ApJS, 95, 107
- Wozniak (2007) Wozniak H., 2007, A&A, 465, L1