Photometric distances to young stars in the inner galactic disk
Abstract
Context. The spiral structure of the Milky Way inside the solar circle is still poorly known because of the high density of the material that causes strong extinction towards the galactic center.
Aims. We present results of the first extensive and deep CCD photometric survey carried out in the field of the open cluster Trumpler 27, an object immersed in a region of extremely high visual absorption in the constellation of Sagittarius not far from the Galaxy center. The survey covers almost a quarter of square degree.
Methods. We look for young stars clumps that might plausibly be associated with spiral structure. Wide-field photometry combined with infrared information allows us to reconstruct the distribution in reddening and distance of young stars in the field using the Color-Color and Color-Magnitude diagrams
Results. The analysis of our data, combined too with extensive spectroscopy taken from literature shows that the real entity of Trumpler 27 as an open cluster is far from being firmly stated. In fact, instead of finding a relatively compact group of stars confined to a small distance range, we found that stars associated to Trumpler 27 are, indeed, a superposition of early type stars seen along the line of sight extending over several kiloparsecs beyond even the center of the galaxy. We demonstrate that at each distance range it becomes possible to generate a color-magnitude diagram resembling that of an open cluster. This way, our analysis indicates that what was considered an open cluster characterized by a significant age spread is a stellar continuum that reaches its maximum number of stars at approximately 3.5 kpc from the Sun, the distance of the Scutum-Crux arm approximately. At the same time, and after analyzing the way early type stars distribute with distance, we found some of these stellar groups may be linked, within the distance errors, with other inner spiral arms of our galaxy, including the Near 3 kpc arm at approximately 5 kpc from the Sun. However, very young stars by themselves do not seem to trace strongly the inner spiral arms since they are distributed evenly across several kiloparsecs toward the center of the Galaxy. This is a remarkable difference with current HI and CO radio observations maps that show inner spiral arms composed by discrete structures of gas with a well defined inter-arm separation.
Key Words.:
Galaxy: disk – Open clusters and association: general– Open clusters and association: individual: Trumpler 27 - -Stars: early type – Galaxy: structure1 Introduction
One of the authors (Carraro 2011) has very recently examined the
parameters of the young diffuse stellar populations in the
direction as seen in the background of some open
clusters and related them successfully with the inner
galactic structure. This study made use of photometric techniques
that we developed in the last decade and successfully applied to
the third quadrant of the Milky Way (Carraro et al. 2005; Moitinho
et al. 2006; Vázquez et al 2008).
In Carraro (2011), hereafter the first paper of the
series, we extensively described the project and the employed
methods and proceeded to study the spatial distribution of early
type stars (spectral types O and B) in the direction of . Apart from the prominent Carina-Sagittarius spiral
arm, we detected for the first time signatures of the Scutum-Crux
arm in that direction. These findings confirmed the predictions
of earlier studies on the location and pitch angles of
part of the spiral arm pattern in the fourth Galactic quadrant.
The present article, the second of the series,
is aimed at improving our knowledge of the spiral structure in the
inner galactic disk in another direction, much closer to the
Galaxy center, at . In this case, instead of a
single pointing as in the first paper, we combined together three
pointings to cover a wide region ( 25 arcmin on a side) in
the direction of Trumpler 27. This is an open cluster located in
the Sagittarius constellation, 5 degrees from the center of the
Galaxy and slightly below the galactic plane, at coordinates
, (). The zone occupied by the cluster
is heavily obscured by dust clouds but nevertheless it is still
possible to see a significant but sparse group of relatively
bright stars. The first extensive photometric survey on this
object was conducted by The and Stokes (1970) who obtained
photographic photometry for about 40 stars spread over a circular
area of radius around the assumed center of this
cluster. They found huge values for the color excess
ranging from -approximately- 0.6 to 2.5 mag. Despite this, they
found that the extinction law is normal with
and placed the cluster at a
heliocentric distance of 1.1 kpc. Later on, Moffat et al. (1977,
hereinafter MFJ77) conducted a deeper photometric survey
including photoelectric observations of the brightest stars and
photographic ones for the rest of them. This study was combined
with spectroscopic analysis for a significant number of stars
(about 50) and suggested that Trumpler 27 is at a distance of kpc from the Sun with almost similar reddening values to
the ones previously computed by The and Stokes (1970). Bakker and
The (1983), used Walraven photometric data combined with infrared
and photometry. This last study confirmed that the
extinction law is normal, i.e. , that the
cluster is located at a distance of kpc and is about years old.
After a 20 years hiatus with no investigations, Trumpler
27 was the target of a new spectroscopic campaign carried out by
Massey et al (2001, hereinafter MDEW01) where the oldest spectral
types were verified and spectroscopy was made for several stars
that had not previously been measured. This new spectroscopic
survey revealed a surprisingly hot and massive stellar population
in the area of this object: one M supergiant, 10 supergiants of
B-types, two Wolf-Rayet stars, one Of-type star, two O-type giant
stars, other stars of B-types and G0I -probably- Cepheid
star. In MDEW01 the parameters of several stars
in Trumpler 27 were redetermined onto the basis of this new
spectral survey but retaining the old photometry made by
MFJ77. In this investigation the authors found that the cluster is
located at a distance larger than any previous determination: 2.5
kpc from the Sun. The next interesting finding made by MDEW01 is
the detection of a significant age spread amongst the B-type
stars. It appears that some of them show ages ranging from 6 to
years being about 2 to
older than the rest of them. They assume this age
spread comes from the large difficulty in separating cluster
members from background stars in this highly obscured zone.
Given its position -close to the Galaxy center and onto the galactic plane- Trumpler 27 is an ideal target for the purpose of investigating part of the spiral structure in the fourth Galactic quadrant. Its surroundings contain a large number of potential blue stars, some of which are considered excellent tracers of spiral arms such as W-R stars and O-type stars as shown by MDEW01 and MFJ77. It is useful to recall that it has been almost 30 years since the last photometric study on this object and that we are now in the position of taking advantage of the large number of spectral types to re-discuss the distance and age of Trumpler 27 with modern observations. These two parameters are of paramount importance because this cluster may become a good galactic spiral arm tracer if the distance discrepancy of the order of about 1.4 kpc from one author to other is removed. In other words, such a difference means that the cluster may belong to the Carina-Sagittarius arm or the Scutum-Centaurus arm. But, first, we should assess whether Trumpler 27 really exists and if the found distance discrepancies are only due to the treatment of the strong reddening of the region and/or to the fact that in clusters so heavily obscured, like this one, only the upper -vertical- main sequence is useful for fitting a reference line (e.g., the ZAMS of Scmidt-Kaler (1982)).
In Section 2 we discuss the data acquisition, the reduction process, the stellar astrometry and the comparison with former photometry in the region. In Section 3 we show and discuss the main photometric diagrams and introduce the strategy to derive intrinsic parameters of stars in Trumpler 27. In Section 4, we analyze the data set derived for hot stars and the nature of Trumpler 27. Section 5 includes a description of findings using infrared data. In Section 6 we collect the evidence to interpret the structure of the inner Galaxy as seen through the Trumpler 27 region. Conclusions are given in Section 7.
2 Observation and data reduction
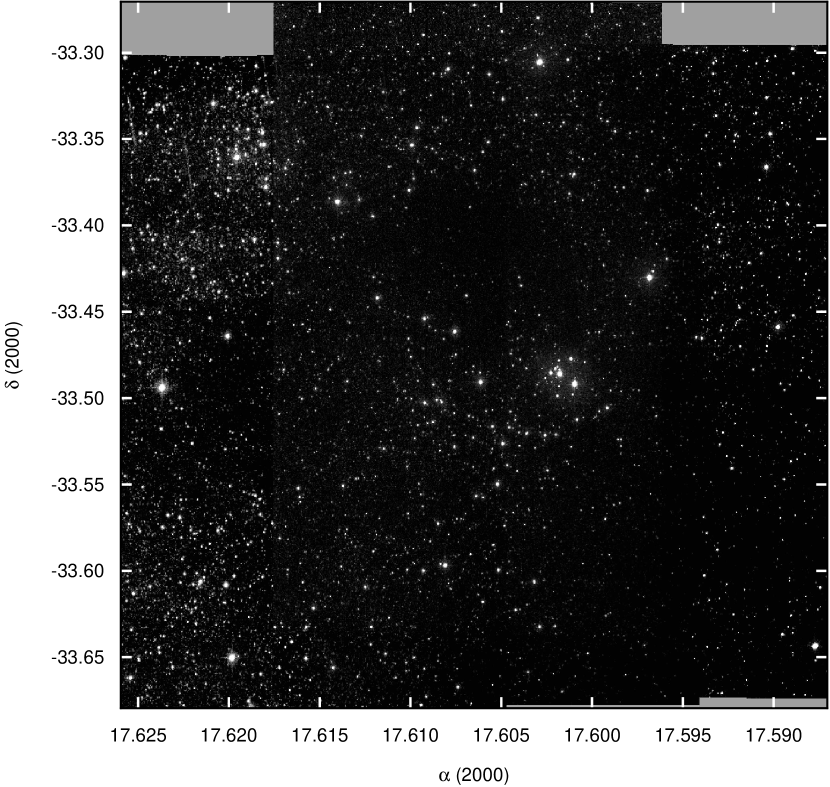
Three regions containing Trumpler 27 were observed in the photometric system at Las Campanas Observatory (LCO) on four different runs in 2006, 2010, and 2011, as illustrated in Table 1, which lists useful details of the observations, like filter coverage, airmass range and exposure time and sequences. We used the SITe3 CCD detector onboard the Swope 1.0m telescope111http://www.lco.cl/telescopes-information/henrietta-swope/. With a pixel scale of 0.435 arcsec/pixel, this CCD allowed us to cover 14.8 22.8 arcmin on sky. In all runs the seeing was good, ranging from 0.9 arcsec to 1.8. However, post-processing indicated that in the 2006 and 2010 runs, the nights were not completely photometric, and for this reason we only rely on the 2011 standard stars. The whole field of view is shown in Fig 1, a montage of all V exposure images, and covers an area of 26 23 squared arcmin. North is up, and East to the left. To determine the transformation from our instrumental system to the standard Johnson-Kron-Cousins system, and to correct for extinction, we observed stars in Landolt’s areas PG 1323, PG 1633, and MarkA (Landolt 1992) multiple times and with different air-masses ranging from to , and covering quite a large color range -0.3 1.7 mag. All the images from previous runs have been then shifted to the 2011 run by means of all common stars, before transforming the photometry into the standard system.
| Target | RA | DEC | Date | Filter | Exposure (sec) | airmass (X) |
| Field-1 | 17:36:20.79 | -33:28:02.8 | 2006 May 31 | U | 20, 200, 2x1500 | 1.021.05 |
| B | 10, 100, 2x1200 | 1.001.00 | ||||
| V | 5, 10, 100, 900 | 1.141.16 | ||||
| I | 5, 10, 2x100 | 1.081.10 | ||||
| Field-1 | 17:36:20.79 | -33:28:02.8 | 2006 Jun 26 | B | 40 | 1.001.01 |
| V | 20 | 1.001.01 | ||||
| I | 20 | 1.001.01 | ||||
| Field-1 | 17:36:20.79 | -33:28:02.8 | 2006 Jun 31 | U | 60 | 1.001.01 |
| B | 30 | 1.001.01 | ||||
| V | 30 | 1.001.01 | ||||
| I | 30 | 1.001.01 | ||||
| Field-1 | 17:36:20.79 | -33:28:02.8 | 2010 May 08 | U | 15, 90, 300, 1500 | 1.021.03 |
| B | 5, 45, 300, 1200 | 1.061.10 | ||||
| V | 2x5, 120, 900 | 1.101.15 | ||||
| I | 2x5, 30, 600 | 1.011.01 | ||||
| Field-2 | 17:36:54.79 | -33:28:02.8 | 2010 May 08 | U | 15, 90, 300, 1500 | 1.011.01 |
| B | 5, 45, 300, 1200 | 1.031.04 | ||||
| V | 2x5, 120, 900 | 1.121.14 | ||||
| I | 2x5, 30, 600 | 1.051.08 | ||||
| Field-3 | 17:35:47.79 | -33:28:02.8 | 2010 May 08 | U | 15, 90, 300, 1500 | 1.051.11 |
| B | 5, 45, 300, 1200 | 1.111.18 | ||||
| V | 2x5, 120, 900 | 1.361.42 | ||||
| I | 2x5, 30, 600 | 1.201.28 | ||||
| Field-1 | 17:36:20.79 | -33:28:02.8 | 2011 Jun 03 | U | 60, 180 | 1.001.01 |
| B | 30, 120 | 1.001.01 | ||||
| V | 10, 60 | 1.001.01 | ||||
| I | 10, 60 | 1.001.01 | ||||
| Mark A | 20:43:55.09 | -10:45:38.0 | 2011 Jun 03 | U | 180, 2x240 | 1.071.60 |
| B | 120, 2x180 | 1.071.56 | ||||
| V | 60, 2x90 | 1.071.53 | ||||
| I | 60, 2x90 | 1.061.51 | ||||
| PG 1323 | 13:25:38.91 | -08:50:05.6 | 2011 Jun 03 | U | 3x180 | 1.081.73 |
| B | 3x120 | 1.081.77 | ||||
| V | 3x60 | 1.071.82 | ||||
| I | 3x60 | 1.071.85 | ||||
| PG 1633 | 16:35:24.91 | 09:47:39.8 | 2011 Jun 03 | U | 2x180, 240 | 1.291.83 |
| B | 2x120, 180 | 1.291.88 | ||||
| V | 3x60, 90 | 1.292.02 | ||||
| I | 2x60, 90 | 1.291.97 |
2.1 Basic photometric reduction
Basic calibration of the CCD frames was done using
IRAF222IRAF is distributed by the National Optical
Astronomy Observatory, which is operated by the Association of
Universities for Research in Astronomy, Inc., under cooperative
agreement with the National Science Foundation. package CCDRED.
For this purpose, zero exposure frames and twilight sky flats were
taken every night. All frames were pre-reduced applying
trimming, bias and flat-field correction. Before flat-fielding,
all frames were corrected for linearity,
following the recipe discussed in Hamuy et al. (2006).
Photometry was then performed using the IRAF DAOPHOT/ALLSTAR and
PHOTCAL packages. Instrumental magnitudes were extracted following
the point-spread function (PSF) method (Stetson 1987). A
quadratic, spatially variable, master PSF (PENNY function) was
adopted, because of the large field of view of the detector.
Aperture corrections were then determined making aperture
photometry of a suitable number (typically 15 to 20) of bright,
isolated, stars in the field. These corrections were found to vary
from 0.160 to 0.290 mag, depending on the filter. The PSF
photometry was finally aperture corrected, filter by filter.
2.2 Photometric calibration
After removing problematic stars, and stars having only a few
observations in Landolt’s (1992) catalog, our photometric solution
for the run was extracted combining measures from both nights-
after checking that they were stable and similar- yielding
a grand total of 63 measurements per filter, and turned out to be:
where indicates the airmass.
The final r.m.s of the fitting in this case was 0.040,
0.019, 0.015, and 0.015
in , , and , respectively.
Global photometric errors were estimated using the
scheme developed by Patat & Carraro (2001, Appendix A1), which
takes into account the errors resulting from the PSF fitting
procedure (i.e., from ALLSTAR), and the calibration errors
(corresponding to the zero point, color terms, and extinction
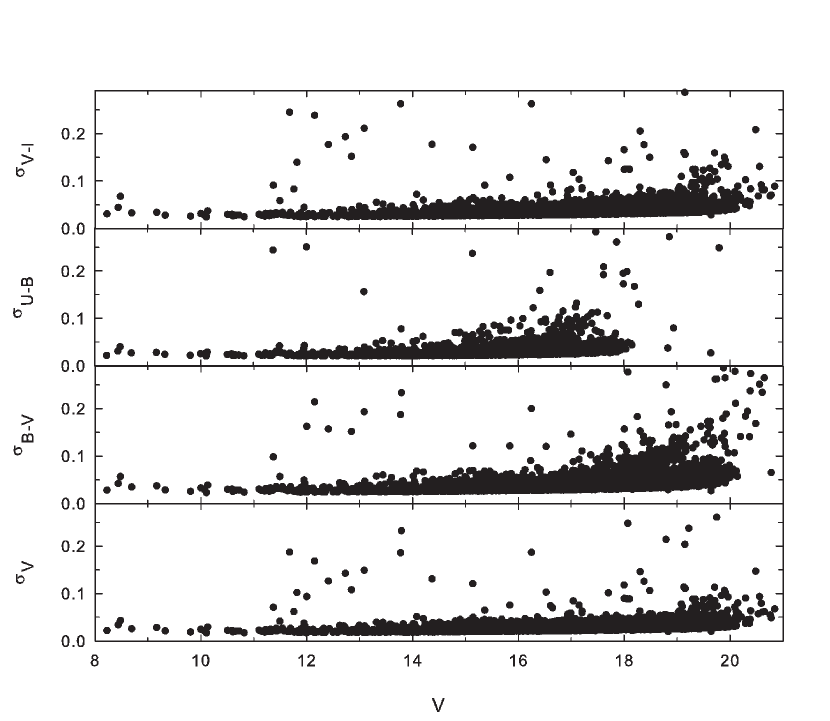
errors). In Fig. 2 we present our global photometric errors in
, , , and plotted as a function of
magnitude. Quick inspection shows that stars brighter than mag have errors lower than mag in magnitude
and lower than mag in and . Higher
errors, as expected, are seen in . The final catalogue
contains 9769 UBVI entries.
2.3 Astrometry
The optical catalogue was cross-correlated with 2MASS, which
resulted in a final catalog including UBVI and
JHKs magnitudes. As a by-product, pixel (i.e.,
detector) coordinates were converted to RA and DEC for J2000.0
equinox, thus providing 2MASS-based astrometry, useful for e.g. spectroscopic follow-up.The rms of the residuals in the
positions were 0.′′15, which is about the
astrometric
precision of the 2MASS catalogue (0.′′12, Skrutskie et al. 2006 ).
2.4 Comparison with former photometry
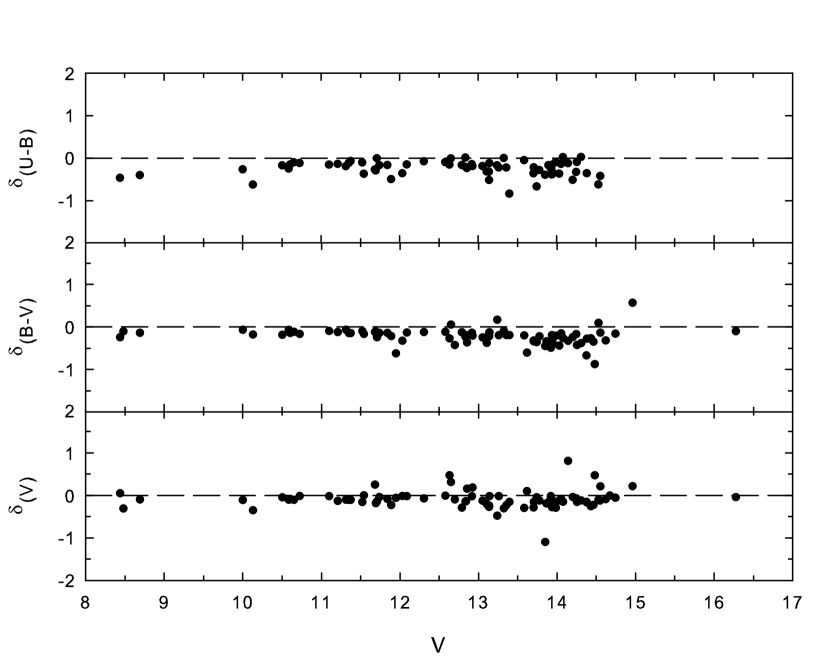
Up to now, the most extensive catalogue of photometry in the region of Trumpler 27 belongs to MFJ77. The other photometric sets are only photographic or in the Walraven system. Comparing our data set with MFJ77 we found 83 common stars in , 81 in and 68 in . The differences in the sense of our data minus MFJ77, are shown in Fig. 3 as a function of our . Most of the stars in the MFJ77 survey have photographic photometry and just a few have photoelectric photometry. In the comparison process, we found at least half a dozen stars showing strong differences in apparent magnitude and/or color indices. This may be produced, specially in crowded regions, in an unavoidable star-light contamination by nearby neighbors when using diaphragms in photoelectric measures. Mean differences and standard deviations are , and . The systematic trend in Fig. 3, in the sense that our values are brighter and bluer than those of MFJ77 and the large scatter, is likely produced by some zero point differences between our photometry and MFJ77’s photographic and photoelectric photometry made with different telescopes and different diaphragm apertures, respectively.
3 The all area photometric diagrams
Earlier CCDs and CMDs of the region of Trumpler 27 have been always very difficult to interpret because of strong and variable internal reddening and the consequent difficulties in defining the upper main sequence. Besides, the upper part of Trumpler 27 CMD is quite vertical and short what makes any fitting of the ZAMS (Schmidt-Kaler 1982) dubious. The sum of these difficulties have precluded this object from a more in-depth study so far (McSwain & Giess, 2005).
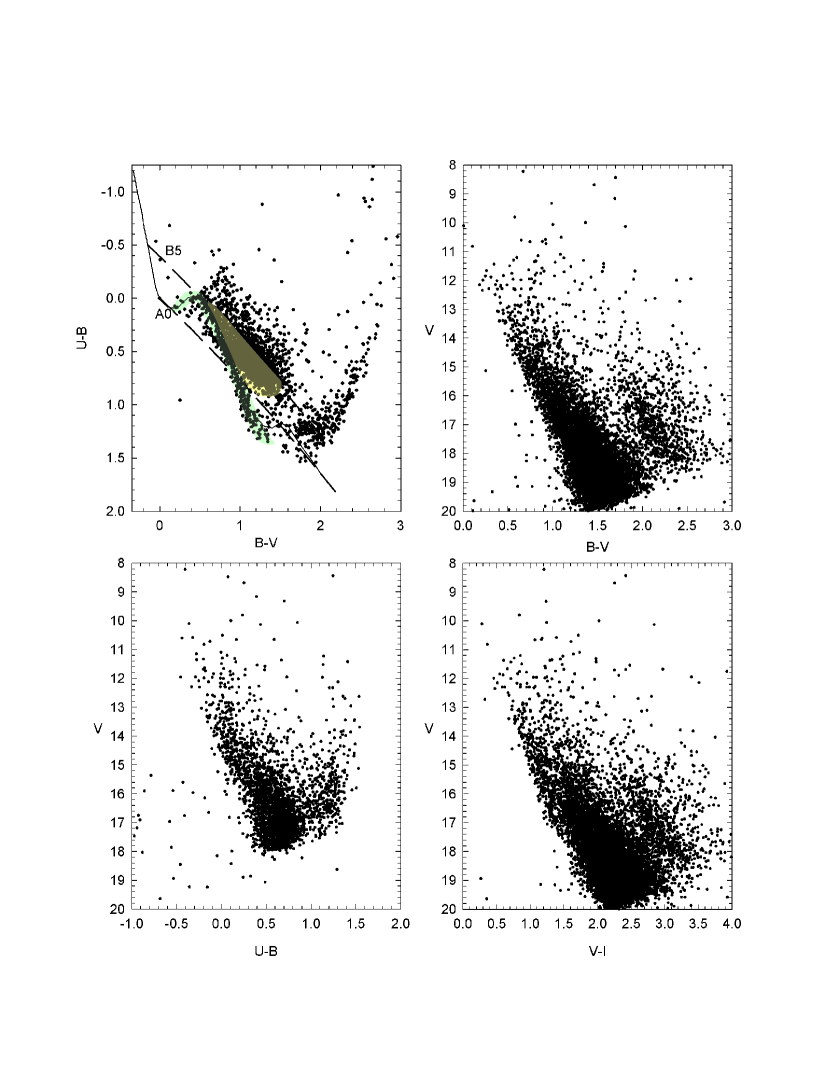
Figure 4 shows the CCD (upper left panel), the vs (upper right panel), the vs (lower left panel) and the vs (lower right panel) CMDs. The solid line in the CCD is the ZAMS of Schmidt-Kaler (1982) shown in the normal position. The reddening path for a B5-type star is also indicated. A simple visual inspection of the CCD allows to establish three dominant stellar populations:
-
a first one, above the reddening line for a typical B5-type star, composed undoubtedly of blue stars strongly affected by variable reddening;
-
a second stellar population appears below the reference line for a B5 star (the yellowish zone) composing a sort of stellar band starting at the second knee of the ZAMS and extending to the red side because of different amounts of reddening affecting them. This large star concentration corresponds, photometrically speaking, to A and early F-type stars but also to reddened B-type stars later than B5 as indicated by the path of the reddening in the CCD;
-
finally, a third stellar population (greenish coloured) little affected by reddening appears extending from the domain of A to M stars all along the intrinsic reference line. Most of these stars are likely to be nearby objects since visual absorption maps from Neckel and Klare (1980) reveal a sudden absorption increment at less than 1 kpc in this direction. Therefore, the detection of intrinsically faint stars not reddened or just marginally affected by interstellar dust is only possible if they are close enough to the Sun.
Inspection of Fig. 1 lends further support to this scenario: intense absorption is seen at the west-southwest and immediately north of the center of Trumpler 27, and also to the east. A clear star overdensity is seen, in the same figure, at the northeast and at the expected location of the cluster core.
The CMDs [ vs , vs and vs ] are less illustrative since not much can be extracted from them beyond the presence, above V = 16 mag, of an extended upper stellar sequence with a high degree of color dispersion that reflects the strong influence of dust in the zone. Since the three populations discussed previously are undistinguishable from each other in the CMDs, we estimate this type of diagram plays a marginal role to inferring useful information on this region.
| Id | ST1 | Id(MFJ77) | ST2(MFJ77,MDEW01) | ||||||
|---|---|---|---|---|---|---|---|---|---|
| 5517 | 1.69 | -0.28 | -1.00 | -2.60 | 3.17 | 0.73 | B0.5 | (…) | (…) |
| 4732 | 1.10 | -0.28 | -1.00 | -2.60 | 2.64 | 0.58 | B0.5 | 19 | OB- |
| 5355 | 1.14 | -0.21 | -1.02 | -6.90 | 6.60 | 0.29 | B0.5Ia | 16 | B0.5Ia |
| 6456 | 1.12 | -0.02 | -0.62 | -7.10 | 6.74 | 0.15 | B0Ia | 2 | B0Ia |
| 5672 | 1.80 | -0.27 | -0.95 | -2.35 | 3.38 | 0.78 | B1 | (…) | (…) |
Id first column is our star numbering. Id column nine is the MFJ77 numbering. ST1 indicates the photometric spectral type found in this paper. ST2(MFJ77,MDEW01) indicates spectral types from the literature.
| Id | ST1 | Id(MFJ77) | ST2(MFJ77,MDEW01) | ||||||
|---|---|---|---|---|---|---|---|---|---|
| 442 | 1.22 | -0.25 | -0.90 | -2.10 | 3.41 | 0.84 | B1.5 | (…) | (…) |
| 4497 | 1.09 | -0.25 | -0.90 | -2.80 | 2.83 | 1.33 | B1.5:V: | 32 | B1.5:V: |
| 3629 | 1.15 | -0.26 | -0.95 | -3.20 | 3.22 | 0.95 | B1:V: | 34 | B1:V: |
| 8932 | 1.25 | -0.26 | -1.00 | -5.40 | 2.64 | 0.40 | B1II | 103 | B1II |
Columns as in Table 2.
3.1 Deriving the parameters of early-type stars
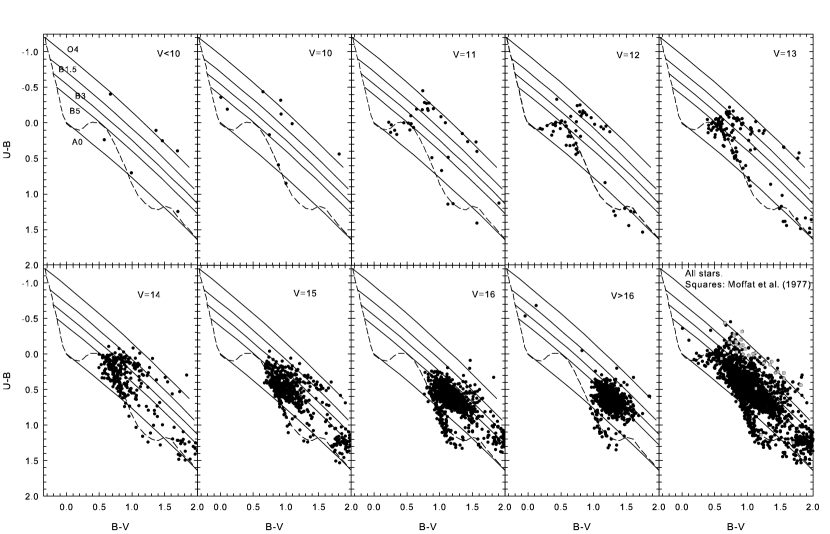
If the CMD is segmented with magnitude intervals and the corresponding CCD to each interval is built, it becomes simpler to understand the way stellar populations develop in a given zone. The foundation and applications of this kind of analysis in open clusters and Galactic fields is developed in Carraro et al. (2008, 2009). In the present case the procedure is shown in the series of CCD in Fig. 5 at intervals of 1 mag down to . The superimposed lines follow the slope explained long time ago by Hiltner and Johnson (1956) (corresponding to ) for stars of various spectral types from O to B5 in addition to the A-type stars.
The series of panels shows the color range covered by the three above mentioned star populations. Actually, reddened hot stars along the reddening lines for O and B4 types look well detached from the rest down to . A comparison of our CCD with the ones produced by Bakker and The (1983), in their Fig. 3, or in Fig. 5 of MFJ77, suggests that the major difference, apart from the inclusion of many faint stars, rests in the high number of new hot and reddened stars detected in our field which in turn is larger than the others.
The panel in the right lower corner shows the overall CCD where we have identified, with open squares, bright stars already studied in previous articles via spectral analysis.
From a stellar group (yellowish coloured) composed of a wide strip of A and F-type stars becomes evident reaching the maximum at . Certainly, this latter group shows an ample range of reddening. Beyond this limit dwarf stars of G-K- and even some M-type stars are detected at increasing number all along the intrinsic line indicating they are not so much affected by reddening and belong to the greenish zone. As stated above, these stars and part of the less reddened A-F- stars in the group belong to a nearby population in the line of sight to Trumpler 27.
In the remaining of this paper we shall focus on those stars above the reddening line for B5-type stars as indicated in Fig. 5 to derive individual distances by means of the spectroscopic parallax method since we know they have unambiguous reddening solution in the CCD. This method has proved to be very efficient to approximate spectral types from photometry alone when unique reddening solutions are available as shown in Ahumada et al. (2011). Intrinsic colors for each star in this zone of the CCD were derived using the reddening line slope along with the relation (Carraro et al. 2010). This gives a second order equation where the index is the positive root and the index comes from the above expression. This locates the star on a point in the ZAMS (Schmidt-Kaler 1982) where the nearest spectral type is assigned. Unlike the Q-method that derives the star color assuming a linear relation of color excesses, here we adopt a quadratic relation that provides a more accurate solution when the color excess is high. Once individual color excesses and intrinsic colors are derived, we proceed to assign spectral types and absolute magnitudes following the relationship given by Schmidt-Kaler (1982). In this procedure all stars are assumed to be of luminosity class V. However, a good number of hot stars have spectral types and luminosity class from MDEW01 and MFJ77. In these cases, the assignment of intrinsic color and absolute magnitude depend on the spectral type and luminosity class found by these authors using again the Schmidt-Kaler (1982) calibrations. Individual distance moduli are given after correcting apparent magnitudes by . We accept , which is completely in line with the rigorous study of the absorption throughout Walraven and infrared photometry developed by Bakker and The (1983) in the region.
The distances obtained are photometric and are subject, therefore, to uncertainties depending primarily on photometric errors. As done in Carraro (2011), we analyze the impact of these errors on distances by starting with the well known expression for the distance modulus:
| (1) |
A simple error propagation leads to:
| (2) |
Assuming that , where and directly come from photometry. In the final error computation we adopt .
The results of this procedure yielded about 600 stars with intrinsic parameters and distances as indicated in Tables 2 and 3 in a self explanatory format. Inspecting the errors in distance in the same tables, it follows that typical errors are about 20%, quite reasonable for the method and of the same order of the obtained by the usual ZAMS (e.g. Schmidt-Kaler 1982) superposition. We want to emphasize that the assignment of spectral types entirely rests on the star positions onto the CCD (Carraro 2011) as if they were single stars. We recall that some of them may be undetected binaries or unresolved double stars what introduces another source of distance uncertainty due to altered colors and magnitudes. Even if we deal with true single stars having MK spectral types this is not enough to reduce uncertainties in distances since the MK classification and therefore the assigned may vary from author to author (see cases of different classification in Tables 2 and 3). Finally, it is evident that even amongst the stars located along the reddening line for B5-type stars there is still a chance of contamination by intrinsic data scatter of some reddened A-type stars. Therefore, and in an attempt to minimize wrong star inclusions, we restrict the spectroscopic parallax method to those stars in the range from B4.5 to O-types (unless otherwise stated). We are confident that, despite the errors, our large data sample will clearly reveal the main properties of the stellar populations in the region of Trumpler 27.
3.2 Discussion on spectral types and distances of some stars
Here we briefly discuss the nature and parameters of a few
particular stars listed in Tables 2 and 3 for which distances have
been derived using the spectroscopic parallax method. We focus
mainly on some stars for which MK spectral types and
thin-prism classification comes from the literature. We also
discuss briefly some potential variable stars. We refer to
all these stars
using the identification given in MFJ77.
Star 1: MDEW01 confirm the oldest spectral type, M0Ia, given
by MFJ77. It is also a suspected variable (NSV 22849) as indicated
by Samus et al. (2010). The distance of 1.8 kpc has been
derived under the assumption that it is not a variable. Additional information
on this objects is commented later when using infrared data.
Star 2 (LSS 4253): the old spectral type from MFJ77, O9Ia,
turns out to be B0Ia according to MDEW01 with no indication about
membership. This last spectral type and our new
photometry locate it at almost 7 kpc from the Sun, outside any
reasonable distance limit
given for Trumpler 27 in the literature.
Stars 8, 10, 12, 19, 20, 21, 25 and 30, all have
thin-prism plates classification in MFJ77 (a
classification technique that indicates whether a star is a
potential OB star) and none of them were studied spectroscopically
by MDEW01. In most of these cases they were classified as
potential OB stars with different degrees of accuracy as seen in
Tables 2 and 3. Our procedure confirms the MFJ77 thin-prism plates
classification approximation as they resulted of photometric
spectral types O4, O7, O8.5, B0.5, B1.5, B1, O4 and O6-types, respectively.
Star 16 (LSS 4263): the early spectroscopy gave
O9.5 II: but changed to B0.5 Ia after MDEW01. The new spectral
type and our photometry locate it at a distance of about 7 kpc.
Star 23: The spectral type determined by
MFJ77, B0.5Ia, was changed to B0.7Ia after MDEW01. This star is
also known as V1082 (Samus et al. 2010), a probable eclipsing
variable. We derived a distance of 3.5 kpc but if it becomes a
true binary star, the distance could be reduced to 2.6 kpc in the
most favorable case of similar masses.
Star 44: this star is a B1.5Ia according
to MDEW01 who have given concluding spectroscopic
arguments favoring it is a supergiant star and not a giant
one as stated in MFJ77. In view of the distance of 2.5 kpc they
computed for Trumpler 27, they assumed this star is not a cluster
member, an assertion we agree with because the distance we obtain
with our photometry is about 16 kpc from the Sun. Even if
we assume it is a binary star its distance would
still be more than 10 kpc away from the Sun.
The WR stars: on one side, star 28 (WR 95) was
classified WN5 by MFJ77 and WC9 by MDEW01; we adopted here this
latest and modern classification. On the other side, star 105
(HDE 318016) is a WC7/WN6 following MDEW01. Conti and
Vacca (1990) reported distances of 2.8 kpc for the WC9 and 2.4 kpc
for the WC7/WN6 that were adopted by MDEW01 in their analysis. To
deal with these two complex stars we proceeded to derive their
intrinsic colors by means of the relationship between the
Smith (1968) and systems as given in Lundström &
Stenholm (1984). According to the relationship given in this last
paper, it was assumed for the WC9 (WR 95) and
for the WC7/WN6 (105) while the absolute
magnitudes were taken from the newest values given by van der
Hucht (2001). Excesses of color obtained using the relationships
of Smith (1968) were for WR 95 and 1.4 for star
105. Finally we derived distances of 2.2 for WR95 and 3.5 kpc for
star 105 that we will use in the analysis next section.
Star 107 (LSS 4257): it was classified B0V by
MFJ77 but the new spectral type from MDEW01 drastically changes
the point by setting this star as a supergiant of a later type,
B0.5Ia. As in the previous case of star 44, they concluded
this is another non-member star. We agree since our distance
sets this star at more than 10 kpc from the Sun. Even in case of
binarity, its distance would be reduced to 7.6 kpc,
too far from any previous estimate of the cluster distance.
Star 102 (V925 Sco, HD159378): this is a variable star with no well established period from to more than and light variation of a few tenths of a magnitude (Samus et al. 2010). Since, according to van Genderen (1980), it may not be a Cepheid variable of Pop I, we treated it as a G0 supergiant star and derived a distance of 2.4 kpc not far from the 2.1 kpc given by MFJ77. Parthasarathy & Reddy (1993) placed this object at 3 kpc from the Sun but they gave no precise indication on the way they got their reported distance.
4 Hunting for Trumpler 27
We made an attempt to use proper motions in the area of Trumpler 27 from the UCAC3 data-base (Zacharias et al. 2010). The putative distance (at 2-3 kpc from the Sun) and the crowding of the region towards the Galactic center made the exercise useless. Errors in both proper motion components are large and no feature can be detected. This is exactly as in Moni Bidin et al. (2011), where three possibly new globular clusters are discussed toward the Galactic bulge using data from the VISTA VVV survey (Minniti et al. 2011). As in that case, proper motions are so scattered that we even restrain from showing the results.
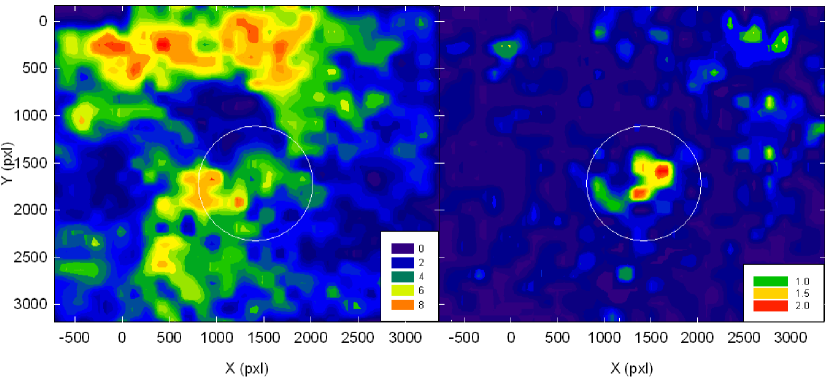
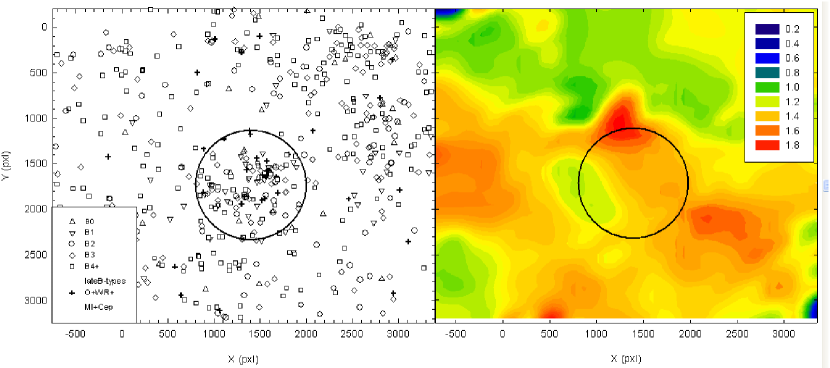
In previous papers we have explained (see e.g. Vázquez et al. 2010) that instead of using star density profiles to set the cluster boundaries we prefer to look for the zone of higher star density in a contour plot. Indeed, density profiles reduce an open cluster -irregular in shape by definition- to a centrally peaked spherical stellar density distribution. On the contrary contour plots reveal details of the impact of absorption on the cluster shape and allow to define the boundaries in a more realistic approach. The procedure works well in areas where the absorption is high like the one in this paper. As in the case of a radial density profile we set the size of a cluster to the area enclosed when the contour plot reaches a flat value. Notwithstanding and for the sake of completeness of the present analysis, in the next section we shall examine the infrared density profile. Meanwhile, Fig. 6 (left panel) shows the contour plot ( arcmin box using the Kriging gridding method) generated with more than 9000 stars detected in the region of Trumpler 27. The full contour plot shows no star overdensity at all in the place where the cluster is assumed to be (the bright stars near the center of the mosaic in Fig. 1). Overdensities are detected north and south of the location of the cluster center confirming what a simple eye-inspection shows in Fig. 1. Actually, the lack of a notorious overdensity right there suggests that Trumpler 27 has been detected for being handful of bright stars well detached from the rest by dust clouds. This is better shown in the right panel of Fig. 6 which displays the contour map generated only with all early-type stars of Trumpler 27 included in Tables 2 and 3 (spectral types down to B4.5). The circle in this panel has 600 pxl radio, just over 4 arcmins and surrounds entirely the weak overdensity emerging at the position of the cluster. That is, the contour map in the right panel shows that the cluster is just a handful of early stars separated by a thick dust ring from other similar groups in the region. Figure 7, left panel, displays stars in Tables 2 and 3 according to their spectral types, describes clearly the above assertion. Note that the stellar density in this region cannot be assumed different from that north-west and west. The role played by the absorption is also well depicted by the contour map of excesses built in the right panel of Fig. 7 with the values listed in the tables. Here we see that reddening varies in the range from 1 to more than 2 mag across the surface with higher values in a wide band from the south- south-west to the north-east that separates the diverse groups seen in the left panel. A comparison of the right panel in Fig. 7 and the left panel (all stars) in Fig. 6 suggests that a vast fraction of the A-type stars surveyed in the area may be immersed in the dust and just a few of them together with others of later types are likely located in front of the dust clouds. Otherwise, the overdensities seen north and south-east in the left upper panel should disappear in this plot.
The zone of Trumpler 27 was included by Bitran et al. (1997) in a CO survey focused in a dozen degrees around the Galaxy center. The cluster is not only immersed in a region of large CO emission but, most interesting, it is projected against a zone of extremely high absorption as shown in map 222 made by Neckel and Klare (1980). This alone justifies the appearance of our CCDs in Fig 5 where potential A-F-type stars start with little absorption to end up, at , completely immersed in the dust clouds. Likewise, the latest spectral type stars in the field have to be necessarily nearby stars since they are intrinsically too faint and do not appear much affected by reddening.
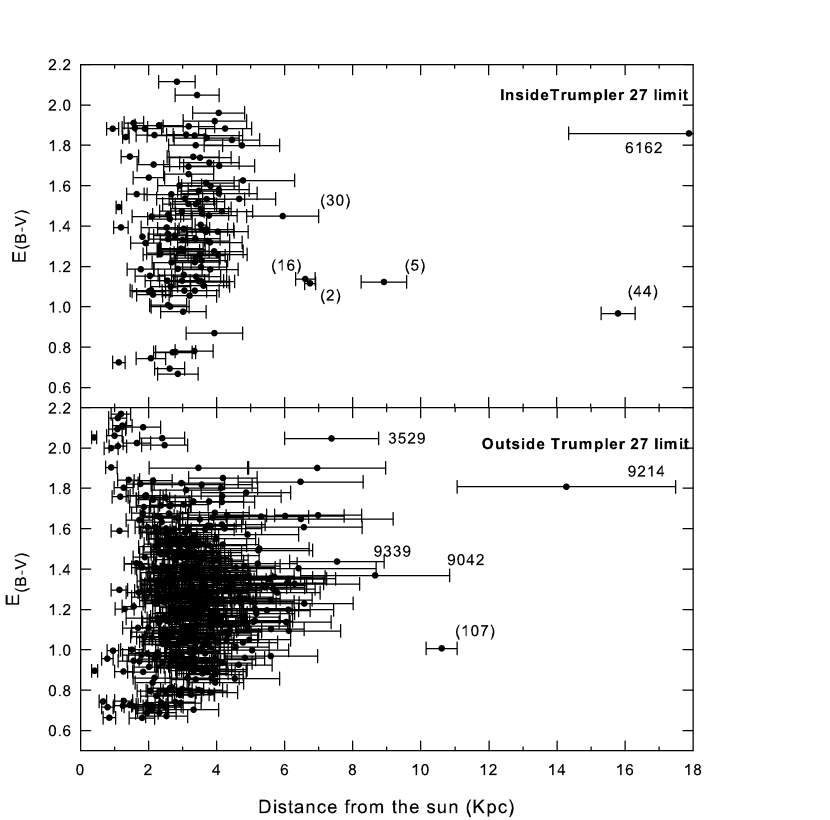
Figure 8 traces the path of reddening with distance inside and outside the cluster boundaries. Error bars coming from Eq. (2) are also shown. It is worth mentioning briefly the impact of distance errors into our analysis. We discussed in previous section the meaning of distance errors which are mainly based on the propagation of photometric errors which are random in nature. Fig. 8 shows the trend of our sample of stars toward the Galaxy center and we do not see that errors can modify any of our conclusions. When looking through the core of the Trumpler 27 region the bulk of early type stars extends for more than 4 kpc while some others may reach 9 kpc and even more than 15 kpc as indicated. Something similar happens outside the 600 pixels limit with some stars located at large distances too. The reddening behavior shown in this figure is well in line with the above mentioned absorption map 222 from Neckel and Klare (1980). Map 222 and nearby ones show that absorption increases after 0.5 kpc from the Sun, rises up to 5-6 mag in the next kiloparsec and keeps high up to 4-5 kpcs towards the Galaxy center. Our deeper and extended sample of young stars not only confirms findings of Neckel and Klare (1980) but also states strong absorption variability all across the region with mag meaning more than 6 mag of visual absorption. Fig. 8 shows too that dust clouds are not a local phenomenon but they are presents for several kiloparsecs starting near the Sun and spanning over 4 kpc (at least) towards the center of the Galaxy.
Histograms for different spectral types as a function of distance for both regions are shown in Fig. 9. Left and right panels are for stars inside and outside Trumpler 27, respectively. The upper panels include O-. WR-, B0- and late type supergiants. Mid panels is for B1-B2- type stars and lower panels is for B3-B4- types. For the sake of an easy visualization, we restricted the plot to all the stars up to 7 kpc from the Sun.
In terms of confirmed spectral types, we found that 19 stars out of 126 inside the cluster limits have some type of spectral classification (MK or objective prism) from Massey and/or MFJ77 including O- and B-type stars and one WC9 star; the supergiant star No 1 belongs to this zone. Outside the cluster radius there are 501 early type stars; 9 of them, including the G0 Cepheid variable, have spectral analysis: one WC7/WN6, one O8.5III and one early B-type supergiant.
Inside the cluster limits O-type stars are seen nearly at all distances. The rest of stars show a narrower distribution beyond 1.5 kpc from the Sun. Late dwarf B-types are lacking in the first 1-1.5 kpc probably because of dust but also because of an statistical artifact. The lack of them at larger than 4-5 kpc is mainly due to a combination of extinction and intrinsic faintness of these spectral types. In the left panels there seems to be two peaks, one at 1-1.5 kpc and the other -higher- at 3.5 kpc. The 1-1.5 kpc peak is not far from the estimated distances by The and Stokes (1970) and Bakker & The (1983) for Trumpler 27 although it is a bit far, however, from the 2.1 and 2.5 kpc given by MFJ77 and MDEW01, respectively. A more refined analysis indicates this peak contains about 20 stars including three O-type stars at kpc. and six other hot stars with distances between 0.9 and 1.6 kpc. The rest of the stars of photometric B-types (eight of them have evolved MK types) spread over distances from 1 to 2 kpc. Three of them with confirmed evolved MK types are in a distance range between 1.1 and 1.7 kpc. The M0Ia supergiant star is placed at 1.8 kpc in our distance estimation but since colors of extremely red stars may be quite uncertain it is likely located at the same distance than the others. The WC9 star, placed at 2.2 kpc, is unlike to be related with this star group. The mean distance of all the stars in this stellar grouping (allowing for distance errors) is kpc. This is almost 1 kpc below the value derived by MDEW01. Compared to other distances computed for Trumpler 27, it is 0.5 kpc less than the one estimated by MFJ77, 2.1 kpc, and about 0.5 kpc larger than another value given by The & Stokes (1970), 1.1 kpc, but is in good agreement with the distance published by Bakker & The (1983), 1.6 kpc from the Sun. However, the simple grouping by itself -with huge distance spread- does not indicate the presence of a true open cluster as we shall see later on. If we look outside the region of the location of Trumpler 27 in Table 3 we find only 35 stars sharing a similar distance range.
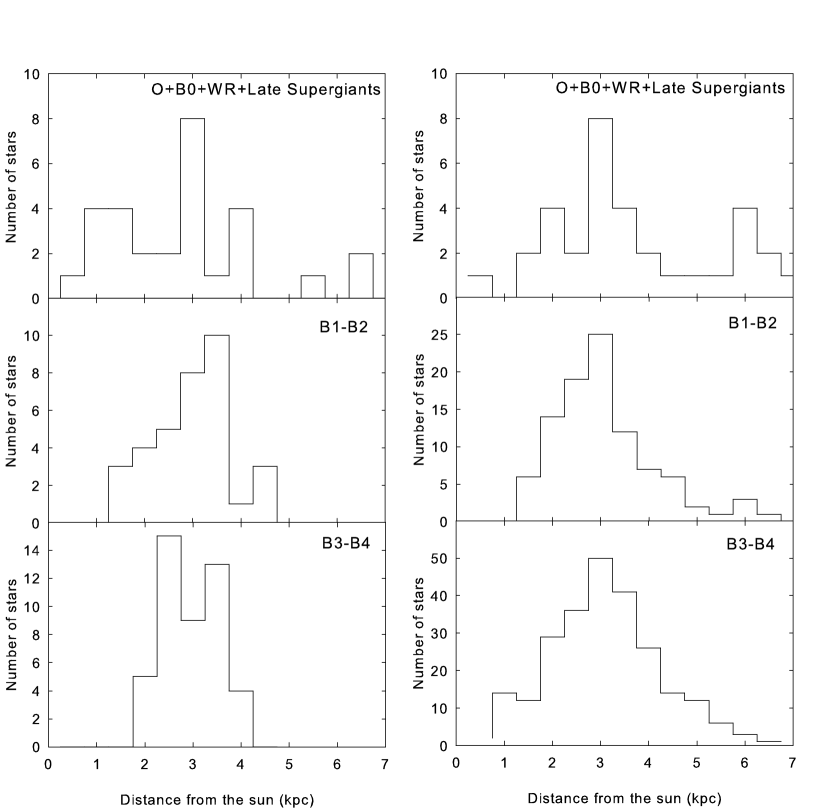
Regarding the second star peak at 3.5 kpc seen in the direction to Trumpler 27 core, it is quite far from the distance 2.1 and 2.5 kpc given for Trumpler 27 by MFJ77 and MDEW01. Moreover, it is wider than the first one and tends to show some kind of coincidence with the evident peak of stars outside the cluster region at the same distance approximately (see right panels in Fig. 9). In this distance range from 3 to 3.5 kpc there are more than 110 stars outside the potential cluster core including 3 stars of O-types and one B-type supergiant out of 27 stars with MK types. The WC7/N6 and the G0I stars, both at 2.4 kpc approximately, are probably not related with this second peak of stars either.
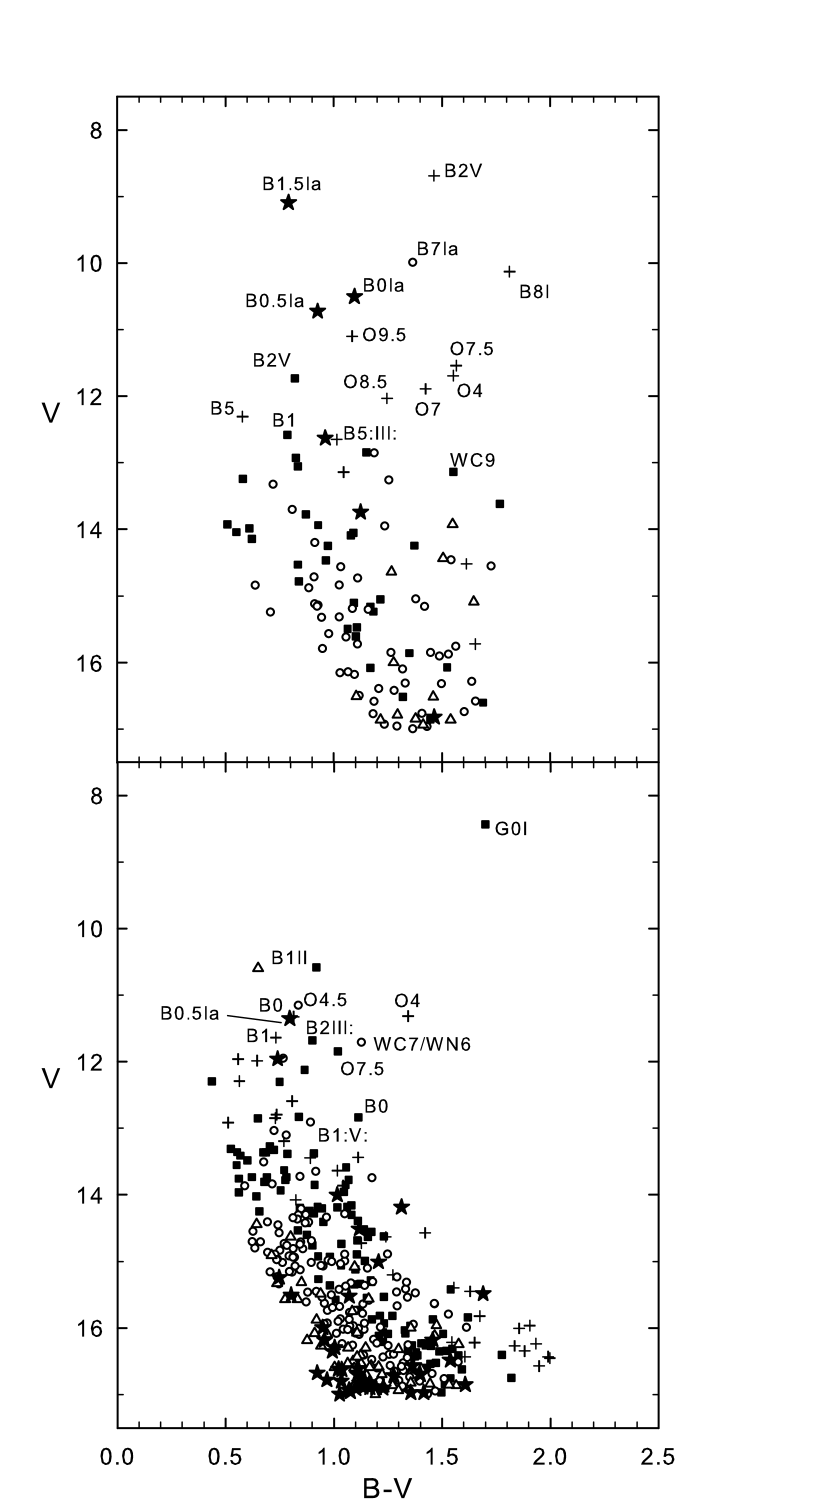
The histograms of Fig. 9 are conclusive in the sense that early type stars are found at any distance inside and outside the cluster region. That is why, in our opinion, different authors arrive at different conclusion about members and distances of this putative open cluster. An additional proof is provided by the observed CMDs of early type stars found inside and outside the cluster boundaries shown in Fig. 10. Here stars have been identified with different symbols according to their distances and immediately arises that any combination of them may produce a believable CMD. In particular, the stars in the 3-4 kpc range are responsible for the left envelope and high density of both CMDs while the most dispersed stars are those belonging to the 2-3 kpc range. To be remarked is that inside the limits, where it is assumed Trumpler 27 to exist, the upper part of the CMD is composed by stars as near as 2 kpc and as far as more than 5 kpc from the Sun.
From the above analysis we conclude then that the evidence is not conclusive enough to clearly establish the true nature and location of Trumpler 27. There is no doubt here that we are dealing with a diffuse young population of stars distributed all along the line of sight with some stellar clumps including all types of bright stars.
5 Infrared information
Infrared data provided by the GLIMPSEII spring’08 (highly reliable) catalogue was cross-correlated with our optical catalogue to get 2MASS and IRAC 3.6, 4.5 and 8 m data. In particular, data was used to perform an additional search for Trumpler 27 as can be seen in Fig. 11 (down to mag). Using all stars in the GLIMPSEII catalogue which lie inside the boundaries of our observed frames, a radial density profile was constructed as shown in the upper left panel of Fig. 11. The profile gives the number of stars per square arcmin computed as the number of stars found in concentric annuli 1 arcmin wide starting at the current adopted cluster coordinates given in §1. Error bars are Poisson errors (computed as with the number of stars per square arcmin). The panel confirms that the cluster is only an artifact produced by the evident dust ring around the center as shown by the pronounced dip at 3 arcmin from the center. This is the same shown in Fig. 6, left panel. Apart from the dip the star density profile is essentially plain, within the Poisson errors, showing no evidence of a star clustering.
Close to star No 1 and 1b (MDEW01 numbering) there exists the maser source OH355.1-0.76 measured by Knapp et al. (1989) in their circumstellar CO emission survey. Unfortunately they give no further information on this object since and it was discarded due to the strong contamination caused by galactic CO emission over a wide range of velocity. We assume that, probably, the supergiant star No 1 is the optical counterpart of this object since that, in turn, is also a suspected variable (Samus et al. 2010). Across the area surveyed in this article we found optical counterparts of two YSO candidates (Nos 5338 and 5269 in our numbering, corresponding to 2MASSJ17362441-3331289 and 2MASSJ17362515-3325521 sources, respectively) and another star (No 1796, our numbering) with huge infrared excess.
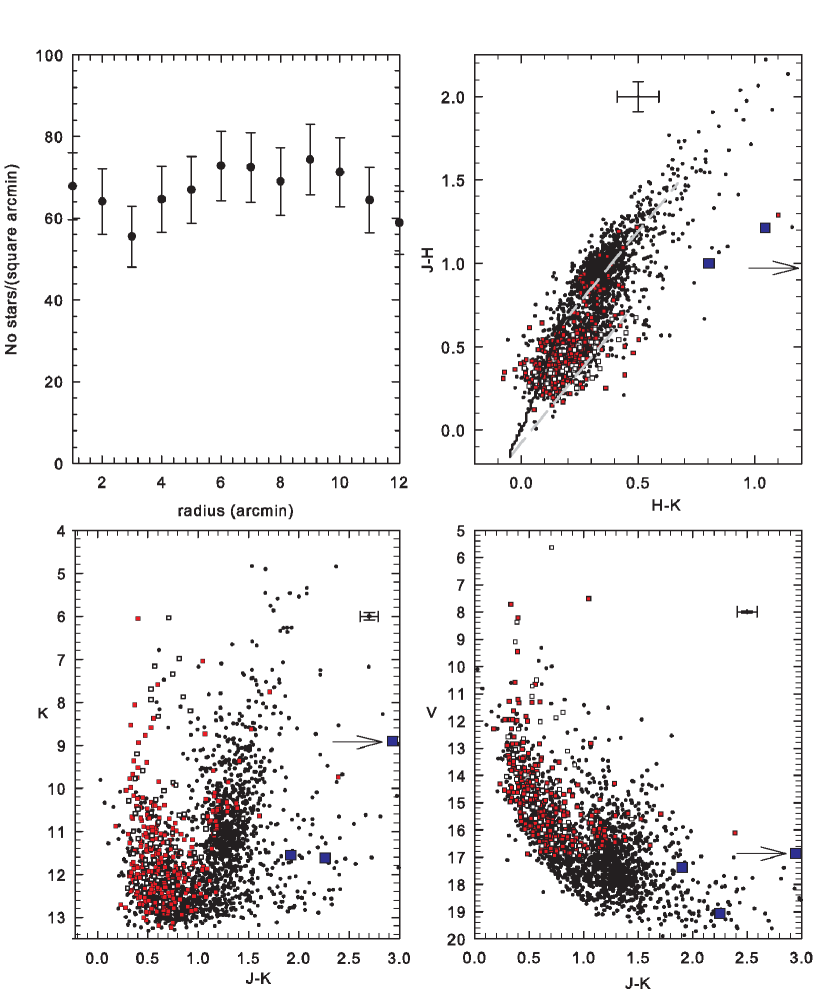
Upper right panel in Fig 11 is the overall two color diagram. The intrinsic relation from Koornneef (1983), solid black line, and the 6 mag reddening vectors , gray dashed lines, for early and late type stars are indicated. We have superimposed stars earlier than B5 inside 600 pxls radius (white squares) and outside these limits (red squares). Despite the fact that data scatter is strong and typical infrared errors are large, this diagram confirms that stars in the region of Trumpler 27 are affected by strong variable reddening and shows no indication of a clear cluster sequence. Indeed, the spread of the data inside 600 pxl is similar to the one shown by the other early stars outside this limit. Large blue squares and the arrow show the position of the YSO candidates above mentioned and the star No 1796. It seems that more objects in the zone exhibit large infrared excesses. The other two lower panels are the and color-magnitude diagrams. These two diagrams show the same pattern found in Fig. 4 in the sense that no clear cluster sequence emerges from them and no evidence of a pre-main sequence is revealed. The illusory vertical strips seen in the are composed by stars at very different distances inside the 600 pxl radius and also outside that limit. Actually, with no other information available to impose boundary conditions (as the one provided by the CCD in Fig. 4 and MK types) it would be possible to confuse the vertical strip with the upper sequence of an unreal cluster. For the sake of completeness we have also plotted 3.6, 4.5 and 8 data in the adequate diagrams (not shown to save space) and, again, no evidence for a cluster has been found in any of them.
6 The region toward and the inner spiral structure of the Galaxy
The presence of over 600 stars of very early spectral types in a small sky area of a quarter of square degree located in a continuous range of distance up to 7 kpc at least from the Sun is an exciting result of our survey that connects this young diffuse population to the inner Galactic structure. In the traditional model of four arms for the galaxy (Russeil 2003, Vallée 2005) moving from the Sun location inwards -in the region of Trumpler 27- there should be Sagittarius-Carina arm, Scutum-Crux arm, Norma and the Near 3 kpc-arms at 0.6, 3, 4 and 5 kpc respectively. In the proposed recent view face-on of our galaxy (Churchwell et al. 2009), the cross with Sagittarius-Carina arm should happen at 1.6 kpc. In particular, this arm looks weak and narrow; this is, the arm is tiny and not very prominent. In the same sketch the Scutum-Crux arm is located at 3.2 kpc and becomes the most prominent feature of the inner galactic structure. The Norma arm is another tiny structure intersected at 4.4 kpc and, finally, the Near 3 kpc arm at over 5 kpc is the less pronounced of all the features. A recent map of the Milky Way has been presented by Lépine et al. (2010) where the traditional four arm structure is abandoned and replaced by polygonal arms described by molecular CS associated with IRAS sources. Given the complex structure proposed by Lépine et al. (2010) we prefer to compare our findings with the traditional description (e.g. Russeil 2003).
In terms of the stellar components, mainly O-B3-type stars and open clusters associated with the grand design spiral structure, the information is scarce as shown by Russeil (2003). The OB type stars catalogue recently compiled by Reed (2003) has been used by Carraro (2011) to highlight the spiral structure around the Sun. Fig.1 in Carraro (2011) demonstrates that only O-type stars show some sort of clear coincidence with spiral arms of the Galaxy while B-type stars, on the contrary, show a smooth distribution up to the reach of the survey made by Reed (2003). Carraro (2011) also emphasizes the lack of coincidence of the star sample (O- plus B-types) with the trace of Scutum-Crux. In the direction we are dealing with, the Reed (2003) catalogue scarcely reaches 5 kpc from the Sun while the number of confirmed (spectroscopically) O-type stars by Maíz-Apellániz et al. (2004) -complete only to mag- indicates that very few confirmed stars of this type are found in the direction where Trumpler 27 is located.
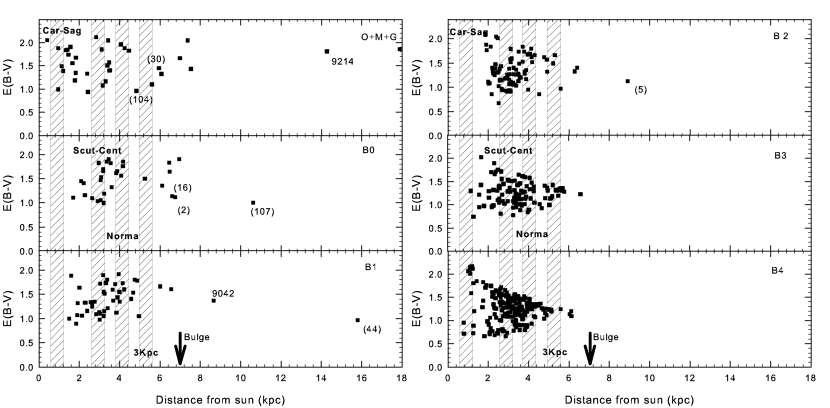
Returning to our data sample we have included stars of Tables 2 and 3 in the distance vs plot of Fig. 12 up to 18 kpc from the Sun. In the figure we also have marked the distances to which the spiral arms of the Galaxy should be located approximately according to the current accepted model of four arms and their respective widths. We briefly recall that while arms separation is of the order of 3 kpc the width of them is quite uncertain. We set arms widths in Fig. 12 using the value of about 1 kpc given by Vallée (2005). Accepting that Sagittarius-Carina is at less than 1 kpc in the direction we found very few stars associated with this spiral arm, mostly O and B3-B4, while the bulk of young stars tend to gather at the distance where Scutum-Crux and Norma arms are set. The plots in Fig. 12 are in line with Fig. 1 shown by Carraro (2011) in the sense that very young stars do not define conclusively the trace of inner spiral arms but are distributed evenly across several kiloparsecs toward the center of the galaxy. This is a singular difference with radio observations. In fact, maps of the HI and CO contributions suggest that these arms are discrete and well outlined structures, Scutum-Crux being one of the major of them moving toward the inner galaxy.
The recent study by Dame & Thaddeus (2008) collected specific and irrefutable evidence of the presence of the distant counterpart of the Near 3 kpc arm based in CO and previous observations in HI. The authors estimated that distances from the Sun for both arms are 5.1 and 11.8 kpc for the Near 3kpc arm and the Far 3 kpc arm, respectively. It is worth mentioning that stars at all spectral types (also one O-type) can be found in or close to the Near 3 kpc arm in Fig. 12. If the tendency in our sample is correct, for the first time we are looking at components of a very recent star formation process there. From the point of view of our findings the relation between the young population and the Near 3 kpc arm is not controversial. As Dame & Thaddeus (2008) show, the Near 3 kpc arm extends mostly below the galactic plane at the location of Trumpler 27 and therefore, part of the young stars in our sample may be spatially connected with this arm. There are stars even farther in this region (at more than 8 kpc) that have no chance to be related with the Far 3 kpc arm since it extends mainly above the galactic plane.
From our study, based on an extended sample of early type stars detected photometrically, we find it hard to establish the relation of the inner spiral arms with our stellar population. While the gas component is expected to trace the path of every inner arm by means of discrete structures of molecular CO and HI, stellar distances of young stars do not. Fig. 12 allows us to assure that the trend of the young diffuse population extends all along 7 kpc towards the center of the Galaxy but by no means can we specify the position and distance from the Sun of each arm. This difficulty arises from a combination of distance uncertainties with geometrical circumstances. In fact, despite the process of star formation is active and vigorous it is hard to relate it to specific patterns of spiral structure because of a) the tight packing of four arms in such a short distance range and b) our line of sight on the plane is almost at right angles with the spiral structure.
All the circumstances mentioned above are reflected in the radio observation domain. Very recently, Green et al. (2011) have been studying the distribution of methanol masers in the inner galaxy covering the longitude range from -28∘ to +28∘ in longitude. In particular, in the direction of our analysis, they found an enhancement of methanol sources which are comprehensible only as a superposition of contributions from large galactic structures confused by intervening spiral arms along the line of sight. This difficulty is exactly the same we found in this paper.
7 Conclusions
This is the first time that an CCD photometric study is
carried out in the region of the open cluster Trumpler 27 towards
. In order to determine the properties of the stellar
population, we have applied well known broad-band photometric
techniques. Our goal has been twofold: on one side to recognize
the main parameters of the cluster -if it exists- since
several observers in the past arrived at different conclusions
and, on the other side, to analyze the field star population
present in the region, since the same studies underlined the
presence of a large number of bright stars that have no relation
with the cluster itself.
An open cluster is, in essence, a decreasing sequence of gravitationally bound stellar masses well confined in a volume of space. In the case of nearby open clusters, the analysis of proper motions and radial velocities becomes a powerful tool to asses the cluster membership on any star found in the field. As for distant clusters, the way to assess if a star belongs to it is by resting on a spectrophotometric study focused on some sort of stellar overdensity detected against the sky background. In the zone of Trumpler 27 there is neither reliable proper motions -given the distances of the stars in the region- nor appreciable star overdensity even using infrared data as shown in Fig. 11, upper left panel.
From a spectrophotometric point of view we cannot confirm or rule out definitely the existence of the cluster since results of our analysis based on separating early type stars from field stars are not conclusive at all. This is, CMDs showing the same pattern can be constructed with stars at different distances from the Sun neighborhood all the way to the Galactic center. Massive stars of O-type, evolved B-types, M- and G- super-giants plus two WR stars are found at all distances and widely separated -angularly- from each other making it unlikely to connect them, from an evolutionary point of view. The different CMDs in optical and infrared are typical of very young star groups superposed along the line of sight resembling, e.g., OB associations. This could be the reason for the age spread detected by MDEW01 since the entire star group associated historically with Trumpler 27 is composed by stars which did not form in a same event and do not share the same spatial location.
Basing on our data, it is difficult to assess the existence of
Trumpler 27 at the distance, with the members and with the age
derived in previous articles already cited. In addition, we were
unable to find in our diagrams a star sequence composed by faint stars
that could be related beyond doubt with potential massive members of Trumpler 27.
This is a serious obstacle and we find it unlikely that photometry alone could solve
the question in the future. Certainly, the controversy may be
settled by means of an exhaustive spectroscopic study able to reach
also faint stars. An interesting point to interpret, in terms of
star formation too, is the lack of any evident HII region in the
zone as expected in a region of massive star formation.
WR and O-Type stars are usually injecting a tremendous amount of
ultraviolet photons in the surrounding gas which should be seen in
emission but there are no clear traces of emitting gas.
As far as the diffuse young star population is concerned, in the direction , our star sample shows an even distribution. This suggests that early type stars define a continuous superposition of stars with no density peaks from one arm to the next, except for the prominent clump at the location of the Scutum-Crux arm, as seen in Fig. 9.
The findings of this paper can be connected with the ones from Carraro (2011) at . Firm evidence was found there of a young stellar population associated with Carina-Sagittarius and Scutum-Crux arms. Moreover, the existence of an even star distribution in the direction , where arms are more open than in the Galactic center direction, was found. This confirmed the outcome of old (e.g. Muzzio and Levato 1980 and references therein) and more recent (Carraro & Costa 2009, Baume et al. 2009) studies that provided robust optical evidences of their existence and their potential as spiral arm indicators.
However, in the present study which looks towards the center of the Galaxy, four spiral arms are closely packed in only 5 kpc from the Sun. Therefore, the task of disentangling one structure from the next is more cumbersome, and would require the support of an improved radio trigonometric parallax method to measure accurate distances and proper motions of obscured star forming regions in the Milky Way (Brunthaler et al. 2011).
Meanwhile, we believe it is of extreme value to continue our program which aims at studying the inner disk stellar populations using and infrared photometry by extending it to other absorption windows, as in the case of Trumpler 27. Young stellar populations can be very well tracked using photometry and when combined with findings from radio observations, a better picture of large structures can be achieved certainly.
Acknowledgements.
G. Carraro expresses his gratitude to the Las Campanas Observatory staff, and in particular to Patricio Pinto for the excellent support during various observing runs. We also thank Sandy Strunk for reading carefully the manuscript. G. Perren and R.A. Vázquez acknowledge the financial support from the CONICET PIP1359. This research has made use of the NASA/IPAC Infrared Science Archive, which is operated by the Jet Propulsion Laboratory, California Institute of Technology, under contract with the National Aeronautics and Space Administration. We acknowledge useful and constructive comments from an anonymous referee which allowed us to improve the manuscript.References
- (1) Ahumada, J. A.; Giorgi, E. E.; Solivella, G.; Vázquez, R. A. 2011 MNRAS 415, 1355
- (2) Baume, G., Carraro, G., Momany, Y., 2009, MNRAS, 398, 221
- (3) Bakker R., The P.S., 1983, A&AS 52, 27
- (4) Bitran M., Alvarez H., Bronfman L., May J., and Thaddeus P., 1997, A&ASS 125, 99
- (5) Brunthaler, A. et al. 2011 AN 332, 461
- (6) Carraro, G., Costa, E., 2009, A&A, 493, 71
- (7) Carraro, G., Vázquez, R.A., Moitinho, A., Baume, G., 2005, ApJ, 630, L153
- (8) Carraro G., Vázquez, R. A., Costa, E., Perren, G., Moitinho, A., 2010 ApJ 718, 683
- (9) Carraro, G., 2011 A&A 536, 101
- (10) Churchwell E. et al. 2009, PASP 121, 230
- (11) Conti, P. S., Vacca, W. D. 1990 AJ, 100, 431
- (12) Dame T.M., and Thaddeus P., 2008 ApJ, 683, L143
- (13) Hamuy, M., Folatelli, G., Morrel, N.I., Phillips, M.M., et al., 2006, PASP, 118, 2
- (14) Hiltner W.A., Johnson H.L., 1956 ApJ 124, 367
- (15) Green J. A., Caswell J. L., McClure-Griffiths N. M., Avison A., Breen S. L., Burton M. G., Ellingsen S. P., Fuller G. A., Gray M. D., Pestalozzi M., Thompson M. A., Voronkov M. A., 2011 ApJ 733, 27
- (16) Knapp G.R., Sutin B.M., Ellison B.N., Keene J.B., Leighton R.B., Masson C.R., Steiger W., Veidt B., Young K., 1989 ApJ 336, 822
- (17) Landolt A. U., 1992 AJ 104, 340
- (18) Lépine J.R.D., Roman-Lopes A., Abraham Z., Junqueira T.C., Mishurov Yu. N., 2010 MNRAS,
- (19) Lundström I, Stenholm B., 1984 A&AS 58, 163
- (20) Maíz-Apellaíniz J., Walborn N. R., Galué H., Wei, L. H. 2004 ApJS 151, 148
- (21) Marraco, H. G.,Rydgren, A. E. 1981, AJ, 86, 62
- (22) Massey P., DeGioia-Eastwood K., Waterhouse E., 2001 AJ 121, 1050
- (23) McSwain, M.V. & Gies, D.R. 2005 ApJSS 161, 118
- (24) Minniti, D., Lucas, P. W., Emerson, J. P., Saito, R. K., Hempel, M., Pietrukowicz, P., Ahumada, A. V., et al. 2010, NewA 15, 433
- (25) Moffat A. F. J., FitzGerald M. P., Jackson P.D. 1977, ApJ 215, 106
- (26) Moitinho, A., Vázquez, R.A., Carraro, G., Baume, G., Giorgi, E.E., Lyra, W., 2006, MNRAS, 368, L77
- (27) Moni Bidin, C., Mauro, F., Geisler, D., Minniti, D., Catelan, M., Hempel, M., Valenti, E., Valcarce, A. A. R., et al. 2011, A&A, 535, 33
- (28) Muzzio, J.C., Levato H. O. 1980 PASP 92, 36
- (29) Neckel Th., Klare G., 1980 A&ASS 42, 281
- (30) Parthasarathy M., Reddy B.E., 1993 ASIB 21, 619
- (31) Patat F., Carraro G. 2001 MNRAS 325, 1591
- (32) Reed, C. B., 2003, AJ, 125, 2531
- (33) Russeil, D., 2003, A&A 397, 133
- (34) Samus, N. N., Kazarovets, E. V., Kireeva, N. N., Pastukhova, E. N., Durlevich, O. V., 2010 Odessa Astronomical Publications, 23, 102
- (35) Schmidt-Kaler, T. 1982, Landolt-Börnstein, Group VI, Vol. 2b, Stars and Star Clusters (Berlin: Springer), 15
- (36) Skrutskie, M. F., Cutri, R. M., Stiening, R., Weinberg, M. D., Schneider, S., Carpenter, J. M., Beichman, C., Capps, R., Chester, T., Elias, J., et al. 2006 AJ 131, 1163
- (37) Smith L.F., 1968 MNRAS 140, 409
- (38) Stetson P. B., 1987 PASP 99, 191
- (39) The P.S., Stokes N. 1970, A&A 5, 298
- (40) Vallée, J., 2005, AJ, 130, 569
- (41) van der Hucht K. A., 2001, New Astronomy Reviews 45 135-232 The VIIth catalogue of galactic Wolf-Rayet stars.
- (42) van Genderen A.M., 1980 A&A 88, 77
- (43) Vázquez, R. A., May, J., Carraro, G., Bronfman, L., Moitinho, A., Baume, G., 2008, ApJ, 672, 930
- (44) Zacharias, N., Finch, C., Girard, T., Hambly, N., Wycoff, G., Zacharias, M. I., Castillo, D., Corbin, T., et al. 2010, AJ 139, 2184