Natural Emergence of Clusters and Bursts in Network Evolution
Abstract
Network models with preferential attachment, where new nodes are injected into the network and form links with existing nodes proportional to their current connectivity, have been well studied for some time. Extensions have been introduced where nodes attach proportionally to arbitrary fitness functions. However, in these models, attaching to a node always increases the ability of that node to gain more links in the future. We study network growth where nodes attach proportionally to the clustering coefficients, or local densities of triangles, of existing nodes. Attaching to a node typically lowers its clustering coefficient, in contrast to preferential attachment or rich-get-richer models. This simple modification naturally leads to a variety of rich phenomena, including aging, non-Poissonian bursty dynamics, and community formation. This theoretical model shows that complex network structure can be generated without artificially imposing multiple dynamical mechanisms and may reveal potentially overlooked mechanisms present in complex systems.
pacs:
87.23.Ge, 87.10.-e, 89.75.Hc, 89.75.Fb, 89.20.HhGrowing network models have been introduced to study the topological evolution of systems such as citations between scientific articles de Solla Price (1976, 1986); Redner (2005); Medo et al. (2011), protein interactions in various organisms Eisenberg and Levanon (2003); Albert (2005), the World Wide Web Barabási and Albert (1999), and more Albert and Barabási (2000); Newman (2010). Meanwhile, recent interest has been drawn towards understanding not simply the topology of these systems or how the individual system elements interact, but also the temporal nature of these interactions Holme and Saramäki (2012). For example, studies of the burstiness of human dynamics Barabasi (2005); Goh and Barabási (2008), whether by letter writing Oliveira and Barabási (2005) or mobile phone usage Jo et al. (2012), have advanced our knowledge of how information spreads Granovetter (1973, 1978); Watts (2002) through systems mediated by such dynamics Karsai et al. (2011, 2012); Jo et al. (2012).
One of the most successful mechanisms to model growing networks remains preferential attachment (PA) Simon (1955); Barabási and Albert (1999). The original PA model starts from a small seed network that grows by injecting nodes one at a time, and each newly injected node connects to existing nodes. Each existing node is chosen randomly from the current network with a probability proportional to its degree: , where is the degree, or number of neighbors, of node . This “rich-get-richer” mechanism leads to scale-free degree distributions, , where the earliest nodes will, over time, emerge as the wealthiest hubs in the network, accruing far more links than those nodes injected at later times. This strong early-mover advantage is one of the most striking features of PA.
PA alone cannot account for topological and statistical features observed in real networks such as dense modular structures Girvan and Newman (2002) and high clustering (the abundance of triangles beyond what is expected by chance) Watts and Strogatz (1998), and its most significant feature, the scale-free degree distribution, collapses in equilibrium situations (in which node injections are balanced by node removal) Moore et al. (2006). However, the success of PA is the identification of a minimal set of mechanistic ingredients (growth, degree-driven attachment, and thus positive feedback) that are required to account for a universal feature abundant in many real systems.
PA has thus been the basic starting point for more complex models that generalize the approach to include fitness variables Bianconi and Barabási (2001); Medo et al. (2011) and temporal correlations Golosovsky and Solomon (2012) to account for higher clustering and community structure observed in real-world scale-free networks.
Here, inspired by the simplicity and generality of PA, we address the following general question: What are the dynamic and topological consequences if the attachment propensity of incoming nodes is determined by a target node’s neighborhood instead of its pure degree. Although this type of modification of the original PA model is small mechanistically, we show that the dynamic consequences are substantial. Our model exhibits emergent aging and temporally correlated dynamics, and it naturally possesses negative feedback in the attachment propensity of existing nodes. Numerical investigations supported by theory show that these effects are controlled entirely by the attachment process. No additional, artificially imposed rules are necessary.
We adapt the original preferential attachment network growth model in the following way. Instead of attaching to an existing node with probability proportional to its degree , we attach proportional to its clustering coefficient (clustering attachment, or CA)
| (1) |
is the clustering coefficient of node , is the number of links between neighbors of or, equivalently, the number of triangles involving node , is a constant probability for attachment (which may be zero), and the exponent is a parameter in our model. Other aspects of network growth remain the same. (We assume each new node attaches to existing nodes throughout; the features are the same for , but calculations become more cumbersome.) We investigate both growing and fixed-size evolving networks. For the latter, a random node is removed every time a new node is added.
For the original PA mechanism, the only possible “reaction” upon attaching to is to increment its degree, i.e., . For CA, however, two reactions are possible: or . While the degree always grows, the number of triangles around depends on whether a neighbor of also receives a new link.
These two reactions lead to the following potential changes in the clustering coefficient of the existing node before and after the attachment:
| (2) |
Here, is the change due to connecting to and a neighbor of , while is the change due to connecting to and a non-neighbor of . Even when a new triangle is formed, the clustering coefficient after an attachment is almost always less than it was before: An increase in after a new node’s attachment is only possible if the existing node has degree . This means that, in contrast to PA, the CA mechanism does not feature rich-get-richer effects. Instead, attaching to a node drives down ’s probability for further attachments. A pure CA system will not exhibit a power-law degree distribution because negative feedback prevents the emergence of hub nodes. Instead, networks grown according to CA exhibit an exponential tail in the degree distribution. Forming new links based on the clustering coefficient provides a particularly simple model of such negative feedback or preferential inhibition.
Yet, temporal effects play a role here as well, with the temporal sequence of node injections determining what happens to subsequent nodes. For example, suppose a new node is injected and happens to form a triangle. This will give that new node maximum ; it may become a hot spot for future attachments. In Fig. 1a we draw a single realization of the CA model with nodes and . Qualitatively, we observe that CA dynamics naturally gives rise to community structure Girvan and Newman (2002), where the hot spot forms the seed for a new dense group to grow. These communities tend to form sequentially: A hot spot forms and then many nodes attach to it, driving its attractiveness down until another seed appears. This repeating process emerges naturally from the attachment mechanism; nothing has been artificially imposed.
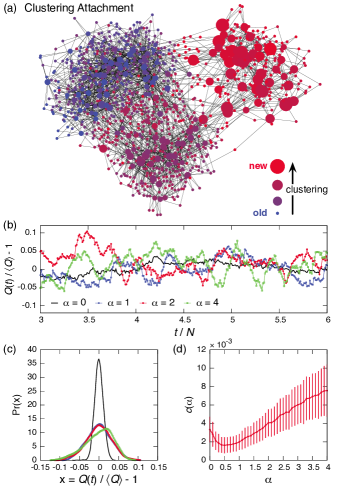
We quantify the presence and evolution of these communities by running a community detection method Blondel et al. (2008) as a network evolves according to CA. Figure 1b depicts the optimized modularity of the communities found by the method. Higher values of can be used to indicate “better” communities Newman and Girvan (2004). However, raw values of should be interpreted with caution, as can become very large due only to sparsity in the network Reichardt and Bornholdt (2006); Bagrow (2012). Instead, in Fig. 1b we plot modularity relative to its average value over the evolution of each CA realization. We see distinct fluctuations in that are not present in the case of a random network () [Fig. 1c]. These fluctuations are due to the sequential growth and decay of communities: A dense community forms, boosting ; then it becomes sparser as more nodes attach to the community, lowering until a new community forms and the process repeats. These fluctuations are present for both growing and stationary networks. Further, in Fig. 1d we plot the average clustering coefficient as a function of . Clustering is another hallmark of modular structure, and it increases as is increased. Taken together, we find that plays a significant role in the modular nature of the model.
CA thus can give rise to both correlated network structure and nontrivial temporal dynamics. An important question, however, is if this behavior is present for the entire range of exponents or if a critical parameter threshold exists. To understand this and characterize the dynamics further, we now explore (i) the aging dynamics of individual nodes after injection, and (ii) the influence that older nodes exert on newly injected ones. For the latter, we fix the size of the CA networks by removing a randomly chosen node alongside each new injection, as per Fig. 1b.
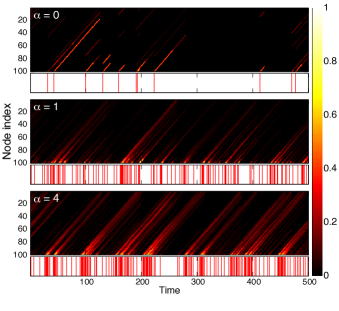
When a new node is injected into the system, its degree and clustering will evolve with the time since injection . This new node may then exert an influence on the time course of subsequent nodes. To see this qualitatively, Fig. 2 depicts “space-time” matrices for three realizations of CA. In this matrix, each column represents the clustering coefficients of the network’s nodes at that time. Nodes are ordered by age. The oldest node is removed and a new node injected such that the time course of for each node forms a diagonal streak across the matrix. Below each matrix a spike train is shown, highlighting the injection times of high- nodes. As increases, the injection times of high- nodes become temporally correlated and the clustering coefficients of those nodes decay more slowly: Both temporal correlations and individual aging effects are affected by the exponent of the CA mechanism.
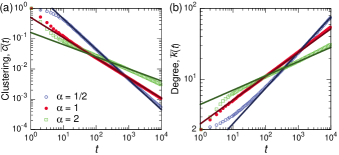
More quantitatively, by averaging over many realizations, we measure the expected time courses and for nodes that are injected with , shown in Fig. 3. These time courses exhibit approximate power-law decay (growth) in time for ().
To understand the time scaling of and , consider the following simple analysis: First, and . Assuming the time evolution of is approximately constant gives or
| (3) |
where follows from . Thus we predict, if the time evolution of is negligible, power-law growth in time for degree with exponent and power-law decay in time for clustering with exponent . Despite the simplicity of this calculation, we find good agreement between simulations and the predicted exponents in Eq. (3); see Fig. 3.
Yet, knowing the expected temporal scaling of individual nodes’ and is insufficient to understand the emergence of the network structures that we observe. We also need to understand the temporal nature of hot-spot injection times. Thus, we turn to the time series of triangle injections, or the times when nodes are introduced with . (For , one can consider the times when new nodes appear with .) These correspond to the injections of high-clustering nodes in Fig. 2.
If a system displays no memory such that the probability for a spike during any time interval () depends only on , then the triangle injections form a Poisson process and the interevent time, or the waiting time between spikes, follows an exponential distribution. Yet, many systems do not follow Poisson processes Oliveira and Barabási (2005); Barabasi (2005). A phenomenon is considered bursty when it possesses a memory; i.e., the probability for a new event decays with the time since the last event giving rise to a nonexponential interevent time distribution.
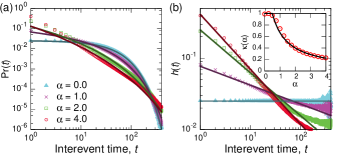
In Fig. 4a, we study the interevent time distribution for triangle injections during CA network evolution. (As mentioned before, to ensure the system is stationary, for the temporal dynamics in Fig. 4 we now fix the size of the network by removing one node at each time step as well.) When , there is no memory and the distribution is exponential, as expected. As grows, however, the interevent time distribution becomes more and more heavy tailed, indicating increased probability for a triangle to form soon after a previous triangle was introduced.
A straightforward way to study bursty dynamics is through the hazard function , where and are the probability and cumulative distributions of waiting time , respectively. The hazard function can be interpreted as the probability rate for a new spike to occur timesteps following the previous spike, given that no spikes occur in the intervening time interval. We measure the hazard functions in Fig. 4b.
For a Poisson process, is constant. Increasing gives increasingly non-Poissonian hazard functions: The CA mechanism naturally incorporates bursty time dynamics in the sequences of triangle injections.
A typical property of bursty systems is a hazard function that behaves algebraically for early times,
| (4) |
with a singularity in continuous time for . The exponent determines the degree of burstiness of the system (with corresponding to the limiting case of a Poisson process) 111An interevent time distribution that gives rise to such an algebraic hazard function is the Weibull distribution . .
We now unify the bursty time dynamics for triangle formation with the aging time courses for node clustering [Eq. (3)]. For an active system in equilibrium, the density of spikes at time should become approximately constant (i.e., independent of time) such that the expected number of spikes emitted in a time interval is proportional to . (This is not the same as a Poisson process, as the expectation is over an ensemble of CA realizations.) Suppose a spike occurred at some past time (without loss of generality, we shift time so that ). Then, assuming spikes are rare, a point we will return to, we approximate the spike density at by
| (5) |
In other words, a spike occurs at , depending on the probability for the most recent preceding spike to occur at (which is itself governed by the hazard function for the spike at ) weighted by the clustering at time .
Given Eq. (5), what hazard function will give rise to a constant ? If , we have
| (6) |
where from Eq. (3) and the second relation follows by introducing a constant to ensure the initial condition and that the integral does not diverge. When , as , and thus we expect an equilibrium system to be a Poisson process for .
When , however, no Poisson process can be in equilibrium for our expected . Instead, a time-dependent hazard function () is necessary:
| (7) |
where the latter holds when . Therefore, the system will be in equilibrium when .
As we mentioned, Eq. (5) is most valid at low spike densities, where the typical time between spikes is much greater than the typical time it takes for to decay. For higher densities, the probability for a new spike to occur at time will depend upon a superposition of earlier spikes. Yet the contributions of the earlier spikes will each be time independent when . Thus, our derivation should hold even at higher spike densities.
In summary, if the above arguments hold we expect an equilibrium system to exhibit a hazard function with
| (8) |
Indeed, there is good evidence for this relationship in the inset of Fig. 4b.
Discussion
While positive feedback has been overwhelmingly studied in complex networks, negative feedback remains ubiquitous in nature. There is much room for modeling network growth besides the traditional degree-based preferential attachment. A simple twist on this seminal work is to form attachments based on the clustering coefficient. Doing so naturally creates a negative feedback mechanism that leads to aging, burstiness, and the formation of community structure in networks. The simplicity and robustness of this mechanism is encouraging and may serve as a starting point for investigating the origin of higher-order structures in growing networks, as well as evolving networks that are in equilibrium. The emergence of communities and highly variable temporal behavior observed in many complex networks, social networks in particular, can be investigated from a CA perspective. Based on our results, it may be promising to investigate systems in which attachment propensities are determined by other centrality measures that capture a different aspect of local network properties.
It is worth considering the potential practical applications of our CA model. In a poorly understood area such as complex systems, hypothetical models such as ours are useful for discovering potentially overlooked dynamical mechanisms and may serve to direct future empirical studies to explore such mechanisms. Here, one can imagine many systems where nodes are drawn not towards hubs, but towards densely connected groups. For example, in a social network, individuals may not want to make friends with a very popular person but, instead, with members of a small group of very closely knit friends. Such hypotheses are becoming testable thanks to the appearance of high-resolution dynamical contact networks and face-to-face proximity data Stehlé et al. (2011); Zhao et al. (2011). Being attracted to density may also play a role in follower-followee networks for flocking or swarming animals Nagy et al. (2010), where individuals may wish to belong to a small but very cohesive group instead of being part of a jumbled crowd all following a single leader (the hub animal).
Another area of interest may be the dynamical evolution of functional brain networks. Indeed, positive feedback is associated with neurological conditions such as epileptic seizures McCormick and Contreras (2001). Recently, it has been shown Vértes et al. (2012) that networks derived from fMRI data are better explained by a model where new connections prefer to complete triangles than by traditional preferential attachment. This model is still quite different from our work. It incorporates anatomical distances in its attachment mechanism, but it demonstrates that clustering can play a role in the evolution of real systems.
Preferential inhibition can also be used to model fads and fashions. For example, music listeners may actively seek musicians that are not well known. This corresponds to attachment probabilities that decrease with increasing degree, of which clustering attachment is one example.
The prevalence of community structure in social systems is not explained by degree preferential attachment alone. Likewise, social networks typically feature exponential cutoffs in the degree distribution, simply because people have limited time with which to maintain social relationships. This may imply that both preferential attachment and preferential inhibition (or, equivalently, density attachment) mechanisms are involved. Mixing some inhibition into the system will both inject community structure and limit the formation of very high degree nodes. Practically, this means that agents in a system are simultaneously drawn towards highly connected regions and densely connected regions. We believe that exploring these combined effects is a very intriguing direction for improving our understanding of such systems.
Acknowledgments
We thank F. Simini and S. Redner for many useful discussions and the Volkswagen Foundation for support.
References
- de Solla Price (1976) D. de Solla Price, “A general theory of bibliometric and other cumulative advantage processes,” J. Am. Soc. Inf. Sci. 27, 292–306 (1976).
- de Solla Price (1986) D. de Solla Price, Little science, big science… and beyond (Columbia University Press New York, 1986).
- Redner (2005) S. Redner, “Citation statistics from 110 years of physical review,” Physics Today 58, 49 (2005).
- Medo et al. (2011) M. Medo, G. Cimini, and S. Gualdi, “Temporal effects in the growth of networks,” Phys. Rev. Lett. 107, 238701 (2011).
- Eisenberg and Levanon (2003) E. Eisenberg and E. Y. Levanon, “Preferential attachment in the protein network evolution,” Phys. Rev. Lett. 91, 138701 (2003).
- Albert (2005) R. Albert, “Scale-free networks in cell biology,” J. Cell. Sci. 118, 4947–4957 (2005).
- Barabási and Albert (1999) A.-L. Barabási and R Albert, “Emergence of scaling in random networks,” Science 286, 509–512 (1999).
- Albert and Barabási (2000) R. Albert and A.-L. Barabási, “Topology of evolving networks: Local events and universality,” Phys. Rev. Lett. 85, 5234–5237 (2000).
- Newman (2010) M. E. J. Newman, Networks: an introduction (Oxford University Press, 2010).
- Holme and Saramäki (2012) P. Holme and J. Saramäki, “Temporal networks,” Physics Reports (2012), 10.1016/j.physrep.2012.03.001.
- Barabasi (2005) A.-L. Barabasi, “The origin of bursts and heavy tails in human dynamics,” Nature 435, 207–211 (2005).
- Goh and Barabási (2008) K. I. Goh and A.-L. Barabási, “Burstiness and memory in complex systems,” EPL 81, 48002 (2008).
- Oliveira and Barabási (2005) J. G. Oliveira and A.-L. Barabási, “Human dynamics: Darwin and einstein correspondence patterns,” Nature 437, 1251–1251 (2005).
- Jo et al. (2012) H.-H. Jo, M. Karsai, J. Kertész, and K. Kaski, “Circadian pattern and burstiness in mobile phone communication,” New Journal of Physics 14, 013055 (2012).
- Granovetter (1973) M. S. Granovetter, “The strength of weak ties,” Amer. J. Sociol. 78, 1360–1380 (1973).
- Granovetter (1978) M. Granovetter, “Threshold models of collective behavior,” Amer. J. Sociol. 83, 1420–1443 (1978).
- Watts (2002) D. J. Watts, “A simple model of global cascades on random networks,” Proc. Natl. Acad. Sci. USA 99, 5766 (2002).
- Karsai et al. (2011) M. Karsai, M. Kivelä, R. K. Pan, K. Kaski, J. Kertész, A.-L. Barabási, and J. Saramäki, “Small but slow world: How network topology and burstiness slow down spreading,” Phys. Rev. E 83, 025102 (2011).
- Karsai et al. (2012) M. Karsai, K. Kaski, A.-L. Barabási, and J. Kertész, “Universal features of correlated bursty behaviour,” Sci. Rep. 2, 2012/05/04/online (2012).
- Simon (1955) H. A. Simon, “On a class of skew distribution functions,” Biometrika 42, 425–440 (1955).
- Girvan and Newman (2002) M. Girvan and M. E. J. Newman, “Community structure in social and biological networks,” Proc. Natl. Acad. Sci. USA 99, 7821–7826 (2002).
- Watts and Strogatz (1998) D. J. Watts and S. H. Strogatz, “Collective dynamics of ‘small-world’ networks,” Nature 393, 440–442 (1998).
- Moore et al. (2006) C. Moore, G. Ghoshal, and M. E. J. Newman, “Exact solutions for models of evolving networks with addition and deletion of nodes,” Phys. Rev. E 74, 036121 (2006).
- Bianconi and Barabási (2001) G. Bianconi and A.-L. Barabási, “Competition and multiscaling in evolving networks,” EPL 54, 436 (2001).
- Golosovsky and Solomon (2012) M. Golosovsky and S. Solomon, “Stochastic dynamical model of a growing citation network based on a self-exciting point process,” Phys. Rev. Lett. 109, 098701 (2012).
- Blondel et al. (2008) V. D. Blondel, J. L. Guillaume, R Lambiotte, and E. Lefebvre, “Fast unfolding of communities in large networks,” J. Stat. Mech. 2008, P10008 (2008).
- Reichardt and Bornholdt (2006) J. Reichardt and S. Bornholdt, “When are networks truly modular?” Physica D 224, 20 – 26 (2006).
- Bagrow (2012) J. P. Bagrow, “Communities and bottlenecks: Trees and treelike networks have high modularity,” Phys. Rev. E 85, 066118 (2012).
- Newman and Girvan (2004) M. E. J. Newman and M. Girvan, “Finding and evaluating community structure in networks,” Phys. Rev. E 69, 026113 (2004).
- Note (1) An interevent time distribution that gives rise to such an algebraic hazard function is the Weibull distribution .
- Stehlé et al. (2011) J. Stehlé, N. Voirin, A. Barrat, C. Cattuto, L. Isella, J.-F. Pinton, M. Quaggiotto, W. Van den Broeck, C. Régis, B. Lina, and P. Vanhems, “High-resolution measurements of face-to-face contact patterns in a primary school,” PLoS ONE 6, e23176 (2011).
- Zhao et al. (2011) K. Zhao, J. Stehlé, G. Bianconi, and A. Barrat, “Social network dynamics of face-to-face interactions,” Phys. Rev. E 83, 056109 (2011).
- Nagy et al. (2010) M. Nagy, Z. Ákos, D. Biro, and T. Vicsek, “Hierarchical group dynamics in pigeon flocks,” Nature 464, 890–893 (2010).
- McCormick and Contreras (2001) D. A. McCormick and D. Contreras, “On the cellular and network bases of epileptic seizures,” Annual Review of Physiology 63, 815–846 (2001).
- Vértes et al. (2012) P. E. Vértes, A. F. Alexander-Bloch, N. Gogtay, J. N. Giedd, J. L. Rapoport, and E. T. Bullmore, “Simple models of human brain functional networks,” Proc. Natl. Acad. Sci. USA 109, 5868–5873 (2012).