Spin decoherence and electron spin bath noise of a nitrogen-vacancy center in diamond
Abstract
We theoretically investigate spin decoherence of a single nitrogen-vacancy (NV) center in diamond. Using the spin coherent state P-representation method, coherence evolution of the NV center surrounded by nitrogen electron spins (N) is simulated. We find that spin decoherence time as well as free-induction decay of the NV center depend on the spatial configuration of N spins. Both the spin decoherence rate (1/) and dephasing rate (1/ of the NV center increase linearly with the concentration of the N spins. Using the P-representation method, we also demonstrate extracting noise spectrum of the N spin bath, which will provide promising pathways for designing an optimum pulse sequence to suppress the decoherence in diamond.
pacs:
76.30.Mi, 03.67.Pp, 03.65.Yz, 76.30.-vNitrogen-vacancy (NV) impurity centers in diamond have been investigated extensively for fundamental research Gruber et al. (1997); Jelezko et al. (2002) and potential applications of quantum information processing devices Jelezko et al. (2004); Jiang et al. (2009); Neumann et al. (2010), and a high-precision room-temperature magnetic sensor Maze et al. (2008a); Balasubramanian et al. (2008). Coherent properties of NV centers in diamond play a crucial rule in the applications. Spin decoherence is due to couplings to noisy environments. For a NV center in diamond, major noise sources are paramagnetic impurities and nuclear spins. Diamond crystals containing 10 ppm of substitutional single-nitrogen (N) impurities are called type-Ib diamonds and the spin decoherence is caused by fluctuating N spin baths Kennedy et al. (2003); Takahashi et al. (2008); Hanson et al. (2008). On the other hand, in diamond containing much less N spins, the spin decoherence time is much longer and the decoherence is often limited by couplings to 13C nuclear spins (1.1 natural abundance) Childress et al. (2006); Maze et al. (2008b); Balasubramanian et al. (2008).
Understanding dynamics of an electron spin system and surrounding electron and nuclear spin baths has been a long-standing problem for theoretical investigation on electron spin resonance (ESR) in solids. The lineshape and width of continuous ESR spectrum as well as pulsed ESR signals including free induction decay (FID) and spin echo (SE) decay were successfully described by approximating spin baths by stochastic noise fields Klauder and Anderson (1962); Chiba and Hirai (1972); Zhidomirov and Salikhov (1969); de Sousa and Sarma (2003). In order to realize spin-based quantum bits (qubits) in solid-state systems Kane (1998); Loss and DiVincenzo (1998), investigation of spin baths is becoming more critical to understand decoherence. Methods like dynamical decoupling Viola and Lloyd (1998); Khodjasteh and Lidar (2005); Uhrig (2007) has been studied to suppress the decoherence in knowledge of noise spectrum of surrounding spin baths Medford et al. (2012); Cywinski et al. (2008). In semiconductor quantum dots Hanson et al. (2007), silicon Morton and Lovett (2011), and diamond with very low concentration of N spins Childress et al. (2006); Maze et al. (2008b); Zhao et al. (2012), nuclear spins are the major source of the decoherence in the system. The dipolar coupling between nuclear bath spins is much weaker than the hyperfine (HF) coupling between an electron (central) spin qubit and bath nuclear spins (the system-bath coupling). In such cases, microscopic treatments of nuclear spin baths have been thoroughly studied using the cluster expansion method Witzel et al. (2005); Witzel and Sarma (2006); Saikin et al. (2007); Yao et al. (2006); Liu et al. (2007) in which the intra-bath coupling is treated as a perturbation to the system-bath coupling. On the other hand, for electron spin baths where the strength of the intra-bath coupling is comparable to that of the system-bath coupling (the strong intra-bath coupling regime), it is often challenging to implement the cluster expansion method Witzel et al. (2010, 2012). In type-Ib diamond, the dipolar coupling strength between the NV center and the N spins is of the same order of that between N spins. Although it has been shown that experimentally observed FID and SE signals of a single NV center have been well described by a classical stochastic noise, the Ornstein-Uhlenbeck (O-U) process Hanson et al. (2008); de Lange et al. (2010), spin dynamics of a NV center and surrounding N spins has not been fully understood yet.
Variations of the P-representations Glauber (1963); Sudarshan (1963); Drummond and Gardiner (1980) have been successfully used to formulate many-body problems in quantum optics, e.g. squeezing in optical solitons Carter et al. (1987). The spin coherent state P-representation, as a variation of the time-dependent mean-field method, has been proposed to apply to spin-based qubit systems targeting at decoherence of the central spin Al-Hassanieh et al. (2006); Zhang et al. (2007). The wavefunction of the whole system is represented in the basis of direct product of wavefunctions for individual spins. Equations of motion for all spins are specially tailored to achieve a close approximation to quantum dynamics of the central spin. Simulation of FID and SE for a nuclear spin system has been demonstrated using the spin coherent P-representation method Zhang et al. (2007).
In this paper, we theoretically study spin decoherence of a single NV center in diamond with the N electron spin bath. We employ the P-representation method to simulate spin dynamics of the NV center and surrounding N spins. Simulated SE decays agree with the decays due to a classical noise field described by the O-U process. Our simulation shows that the decay rate of both FID () and SE () depend linearly on the concentration of N spins in the range from 1 to 100 ppm. Noise spectrum of N spins is also extracted using the P-representation method. The simulated noise spectrum is in good agreement with the noise spectrum of the O-U process in the range of high frequencies with which the spectrum of the SE sequence overlaps significantly.
We consider a NV center in diamond ( = 1) under a static magnetic field applied along the N-V axis (denoted as the axis). The Hamiltonian of the NV center system is
| (1) |
where = 2.87 GHz is the zero-field splitting due to the axial crystal field, is the gyromagnetic ratio for the NV center, and is the electron spin of the NV center. The second term corresponds to the Zeeman energy of . The HF coupling between and the nitrogen nuclear spin in the NV center is not considered. The degeneracy between and states is lifted by the external magnetic field . We consider only the and transition to treat the NV center as a two-level system, . The Hamiltonian for an individual N spin ( = 1/2) is
| (2) |
where is the gyromagnetic ratio for the N spin and the HF coupling constant is MHz for N spins delocalized along the axis and 86 MHz along the , and axes Loubser and vanWyk (1978). We here consider cases where is not equal to 514 G, therefore there is a large mismatch in the transition energy of NV and N spins which suppresses the flip-flop process between NV and N spins greatly. In the rotating frame with the precession frequency of the N spins, , and with the NV center, , the Hamiltonian for the dipolar interaction between the NV and the N spins (the system-bath coupling) is given by Hanson et al. (2008),
| (3) |
where and is the coupling constant. The Hamiltonian for the dipolar coupling between N bath spins and is given by
| (4) |
where and only secular terms are considered.
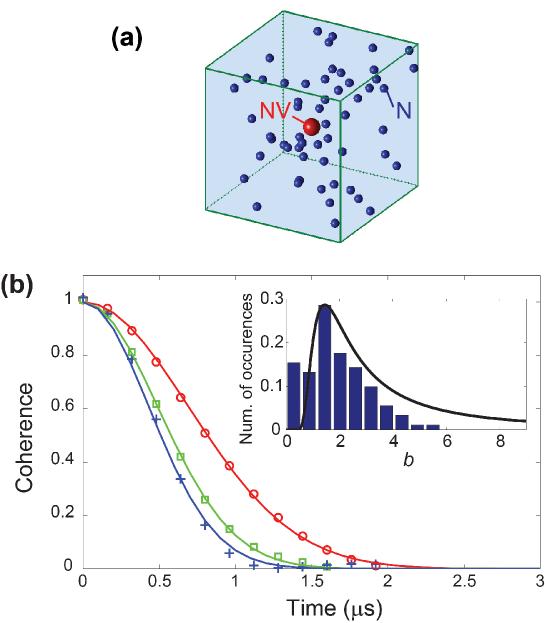
Fig. 1 shows a spatial configuration of a NV center () and N spin () bath used in our simulation. The NV center spin is located at the center of a cube where the cube consists of a tetrahedral diamond unit cell with of the lattice constant. The number of the unit cells in the cube is ( is the number of unit cell along the , and -axes). N spins are randomly distributed on the lattice sites. and the number of N spins (typically 80 100 N spins are used) are adjusted according to the concentration of N spins (). In the simulation, M initial vectors are sampled to represent unpolarized N spin bath corresponding to a high temperature limit of the bath, , ) and , are prepared where is the number of N spins and is a classical vector on the Bloch sphere of spin (the =0 spin is a NV center). Time evolution of the vector, , is calculated according to a set of equations of motion where is a local magnetic field for spin induced by other spins in the system. Coherence at time is given by calculating (see the supplemental material for details).
Simulated coherence are shown in Fig. 1(b). The coherence decays as a function of time, and the decay corresponds to FID signals of a NV center. As shown in Fig. 1(b), simulated FIDs are fit well by the fundamental Gaussian function. The Gaussian shape of the FID agrees with that of FID signals experimentally observed from a single NV center in type-Ib diamond Hanson et al. (2008). The root-mean-square of the spin-bath coupling quantifies the FID for the NV spin, i.e. . Thus the FID time depends on the configuration of the local bath spins around the NV center. Fig. 1(b) shows the simulated FID signals for the single NV center with different N bath configurations for ppm of the N spin concentration. We found that the values of obtained from agree with directly calculated from the configuration of the N bath spins. Inset of Fig. 1(b) shows a histogram of . The distribution of agrees with the theoretically expected distribution Dobrovitski et al. (2008). To represent a typical configuration of the N spin bath, simulated results with any pairs of spins coupled much stronger (50 times) than typical coupling strength are excluded. A deviation at high values is due to this exclusion (see the inset of Fig. 1(b)). We obtained = with 0.53 of the the mean value for ppm of the N spin concentration.
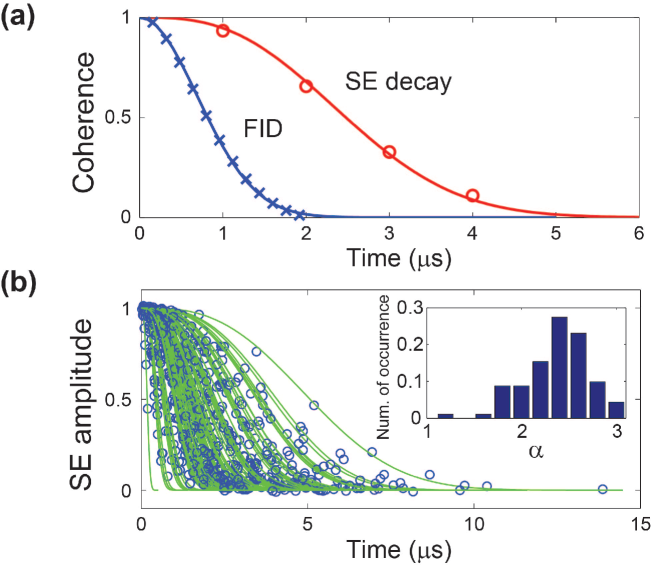
As shown in Fig. 2(a), we simulated the time evolution of SE. The rephasing pulse is assumed to be perfect and instantaneous in the simulation. SE decay in electron spin baths has been described by treating the bath to be a classical noise field where the noise field was modeled by the O-U process with the correlation function . is the correlation time of the bath, which measures the rate of the flip-flop process between the bath spins. The corresponding noise spectrum is Lorentzian with power and the half-width at half-maximum (HWHM) . SE decay subject to the noise due to the O-U process is given by Klauder and Anderson (1962),
| (5) |
In the quasi-static limit () indicating slow bath dynamics, . On the other hand, in the motional-narrowing limit (), . As shown in Fig. 2(a), we found good agreement between our simulation results and Eq. (5). Using the value of determined by the bath configuration and confirmed by the FID, we determined . Fig. 2(b) shows 90 simulated SE decays with =10 ppm. For many cases, we found , and SE decays are well described by where the exponent is typically between as shown in inset of Fig. 2(b). This is in consistence with previous experimental results () de Lange et al. (2010); Wang et al. (2012). We also found a few cases in the motional-narrowing regime (), in which the SE decay shapes are close to a single exponential function.
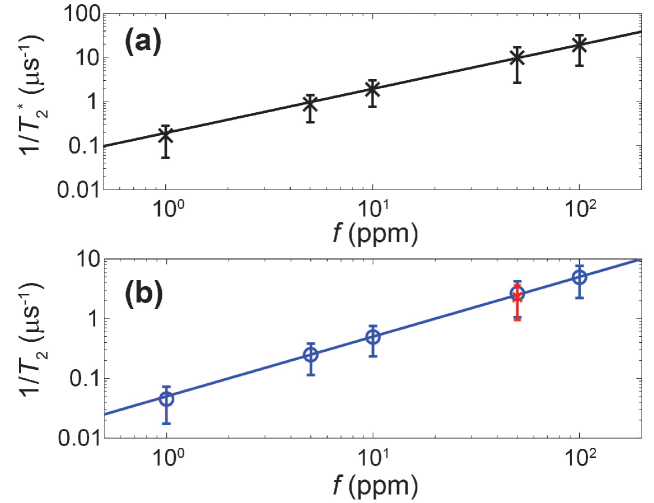
We examined the concentration dependence of the FID and SE decay in the range from to ppm. In Fig. 3(a) and (b), and are shown for the concentrations of ppm. For each value of , random configurations of the bath are simulated and the mean of and with the standard deviation as an error bar are shown. We found a linear dependence on for both and , namely and corresponding to and for = 10 and 100 ppm respectively. The linear dependence of the concentration has been experimentally seen in of ensemble N spins in diamond van Wyk et al. (1997). In addition, a linear concentration dependence of has been reported in phosphorous donors in silicon Witzel et al. (2010). The linear dependence can be understood as stemming from the dipolar nature of both the spin-bath and the intra-bath couplings. Consider the case of . The average spin-bath coupling , hence , where is the average distance between neighboring spins. Similarly for N bath spins, is roughly proportional to average coupling, which is proportional to . For , the expansion of Eq. 5 to the leading order in yields , therefore is proportional to .
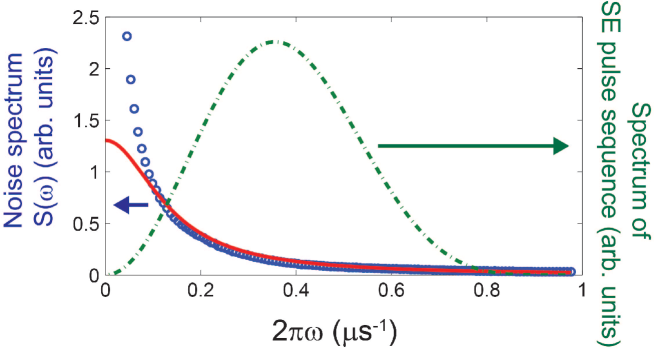
Finally we simulated noise spectrum of the N spin bath, . At time , the local magnetic field due to N spins at the NV spin is expressed by where the sum is taken over all N bath spins. Direct Fourier transform of renders the noise spectrum, . Fig. 4 shows the simulated noise spectrum of N spins. Coherence of the NV center decays due to couplings to environmental noise of N spins. The amount of the decay is determined by overlaps between the noise spectrum and the spectrum of a pulse sequence used in ESR measurements. In SE measurement, the power spectrum of the pulse sequence is given by where is the total evolution time Cywinski et al. (2008). As shown in Fig. 4, with , significant overlap between the noise and the pulse-sequence spectrum happens at high frequencies where the noise spectrum agrees well with the spectrum of the O-U process. This supports the observation of good agreement between our simulated SE signals and the analytical solution with the O-U process (see Eq. 5). On the other hand, in the present case, the dephasing time of the FID signals is determined by where does not depend on details of the noise spectrum . We found excellent agreement in between obtained from the noise spectrum and extracted from simulated FID.
In summary, we investigated spin decoherence of a single NV center coupling to N electron spins using the P-representation method. The P-representation is a modified time-dependent mean-field technique that is suitable to simulate coherence evolution of a central spin surrounded by spin baths. Simulated results for SE signals are in good agreement with analytical expressions based on the O-U process and with previous experimental results. We found that the FID and SE decay rates, and , depend linearly on the concentration of N spins. We also demonstrated simulating the noise spectrum of the electron spin bath using the P-representation method. The P-representation method is suitable to study decoherence in other spin-based qubit systems even in the strong intra-bath coupling regime, e.g. phosphorus donors in isotropically pure silicon (29Si ppm). This capability will facilitate us to find optimum DD sequences to effectively suppress decoherence in spin-based qubit systems.
We thank to V. V. Dobrovitski and D. A. Lidar for useful discussions. This work was supported by the Searle scholars program (S.T.).
References
- Gruber et al. (1997) A. Gruber, A. Dräbenstedt, C. Tietz, L. Fleury, J. Wrachtrup, and C. von Borczyskowski, Science 276, 2012 (1997).
- Jelezko et al. (2002) F. Jelezko, I. Popa, A. Gruber, C. Tietz, J. Wrachtrup, A. Nizovtsev, and S. Kilin, Appl. Phys. Lett. 81, 2160 (2002).
- Jelezko et al. (2004) F. Jelezko, T. Gaebel, I. Popa, M. Domhan, A. Gruber, and J. Wrachtrup, Phys. Rev. Lett. 93, 130501 (2004).
- Jiang et al. (2009) L. Jiang, J. S. Hodges, J. R. Maze, P. Maurer, J. M. Taylor, D. G. Cory, P. R. Hemmer, R. L. Walsworth, A. Yacoby, A. S. Zibrov, et al., Science 326, 267 (2009).
- Neumann et al. (2010) P. Neumann, R. Kolesov, B. Naydenov, J. Beck, F. Rempp, M. Steiner, V. Jacques, G. Balasubramanian, M. L. Markham, D. J. Twitchen, et al., Nature Phys. 6, 249 (2010).
- Maze et al. (2008a) J. R. Maze, P. L. Stanwix, J. S. Hodges, S. Hong, J. M. Taylor, P. Cappellaro, L. Jiang, M. V. G. Dutt, E. Togan, A. S. Zibrov, et al., Nature 455, 644 (2008a).
- Balasubramanian et al. (2008) G. Balasubramanian, I. Y. Chan, R. Kolesov, M. Al-Hmoud, J. Tisler, C. Shin, C. Kim, A. Wojcik, P. R. Hemmer, A. Krueger, et al., Nature 455, 648 (2008).
- Kennedy et al. (2003) T. A. Kennedy, J. S. Colton, J. E. Butler, R. C. Linares, and P. J. Doering, Appl. Phys. Lett. 83, 4190 (2003).
- Takahashi et al. (2008) S. Takahashi, R. Hanson, J. van Tol, M. S. Sherwin, and D. D. Awschalom, Phys. Rev. Lett. 101, 047601 (2008).
- Hanson et al. (2008) R. Hanson, V. V. Dobrovitski, A. E. Feiguin, O. Gywat, and D. D. Awschalom, Science 320, 352 (2008).
- Childress et al. (2006) L. Childress, M. V. G. Dutt, J. M. Taylor, A. S. Zibrov, F. Jelezko, J. Wrachtrup, P. R. Hemmer, and M. D. Lukin, Science 314, 281 (2006).
- Maze et al. (2008b) J. R. Maze, J. M. Taylor, and M. D. Lukin, Phys. Rev. B 78, 094303 (2008b).
- Klauder and Anderson (1962) J. R. Klauder and P. W. Anderson, Phys. Rev. 125, 912 (1962).
- Chiba and Hirai (1972) M. Chiba and A. Hirai, J. Phys. Soc. Jpn. 33, 730 (1972).
- Zhidomirov and Salikhov (1969) G. M. Zhidomirov and K. M. Salikhov, Sov. Phys. JETP 29, 1037 (1969).
- de Sousa and Sarma (2003) R. de Sousa and S. Das Sarma, Phys. Rev. B 68, 115322 (2003).
- Kane (1998) B. E. Kane, Nature 393, 133 (1998).
- Loss and DiVincenzo (1998) D. Loss and D. P. DiVincenzo, Phys. Rev. A 57, 120 (1998).
- Viola and Lloyd (1998) L. Viola and S. Lloyd, Phys. Rev. A 58, 2733 (1998).
- Khodjasteh and Lidar (2005) K. Khodjasteh and D. Lidar, Phys. Rev. Lett. 95, 180501 (2005).
- Uhrig (2007) G. S. Uhrig, Phys. Rev. Lett. 98, 100504 (2007).
- Medford et al. (2012) J. Medford, L. Cywinski, C. Barthel, C. M. Marcus, M. P. Hanson, and A. C. Gossard, Phys. Rev. Lett. 108, 086802 (2012).
- Cywinski et al. (2008) L. Cywinski, R. Lutchyn, C. Nave, and S. Das Sarma, Phys. Rev. B 77, 174509 (2008).
- Hanson et al. (2007) R. Hanson, L. P. Kouwenhoven, J. R. Petta, S. Tarucha, and L. M. K. Vandersypen, Rev. Mod. Phys. 79, 1217 (2007).
- Morton and Lovett (2011) J. J. L. Morton and B. W. Lovett, Annual Review of Condensed Matter Physics 2, 189 (2011).
- Zhao et al. (2012) N. Zhao, S.-W. Ho, and R.-B. Liu, Phys. Rev. B 85, 115303 (2012).
- Witzel et al. (2005) W. M. Witzel, R. de Sousa, and S. Das Sarma, Phys. Rev. B 72 161306 (2005).
- Witzel and Sarma (2006) W. M. Witzel and S. Das Sarma, Phys. Rev. B 74, 035322 (2006).
- Saikin et al. (2007) S. K. Saikin, W. Yao, and L. J. Sham, Phys. Rev. B 75, 125314 (2007).
- Yao et al. (2006) W. Yao, R.-B. Liu, and L. J. Sham, Phys. Rev. B 74, 195301 (2006).
- Liu et al. (2007) R.-B. Liu, W. Yao, and L. J. Sham, New J. Phys 9, 226 (2007).
- Witzel et al. (2010) W. Witzel, M. Carroll, A. Morello, L. Cywinski, and S. Das Sarma, Phys. Rev. Lett. 105, 187602 (2010).
- Witzel et al. (2012) W. M. Witzel, M. S. Carroll, L. Cywinski, and S. Das Sarma, Phys. Rev. B 86, 035452 (2012).
- de Lange et al. (2010) G. de Lange, Z. H. Wang, D. Ristè, V. V. Dobrovitski, and R. Hanson, Science 330, 60 (2010).
- Glauber (1963) R. J. Glauber, Phys. Rev. Lett. 10, 84 (1963).
- Sudarshan (1963) E. C. G. Sudarshan, Phys. Rev. Lett. 10, 277 (1963).
- Drummond and Gardiner (1980) P. D. Drummond and C. W. Gardiner, J. Phys. A 13, 2353 (1980).
- Carter et al. (1987) S. J. Carter, P. D. Drummond, M. D. Reid, and R. M. Shelby, Phys. Rev. Lett. 58, 1841 (1987).
- Al-Hassanieh et al. (2006) K. A. Al-Hassanieh, V. V. Dobrovitski, E. Dagotto, and B. N. Harmon, Phys. Rev. Lett. 97, 037204 (2006).
- Zhang et al. (2007) W. Zhang, N. Konstantinidis, K. A. Al-Hassanieh, and V. V. Dobrovitski, J. Phys.: Condens. Matter 19, 083202 (2007).
- Loubser and vanWyk (1978) J. H. N. Loubser and J. A. vanWyk, Rep. Prog. Phys. 41, 1201 (1978).
- Dobrovitski et al. (2008) V. V. Dobrovitski, A. E. Feiguin, D. D. Awschalom, and R. Hanson, Phys. Rev. B 77, 245212 (2008).
- Wang et al. (2012) Z.-H. Wang, G. de Lange, D. Riste, R. Hanson, and V. V. Dobrovitski, Phys. Rev. B 85, 155204 (2012).
- van Wyk et al. (1997) J. van Wyk, E. Reynhardt, G. High, and I. Kiflawi, J. Phys. D: Appl. Phys. 30, 1790 (1997).