The mass and angular momentum distribution of simulated massive early-type galaxies to large radii
Abstract
We study the dark and luminous mass distributions, circular velocity curves (CVC), line-of-sight kinematics, and angular momenta for a sample of 42 cosmological zoom simulations of galaxies with stellar masses from to . Using a temporal smoothing technique, we are able to reach large radii. We find that: (i) The dark matter halo density profiles outside a few kpc follow simple power-law models, with flat dark matter CVCs for lower-mass systems, and rising CVCs for high-mass haloes. The projected stellar density distributions at large radii can be fitted by Sérsic functions with , larger than for typical early-type galaxies (ETGs). (ii) The massive systems have nearly flat total (luminous plus dark matter) CVCs at large radii, while the less massive systems have mildly decreasing CVCs. The slope of the circular velocity at large radii correlates with circular velocity itself. (iii) The dark matter fractions within the projected stellar half mass radius are in the range - and increase to - at . Larger and more massive galaxies have higher dark matter fractions. The fractions and trends with mass and size are in agreement with observational estimates, even though the stellar-to-total mass ratio is 2-3 times higher than estimated for ETGs. (iv) The short axes of simulated galaxies and their host dark matter haloes are well aligned and their short-to-long axis ratios are correlated. (v) The stellar root mean square velocity profiles are slowly declining, in agreement with planetary nebulae observations in the outer haloes of most ETGs. (vi) The line-of-sight velocity fields show that rotation properties at small and large radii are correlated. Most radial profiles for the cumulative specific angular momentum parameter are nearly flat or slightly rising, with values in from to . A few cases show local maxima in . These properties agree with observations of ETGs at large radii. (vii) Stellar mass, ellipticity at large radii , and are correlated: the more massive systems have less angular momentum and are rounder, as for observed ETGs. (viii) More massive galaxies with a large fraction of accreted stars have radially anisotropic velocity distributions outside . Tangential anisotropy is seen only for galaxies with high fraction of in-situ stars.
keywords:
galaxies: kinematics and dynamics - methods: -body simulations - methods: numerical1 Introduction
Recent observations and cosmological simulations suggests a two-phase formation scenario for massive early-type galaxies (ETGs), in which an early phase of rapid star formation driven by cold accretion and dissipative mergers is followed by a prolonged phase of mass accretion through gas-poor major and minor mergers. Observations have shown that a population of old, massive () and red ETGs were already in place at redshifts (e.g., Fontana et al., 2006; Ilbert et al., 2010; Cassata et al., 2011), and that these galaxies have sizes several times smaller and densities an order of magnitude higher than present-day ETGs of similar mass (e.g., Daddi et al., 2005; Trujillo et al., 2007; van Dokkum et al., 2010). Recent simulations have found that massive galaxies grow initially through rapid star formation fuelled by infall of cold gas at , leading to an old population of ’in situ’ stars. Subsequently, the simulated galaxies grow through minor mergers, accreting old stars formed in subunits outside the main galaxy halo. The accreted stars are preferentially added to the outer haloes of the host systems, leading to efficient size evolution (e.g., Naab et al., 2009; Oser et al., 2010; Feldmann et al., 2010; Hopkins et al., 2010; Johansson et al., 2012).
While there is relatively little stellar mass in the outer regions of ETGs at galactocentric radii , these stars may carry indispensable information about the late assembly history of the galaxies. With relaxation times in the present-day outer stellar haloes of up to several Gyrs, the record of the recent halo accretion history may be relatively well preserved (van Dokkum, 2005; Duc et al., 2011). The outer halo stars may also contain a significant fraction of the angular momentum of the galaxies (Romanowsky & Fall, 2012), and they can be used as gravitational tracers to study the mass distribution, dark matter fraction and potential of ETGs at large radii. Therefore, a detailed investigation of the structure and kinematics of the outer stellar haloes, comparing simulated and observed haloes, may reveal important information about the formation history of ETGs.
Traditional long slit measurements and more recent observations with integral-field units (IFUs) have provided detailed kinematic and dynamical information about the central regions of ETGs, (e.g., Bender et al., 1994; Gerhard et al., 2001; Cappellari et al., 2006). Using 2-dimensional stellar kinematics from the SAURON IFU out to , and a measure of the projected angular momentum condensed into the cumulative parameter (see §5.1), ETGs can be separated into two main groups, fast rotators (FR, ) and slow rotators (SR, Emsellem et al., 2007, 2011). This division is part of a wider dichotomy between oblate-spheroidal disky, coreless, rotating ETGs with little radio and X-ray emission, and triaxial boxy, cored, non-rotating, radio-loud and X-ray bright systems (see Bender et al., 1989; Kormendy & Bender, 1996; Kormendy et al., 2009).
In the outer haloes, obtaining kinematic information is much harder because of the rapid decline of stellar surface brightness with radius. Most of the known kinematic properties come from observations of Planetary Nebulae (PNe) which have been found to be good tracers of the stars and can be observed up to (e.g., Méndez et al., 2001; Coccato et al., 2009; McNeil-Moylan et al., 2012). Recently, individual IFU pointings and slitlet masks have also been used at (Weijmans et al., 2009; Proctor et al., 2009; Murphy et al., 2011). The PNe observations show that the division between FR and SR is largely preserved to large radii, although there are also galaxies whose -profiles drop significantly outwards, possibly implying that the high inner values are due to disks whose light contribution fades towards large radii. Most of the PNe RMS velocity profiles decrease slowly with radius, but a subset of galaxies show steep ’quasi-Keplerian’ outer decreases of velocity dispersion (Coccato et al., 2009).
Analysis of outer stellar kinematics, strong lensing, and hydrostatic equilibrium of X-ray emitting hot gas shows that massive elliptical galaxies have nearly isothermal inner mass distributions, equivalent to flat circular velocity curves (e.g., Gerhard et al., 2001; Koopmans et al., 2006; Auger et al., 2010; Churazov et al., 2008; Churazov et al., 2010; Nagino & Matsushita, 2009). For the lower mass ellipticals, the situation is less clear, as the mass-anisotropy degeneracy is stronger for declining velocity dispersion profiles, their X-ray emission is too faint, and the lensing samples are dominated by massive systems. The dynamical modelling of integrated light and PNe indicates somewhat more diffuse dark matter haloes in these galaxies (de Lorenzi et al., 2009; Napolitano et al., 2009; Morganti et al., 2013). Another useful tracer of the outer mass distributions is the globular clusters (GCs); especially massive ellipticals contain large GC populations (e.g., Schuberth et al., 2010; Strader et al., 2011). However, a larger fraction of GCs may be recently accreted systems, as their relative frequency is tilted more towards small systems than that of PNe and light (Coccato et al., 2013).
In order to compare this large body of work with cosmological predictions, we here present the first detailed analysis of the inner and outer dynamics of a large sample of simulated galaxies. We study the mass distributions, outer kinematics, and angular momentum distributions of 42 resimulated galaxies from a high-resolution cosmological simulation, which grew through the two-phase processes of early in-situ formation followed by late accretion and minor mergers (Oser et al., 2012). In §2 we briefly describe the present-day (z=0) model galaxies extracted from the cosmological zoom simulations, and the method we use to derive smooth kinematic maps from their particle distributions. In §3, we study the mass density distributions of the stars and dark matter in these galaxies, as well as the corresponding circular velocity curves (CVCs). Then in §4, we investigate the observable kinematics in these systems out to large radii. We finally consider the cumulative and local angular momentum profiles and for the stellar components in §5. We end by summarizing our results in §6.
2 The simulated galaxies and their kinematic analysis
The “galaxies” studied here are extracted from the cosmological zoom simulations of Oser et al. (2010, 2012). These simulations were carried out with the following cosmological model parameters (in standard notation): , and initial slope of power spectrum . First, dark matter-only initial conditions were evolved from to , and selected individual haloes were identified together with their virial radii . For this simulation, the softening radius was . Then these haloes were traced back in time, and were replaced with high resolution gas and dark matter particles. The new haloes were evolved again from to the present day including prescriptions for star formation, supernova feedback, gas cooling and a redshift dependent UV background radiation.
From these high-resolution simulations, we here select 42 galaxies at z=0 which do not have massive satellites at this time. The selection is based on the circular velocity curves of these systems within 5 effective radii (); we require that the estimated fluctuations in the CVC induced by satellites are smaller than . The final sample of simulated galaxies includes 32 galaxies described in Oser et al. (2010), and another 10 less massive galaxies from the same cosmological simulation to extend the mass range of the simulated galaxies, which then ranges from to within . Their typical effective radii are (Oser et al., 2010). The effective radius is here defined as the projected half mass radius of the stellar particles within . For comparison, the co-moving softening lengths for stars and dark matter particles in the resimulations are and , so the stellar kinematics are resolved for in the smallest systems, and for in the large galaxies. Individual values of are given for all sample galaxies in column 1 of Table 1.
The star formation model used for the simulations presented here (see Oser et al. 2010 for all details) favours efficient star formation at high redshift leading to preferentially spheroidal systems with old stellar populations. The simulations do not produce supernova driven winds and a model for feedback from central AGN is not included. Therefore, the fraction of available baryons (in every halo) converted into stars of the central galaxies in the simulated mass range is typically two to three times higher than estimates from models matching observed galaxy mass functions to simulated halo mass functions (e.g., Guo et al., 2010; Moster et al., 2010; Behroozi et al., 2010; Yang et al., 2012). Possible physical processes responsible for this discrepancy are strong wind-driving feedback from SNII (e.g., Dekel & Silk, 1986; Oppenheimer & Davé, 2008; Governato et al., 2010; Dalla Vecchia & Schaye, 2012) and/or feedback from super-massive black holes (e.g., Croton et al., 2006; Di Matteo et al., 2008; McCarthy et al., 2010; Teyssier et al., 2011).
Other simulations with similar specifications (weak supernova feedback and no AGN feedback) result in galaxies with photometric and kinematic properties similar to present day elliptical galaxies (Naab et al., 2007; Johansson et al., 2009; Naab et al., 2009; Feldmann et al., 2010; Johansson et al., 2012). The galaxies used here are in agreement with early-type scaling relations of mass with radius and stellar velocity dispersion. In addition, they have close to isothermal total mass distributions, similar to some observed ellipticals (e.g. Gerhard et al., 2001; Koopmans et al., 2006; Churazov et al., 2010; Barnabè et al., 2011), and their observed size evolution between and is in agreement with recent observational estimates (Oser et al., 2012).
In contrast to the central regions of the simulated galaxies which are well resolved, in their outer regions () the particle noise can be substantial. In addition, although we have already removed systems having massive satellites, many smaller substructures are still present in the outer parts of the remaining galaxies. We have decided to smooth out these small substructures rather than taking them out one by one. However, we have tested in a few cases that the results with both approaches are very similar. To reduce fluctuations in the final velocity fields caused by either particle noise or small satellites, we use an N-body code (NMAGIC, implemented by de Lorenzi et al., 2007) to temporally smooth the system while integrating the orbits of the particles in the gravitational potential, for one circular orbit period at . Since the total mass in gas within in these systems is small (it is one order of magnitude smaller than the mass of stars within for all 42 galaxies), we simply fix the gas particles at their initial positions while integrating the stellar and dark matter particle orbits.
The NMAGIC code is a spherical harmonics code with a made-to-measure (M2M) algorithm (Syer & Tremaine, 1996; de Lorenzi et al., 2007). Here we use it as a normal N-body code. The Poisson solver adopted in NMAGIC is a spherical harmonic expansion potential solver. It uses a radial grid binned logarithmically within maximum radius , and there are 400 radial bins. The spherical harmonics expansion is carried to . This does not resolve the small satellites, which are therefore conveniently smoothed out during the integration.
The potential and gravitational acceleration are computed at a sequence of time steps separated by
| (1) |
i.e., times in one circular orbit period for . During each interval the orbits of the particles are integrated with an adaptive leap-frog scheme. Kinematic line-of-sight (LOS) observables are projected on a two-dimensional polar grid with resolution on a region, using eq. (11) of de Lorenzi et al. (2008). The observables, e.g., surface density or velocity moments, here denoted by for the grid cell, are then time averaged by integrating (Syer & Tremaine, 1996; de Lorenzi et al., 2007)
| (2) |
where is the corresponding observable for the grid cell and the snapshot at time , and the temporal smoothing parameter is taken to be
| (3) |
so that the smoothing time is . This procedure effectively smoothes over the particle noise for the observables in the sparse outer regions of the simulated galaxies. In a later section (§4), we will illustrate the effect of the particle noise and of the satellites on the projected kinematics for one snapshot and compare with the time averaged kinematics obtained by the procedure just described.
3 Mass distributions and Circular Velocity Curves
In this section, we investigate the stellar and dark matter density profiles of the simulated galaxies at z=0. We use the amplitude and slope of the circular velocity curve to characterize the mass distribution, and determine the fraction of dark matter at intermediate radii.
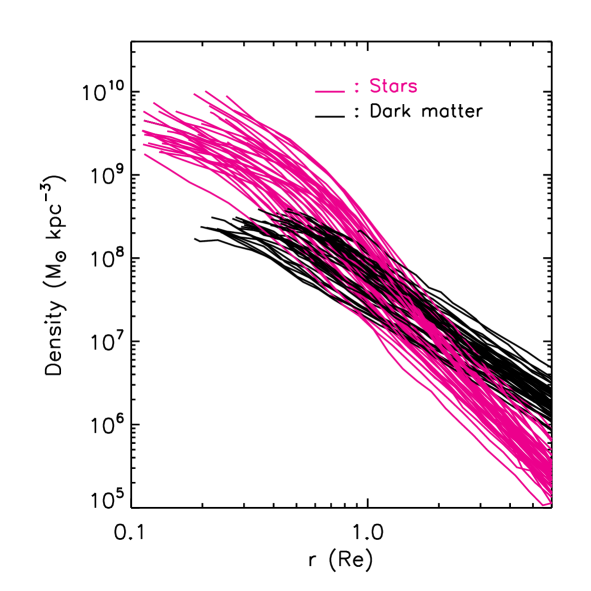
Figure 1 shows the three-dimensional volume density profiles for stars and dark matter, for radii greater than the respective softening radii for the star and dark matter particles. The densities shown are temporally smoothed as described above. We find for all model galaxies that the stellar components have steeply decreasing density profiles from to , with small cores in the centres, while the dark matter haloes have flatter density profiles. Since the high resolution re-simulations of individual haloes include a variety of physical processes for the baryonic component, the dark matter density profiles are different from the simple NFW-like profiles (Navarro et al., 1996, 2010) found in simulations that only include dark matter. Compared with the density profiles obtained from an equivalent dark matter-only cosmological simulation (Oser et al., 2010), the halo density profiles from the simulation with baryons investigated here are more cuspy within of their stellar components. The evolution of the dark matter profiles is dominated by adiabatic contraction but is also complicated by expansion of the inner halo due to minor mergers (Johansson et al., 2009). A detailed study of the combined processes is beyond the scope of this paper.
3.1 Stellar density profiles
The surface density profiles of observed ETGs can be well fitted with a Sérsic profile (Sérsic, 1963; Capaccioli, 1989). Luminous ETGs have ‘cored’ profiles for which the slope of the central profile is below that of the outer Sérsic profile (Trujillo et al., 2004). We therefore use a cored Sérsic profile (Graham et al., 2003) to represent the stellar density of the model galaxies, such that
| (4) | |||||
| (5) |
Here is the Sérsic index, is a normalization parameter related to the central surface density, and is a radius close to the effective radius if (because the relation used for versus is for the original Sérsic profile). We fit the model density profile out to a truncation radius of , binning the temporally smoothed surface densities on a logarithmic radial grid (see §2).
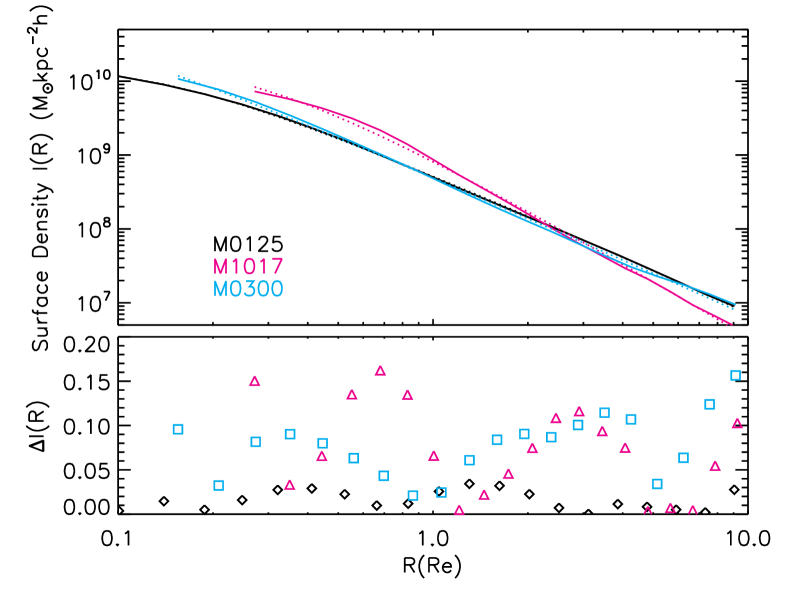
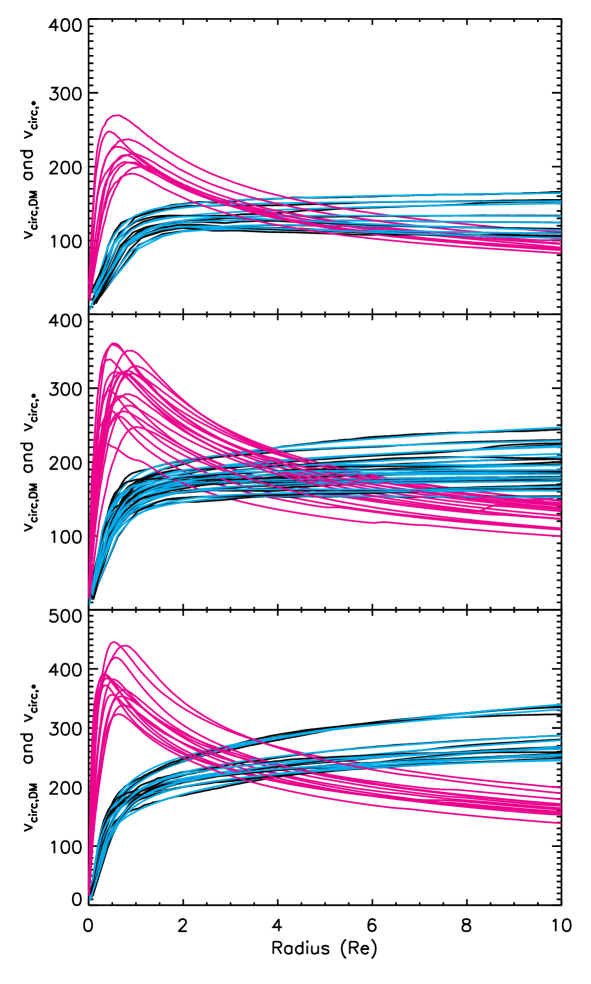

Figure 2 shows surface density profiles, cored Sérsic fits, and residuals for three model galaxies (M0125, M1017, and M0300, selected based on their rotational properties, see § 4 and 5). Generally, the cored-Sérsic model fits the particle distributions well, with a typical residual (standard deviation) for the entire sample of of the local surface density. However, most of the model galaxies have large values of Sérsic index , and a significant fraction even , so that these galaxies have more power-law like surface density profiles than real ETGs.
3.2 Dark matter mass distributions and circular velocity curves
The density profiles for the simulated dark matter haloes, shown in Figure 1, are very similar to each other, with nearly the same slope between and . To describe the mass distributions of the simulated galaxies more quantitatively, we study their circular velocity curves (CVCs) in Fig. 3. Here the circular velocity serves as a measure of the spherical part of the mass distribution, independent of the actual rotational velocities of the stellar or dark matter particles. The three rows of Fig. 3 show the model galaxy CVCs binned into three groups according to the value of at . The left panels show the CVCs for the stellar components (magenta) and dark matter haloes (black) separately. We see that the dark matter CVCs are nearly flat at large radii for the lowest bin, but increase outwards for higher mass systems (with high ). The figure also shows that the dark matter haloes dominate the CVCs outside . The dark matter CVCs can be well approximated by power law mass distributions between and . We use the following parametrisation:
| (6) |
Here is a normalization parameter for the circular velocity, is the core radius of the dark halo, and is the slope of the CVC at large radii. The cyan lines in the left panels of Fig. 3 show the parameterised CVCs of the dark halo components. They agree well with the binned (unsmoothed) data for the halo circular velocities, especially at large radii (black lines). Columns 7-9 in Table 2 give the best-fitting values of , and for the model dark matter haloes. Column 10 gives the rms residuals of the fit, which have magnitudes of only a few km/s. The values of range between for almost all models, less than about twice the softening radius of the dark matter particles, , and the do not correlate with the masses of the model galaxies. Therefore the presence of a core could be an effect of the softening in the simulations. In order to check this further, we also redid the fits while fixing . The best-fitting CVCs obtained in this case are not significantly different from the previous CVCs (the typical residual is less than ). Since (Table 1), the core radii do not significantly affect the rotation curves around . Thus and are approximately equal to the value and logarithmic slope of the dark matter CVC at ,
| (7) |
The dark matter CVCs are well-described by power-laws in the range - for the massive galaxies, and in the range - for the lower-mass systems; note the small residuals of the CVC fits (). The range of slopes from -0.1 to +0.3 corresponds to density slopes of -2.2 to -1.4 down to several kpc, indicating that the inner dark matter density profiles have been modified by the interaction with the baryonic component.

The left panel of Fig. 4 quantifies the correlation between the outer slope of the dark matter CVC with the amplitude of the dark matter CVC at for the simulated galaxies. We find that for the low- systems the slopes of dark matter CVCs are around zero and for the high- systems these slopes are slightly above zero (), confirming the result from Fig. 3.
The right panels of Fig. 3 show the total CVCs of the model galaxies, including the contribution from the stars, which we parametrize again by their value and logarithmic slope at ,
| (8) |
The total CVCs are slightly falling at large radii () for the systems in the upper right panel, whose is smaller than , while they are nearly flat outside for the most massive model galaxies whose is larger than (lower right panel; see also Lyskova et al. 2012). Thus the massive model galaxies represent well massive ETGs whose CVCs are nearly isothermal as inferred from dynamical and lensing studies (e.g., Gerhard et al., 2001; Koopmans et al., 2006; Auger et al., 2010; Churazov et al., 2008; Churazov et al., 2010; Nagino & Matsushita, 2009).
The right panel of Fig. 4 quantifies this correlation by showing the total slopes versus the circular velocities at . Model galaxies with larger values of have , i.e., flat CVCs at large radii, while the remaining galaxies have slopes between , i.e., CVCs between flat (0.0) and mildly falling (-0.3).
Thus it is clear that the slope of the CVC at large radii is correlated with the amplitude of the circular velocity, and hence with model galaxy mass. The correlation is clearest for the dark matter haloes alone (see left panel of Fig. 4 and Eq. 6), while it is weakened when the baryonic component is taken into account. All values for circular velocities and CVC slopes at can be found in Table 2.

Finally, we show the fraction of dark matter within 3-dimensional spheres of (left panel of Fig. 5) and (right panel) for the model galaxy sample. At , the dark matter fractions are between , i.e., the luminous matter dominates by a factor 3-7. At , the dark matter fractions are between , i.e., the amount of dark matter is now on average larger than the mass in stars. We can infer from Fig. 5 that the DM fraction increases with stellar mass (or circular velocity), and that this increase is mostly due to a dependence on effective radius rather than circular velocity (see also Hilz et al., 2012; Hilz et al., 2013). These model values approximately agree with dark matter fractions inferred from power-law dynamical modelling of PNe and GC observations (Deason et al., 2012, Fig. 7) and strong lensing (Auger et al., 2010, Fig. 7), for Salpeter IMF.
3.3 Shape correlation and alignment
Observed ETGs have ellipticities up to (Bernardi et al., 2003; Krajnović et al., 2011). The distribution of ellipticities depends on sample selection; it is approximately flat up to ellipiticity for the recent ATLAS3D sample (see Krajnović et al., 2011, Fig. 7). The shapes of the outer dark haloes () can be estimated from the shear patterns in weak gravitational lensing data (Hoekstra et al., 2004; Mandelbaum et al., 2006; van Uitert et al., 2012). Some of these studies have found that the dark matter haloes of red galaxies on scales beyond are preferentially aligned with the lens galaxies, but the signal is not as clear as might have been expected.
Dark matter simulations predict that the haloes are triaxial (Jing & Suto, 2002; Allgood et al., 2006). In hydrodynamical simulations of disk galaxies, the inner haloes become preferentially aligned with the disk and misaligned with the outer haloes (Bailin et al., 2005; Bett et al., 2010; Hahn et al., 2010), while in binary major mergers the short axis of the stellar remnant is found to be oriented perpendicular to the long axis of the surrounding halo (Novak et al., 2006). It is therefore of interest to investigate the shapes and orientations of the stellar and dark matter distributions for the current model galaxies, which have a very different formation history.
To study the alignment of the simulated galaxies and their host dark matter haloes, we determine the principal axis directions of both components at small radii () and large radii () at z=0. We find these quantities by diagonalising the moment of inertia tensor iteratively from all particles inside ellipsoids , where or , , and, e.g., the latter is determined from where are the diagonalised moments of inertia for all stellar particles within the ellipsoid. Because within there are only a few hundred dark matter particles for many of our models, we have chosen the inner radius at in order to ensure reliable results. The particle mass for the stellar component is of the dark matter particle mass, so there is a sufficient number of stellar particles even within quite small radii to define the shapes of the ‘luminous’ galaxies.
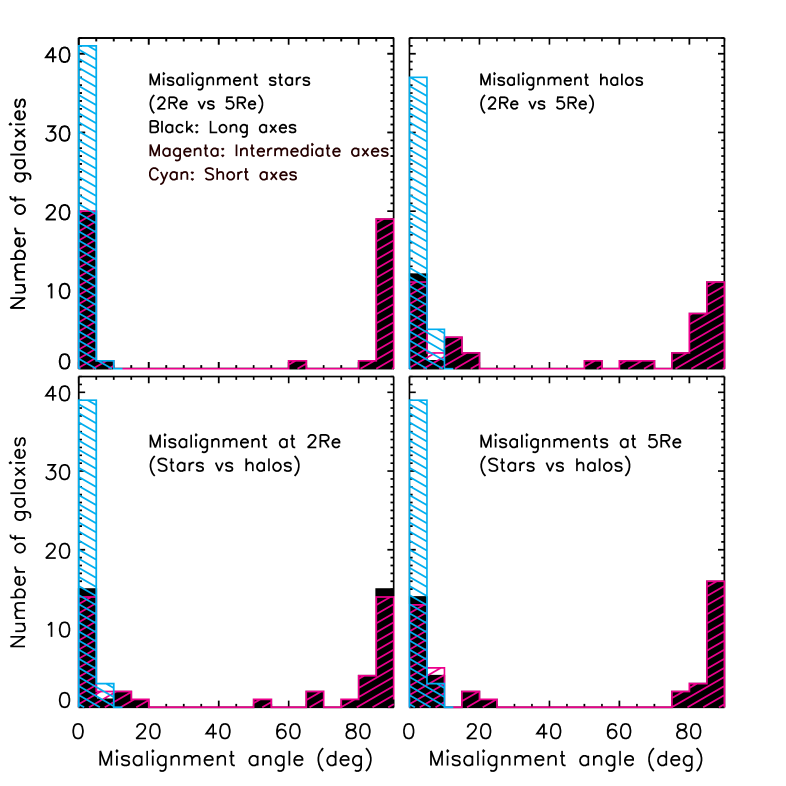
Figure 6 shows the histograms of misalignment angles between the short, intermediate, and long axes of the stellar and halo components at and for each component separately, and between both components. The short axes (cyan) of the stars at different radii, of the dark matter at different radii, and of the stars and dark matter distributions are always very well aligned (within ). The stellar minor axis is therefore always perpendicular to the dark halo major axis.
The long axes (black) and intermediate axes (magenta) of the stars and of the dark halo, or of either of these components at different radii, are approximately aligned within () in about half of the cases; in the other half of the cases they are misaligned by roughly 90 degrees, meaning that the intermediate and long axes have switched between different radii or components. This can happen most easily when the system is nearly axisymmetric.
The cosmological sample contains simulated galaxies formed in different ways, including some which underwent a gas-rich major merger, but the evolution usually includes minor mergers as well (Oser et al., 2012; Johansson et al., 2012; Naab et al., 2013). Novak et al. (2006) show that in hydrodynamic simulations of binary major mergers, the minor axis of the oblate stellar merger remnant is generally perpendicular to the major axis of the surrounding prolate-triaxial dark matter halo, due to the influence of angular momentum and dissipation. Because the baryons cause the inner halo to evolve towards oblate shape (e.g. Kazantzidis et al., 2004; Bailin et al., 2005), this would partially explain our results. In minor mergers, the stirring of the pre-existing system by the incoming dark matter is similar for the dark matter and stars. This may explain why dark halo and stellar component are aligned at similar radii also for minor merger dominated formation histories.

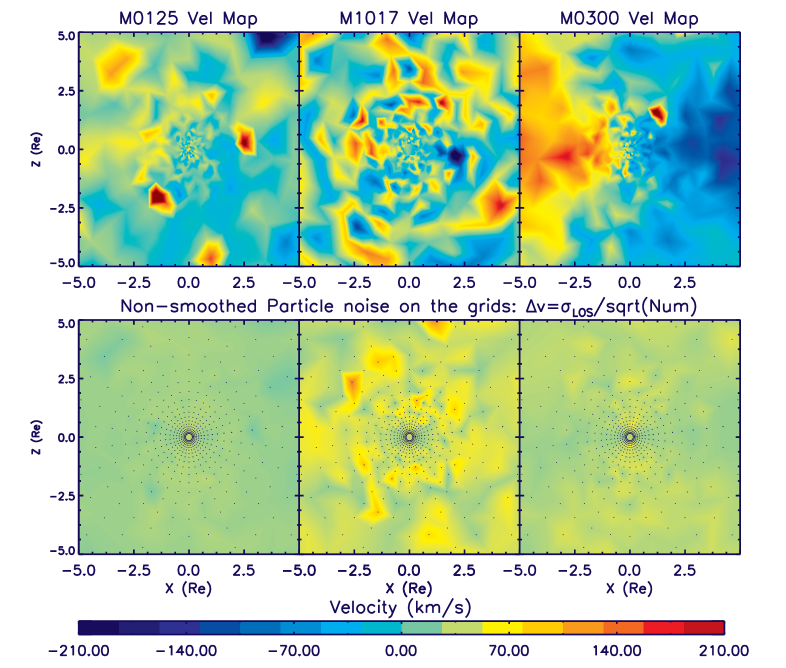
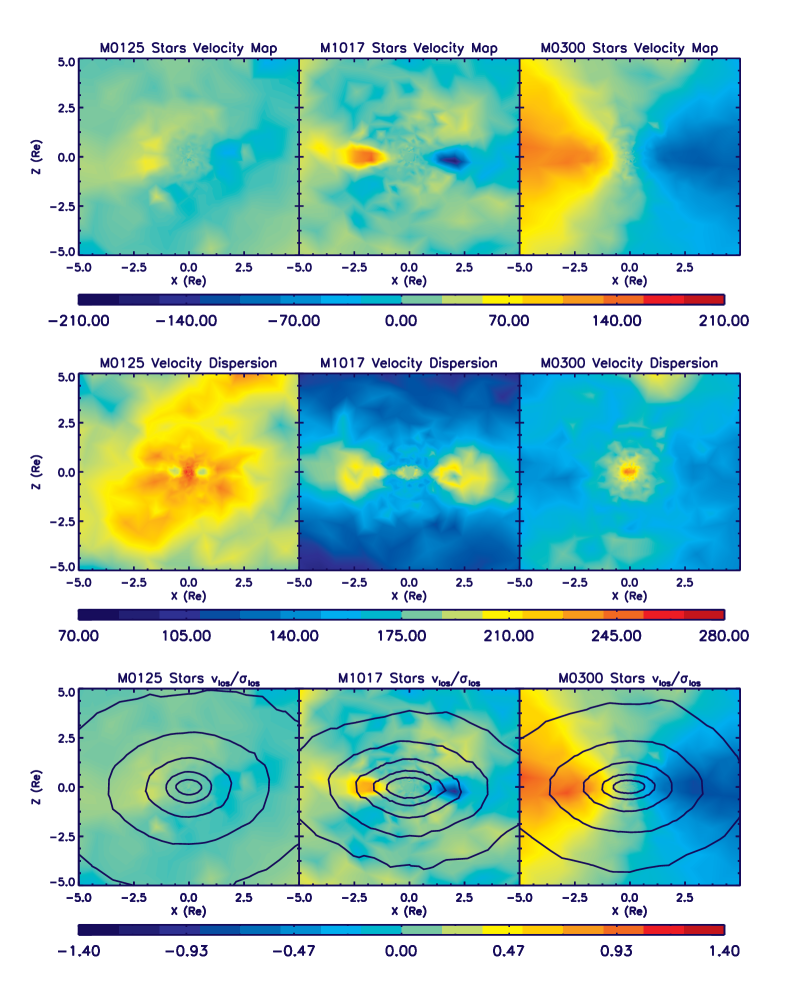
Figure 7 shows the short-to-long axis ratios of the dark matter haloes versus those of the stars, at both and . These axis ratios where obtained by viewing the system along the intermediate axis of the stellar component, and computing the projected axis ratio from the diagonalised 2D projected moment of inertia tensor. At both and , the axis-ratios of the galaxies are in the range [0.4,0.8] while the haloes are slightly rounder, . From the figure we see a moderately strong correlation between the shapes of the stellar and halo components, with scatter in the halo axis ratio at given stellar of at and at .
In summary, the short axes of the simulated galaxies and their host dark matter haloes are well aligned within througout the radial range probed (-), and their shapes are correlated. Long and intermediate axes are either aligned or misaligned by , i.e., switch their order, within slightly larger () scatter.
4 Line-of-sight kinematics of simulated galaxies to large radii
As is well-known, the outer kinematics of ETGs are difficult to measure because the stellar densities and surface brightness profiles decrease rapidly at large radii. The same problem also exists in the simulated galaxies where the particles follow similar density profiles. In addition to Poisson noise, there is also a further source of fluctuations that arises from various small satellites around the central galaxies.
In order to investigate the effects of the fluctuations from both low particle numbers and satellites, we consider three cosmological galaxies from our sample of Oser et al. (2010) more closely (see also Figure 2).Velocity maps for these galaxies at are shown in Fig. 8. The projection direction is along the intermediate axis of the stellar distribution within one effective radius111The maps are interpolated from a polar grid as described in Sect. 2.. The unsmoothed snapshot maps of mean LOS velocity (upper panels in the left column of Fig. 8) show significant fluctuations. A map of the error in the mean LOS velocity is shown in the lower left panels of Fig. 8. This is defined as , where and are the velocity dispersion and number of particles in the cell grid for this line-of-sight. Typical values for these fluctuations are . Model M1017 is an extreme case where the error can reach almost of the mean LOS velocity itself.
In addition to the fluctuations caused by particle noise, these velocity maps show a number of well-defined substructures. These satellites will be moving along their own orbits until they finally merge with the central galaxy, and can locally have quite different LOS velocities from the host galaxy particles. Thereby the satellites change the 1-dimensional LOS velocity profiles and thus , and they may also affect the angular momentum profiles. We have decided not to take all these small satellites out, but to consider the host galaxy after these substructures have phase-mixed away in its large-scale gravitational potential. The NMAGIC code used for this purpose (see Sect. 2) also computes a time average of the observables and which allows us to obtain more reliable LOS kinematics at large radii than would otherwise be possible.
Recomputing in this way the projected LOS kinematics for the three galaxies in Fig. 8 results in the kinematic maps presented in the right column of Fig. 8. The three maps in the upper right panel are mean velocity maps . Fluctuations are greatly reduced compared to the unsmoothed maps in the left column. Also the fluctuations arising from the small satellites are mostly smoothed out. The middle panel in the right column of Fig. 8 shows maps of LOS velocity dispersion , and the lower panel shows maps of the ratio with overplotted stellar surface density contours.
For model M0125 (always in the left panels), the velocity field shows a mild rotation, and its velocity dispersion map shows large within , implying that this galaxy is pressure-supported. For model M0300 (right panels), rapid disk-like rotation is seen from the mean velocity map, while is only large in the centre (); this object is significantly supported by rotation. Finally, in model M1017 (middle panels), one can see a hot disk-like structure at intermediate radii () in both the velocity and maps, while the rest of the galaxy has lower dispersion. Model M1017 is mostly pressure-supported with a rotationally supported component. While this model is somewhat unusual, the other two are quite typical for the large radius kinematics of fast and slow rotator galaxies in the simulated ETG sample. Observed outer velocity fields similar to the three cases shown here are those of NGC 5846 (a slow rotator galaxy), NGC 4564 (a fast rotator with a disk-like velocity field at intermediate radii; for both see Coccato et al. 2009), and NGC 1316 (a rapidly rotating merger remnant; see McNeil-Moylan et al. 2012).
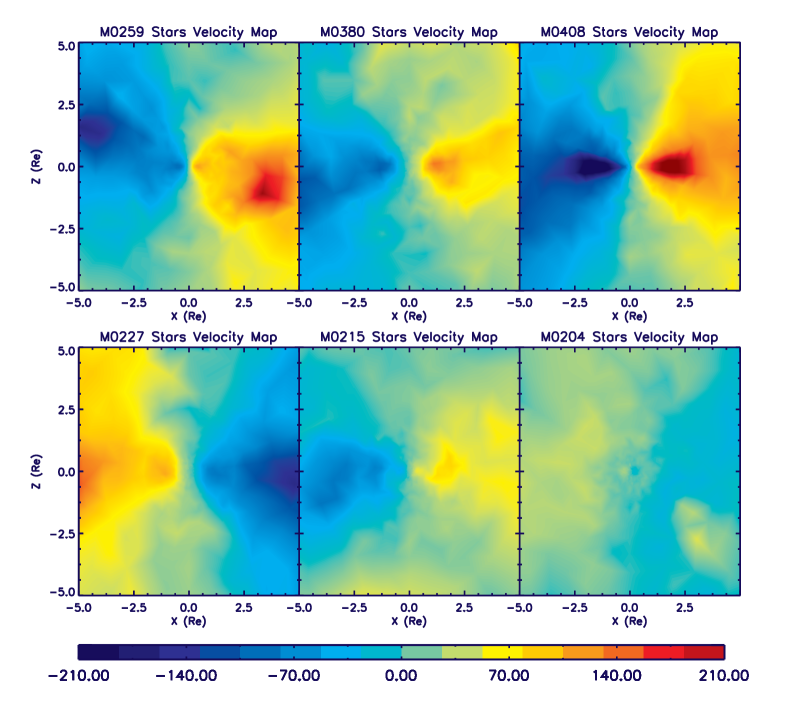
Figure 9 shows line-of-sight velocity fields for 6 additional simulated galaxies out to . These galaxies have been chosen as representatives for different dissipational and dissipationless formation histories. For example, the galaxy in the top right panel has a pronounced disk component around from a gas rich major merger, and the galaxy in the bottom right panel shows weak major and minor axis rotation; it has a formation history with many minor mergers. For further details about the formation histories of these simulated galaxies see Naab et al. (2013, in preparation).
4.1 Root Mean Square Velocity Profiles
Observations of outer ETG kinematics using planetary nebula velocities have shown that most ETGs are characterised by slowly declining profiles of circularly averaged RMS LOS velocity , but with a significant minority of galaxies for which the RMS velocity declines rapidly (Coccato et al., 2009). It is therefore of interest to investigate the equivalent radial profiles for the (re)simulated galaxies considered here.
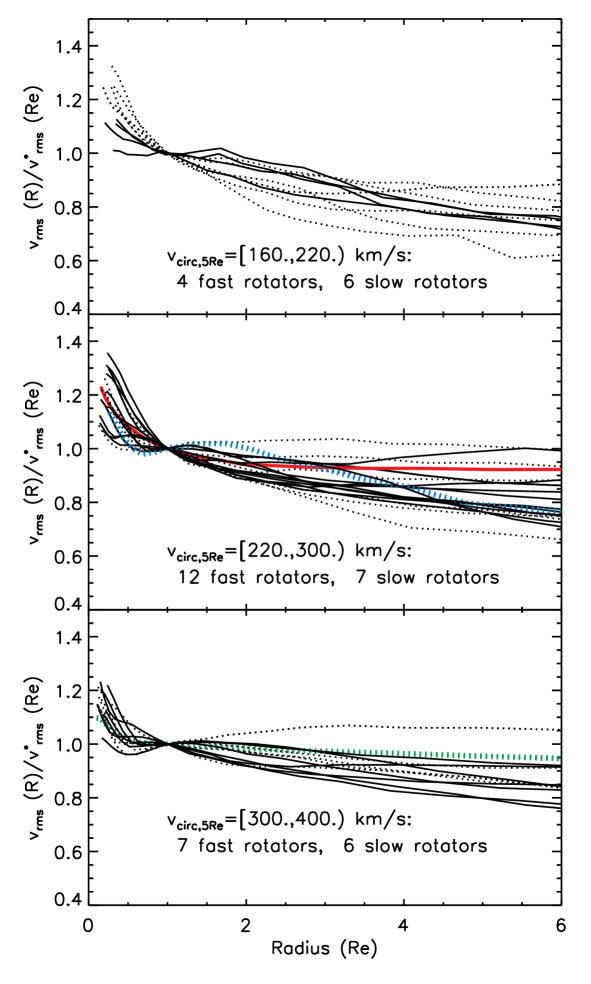
Figure 10 shows the circularly averaged profiles of for the 42 galaxies from Oser et al. (2010) in the three usual bins of . The viewing direction for all simulated galaxies is edge-on along the intermediate axis of the stellar distribution. The include projected rotation and velocity dispersion of all star particles, and are normalised by the respective values of . We find that the profiles decline moderately with radius for the low-mass systems, whereas they decrease only mildly for the high-mass systems. This agrees with the CVCs shown in Fig. 3. The profiles of fast and slow rotators (see Sect. 5) are not significantly different.
The profiles in Fig. 10 are consistent with the major group in Coccato et al. (2009, Fig. 15), but there is no equivalent in the simulations for the rapidly falling profiles shown in that paper (e.g., for NGC 3379). For this comparison, we also studied the profiles of the simulated galaxies in face-on projection, with LOS parallel to the shortest axis. The face-on profiles are similar to those in edge-on projection; at least for the current sample of cosmological galaxies, the inclination angle does not seem to be an important parameter for . However, to follow the formation of thin disks in large-volume cosmological simulations is still problematic, because of the required high resolution (see, e.g., Guedes et al., 2011; Brook et al., 2012), and this may also impact the properties of simulated merger remnants from such disks. We note that binary merger simulations with orbits drawn from cosmological simulations can result in steeply falling velocity dispersion profiles in CDM halos (Dekel et al., 2005). Therefore in the context of cosmological simulations this question should be revisited once the resolution and the physical modelling is sufficient for modelling well-resolved populations of disk and elliptical galaxies in a large volume.
4.2 Anisotropy profiles
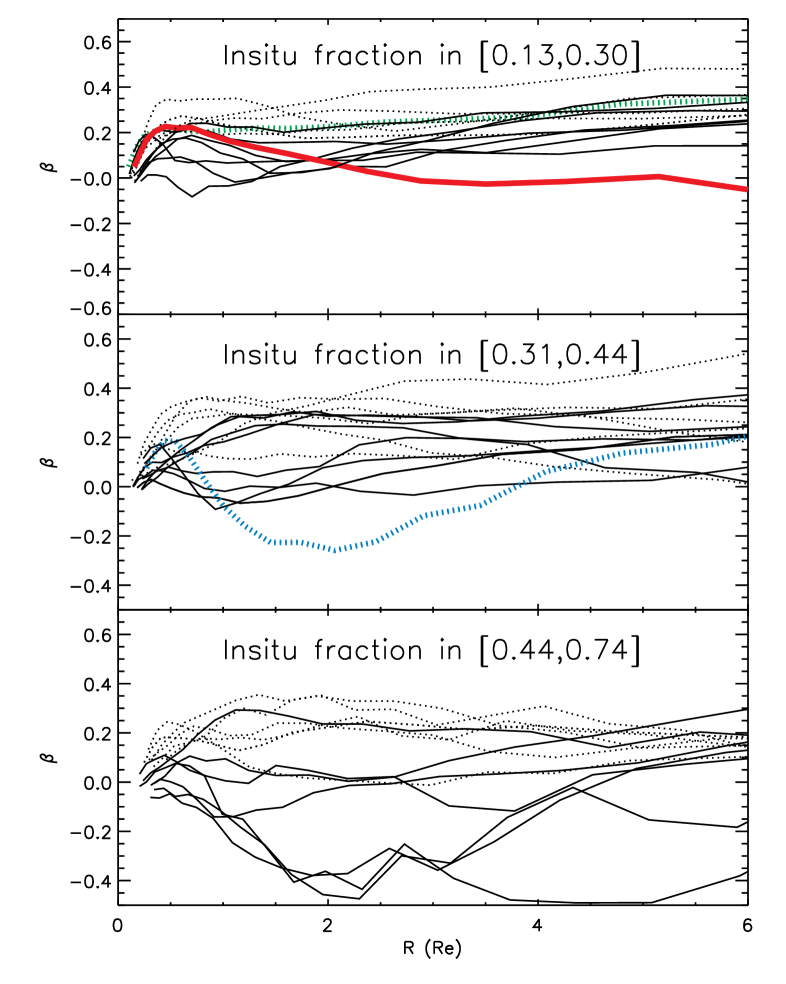
In these cosmological simulations, the stars in the model galaxies have two origins: the inner in situ component forms at early times in a period of rapid star formation, while the second component stems from accreted stellar particles which is predominantly but not only found at large radii (Oser et al., 2010). The accreted component is characterised by radially anisotropic velocity dispersions (Abadi et al., 2006; Hilz et al., 2012) because the merging satellites come in on predominantly radial orbits, and so many of the stars stripped from the satellites enter the host galaxy on nearly radial orbits also.
Therefore, we would expect the kinematics of model galaxies to be more or less radially anisotropic depending on the relative fractions of in situ and accreted stars. Figure 11 shows anisotropy profiles for all model galaxies, divided into bins of in situ fraction. As expected, tangentially anisotropic model galaxies can only be found in the group with large fraction of in situ stars (lower panel and also M1017 in the middle panel). Almost all simulated galaxies with low in situ star fraction (upper panel) are radially anisotropic with -0.3; but many of the systems with higher in situ fraction have similar anisotropies. As a result, there is no correlation between both quantities for the whole sample. We also find that slow rotators are radially anisotropic (except for M1017), while fast rotator model galaxies have both radially and tangentially biassed anisotropy profiles.
For the radially anisotropic galaxies in Figure 11, the profiles are almost independent of radius with typical values of for . Together with the CVCs in Fig. 3 this results in gently falling profiles as in Fig. 10, according to the Jeans equation. To reproduce the steeply falling velocity dispersion profiles of the quasi-Keplerian galaxies like NGC 3379 often requires rising anisotropy profiles (Morganti et al., 2013), such as may arise from binary mergers of gas-rich disk galaxies (e.g. Dekel et al., 2005).
5 Angular Momentum profiles
5.1 profiles
To characterize the specific angular momentum of ETGs, Emsellem et al. (2007) introduced the profile , which is a luminosity-weighted, cumulative measure of projected angular momentum per unit mass within radius . They found that ETGs can be divided into fast and slow rotators, according to whether resp. . Analyzing simulated merger remnants, Jesseit et al. (2009) found that is a good proxy for the true angular momentum of these remnants. Emsellem et al. (2011) revised the criterion for separating slow and fast rotators to include ellipticity values at or , and they also considered the effect of inclination and an assumed anisotropy on the resulting profile.
Much of the angular momentum of ETGs could reside at large radii, where kinematic measurements are more difficult than in the bright centers. Coccato et al. (2009) studied the kinematics of the outer haloes of a sample of ETGs with PNe. They found (their Fig. 14) that the profiles to large radii for the most part confirm the separation into fast and slow rotators based on the inner kinematics, but with some slow rotators having up to at large and some fast rotators whose profiles decrease outwards.
It is therefore of some interest to compare the specific angular momenta of the simulated galaxies with those of observed ETGs, out to several effective radii. To obtain an overview of the angular momentum properties of the simulated galaxies, we study the profiles for all the 42 cosmological galaxies, and to reach large radii we use the temporally smoothed observables (Sect. 2) in the computation of ,
| (9) |
where the summation is over the kinematic grid. Eq. 9 is the analogue of the flux-weighted sums over Voronoi pixels in Emsellem et al. (2007, Eq. 6), and of the number-weighted sums in Coccato et al. (2009, Eq. 13).
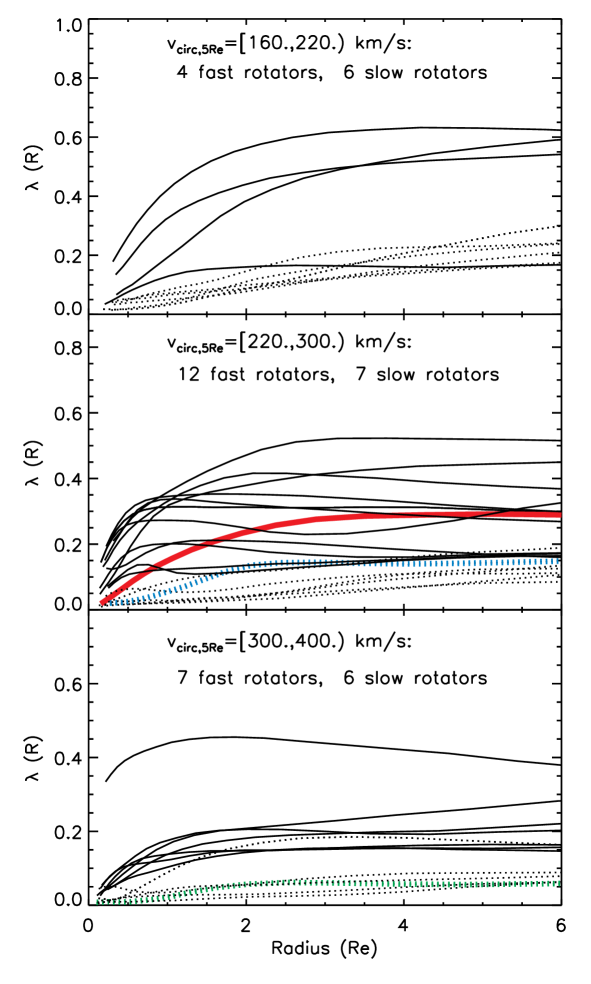
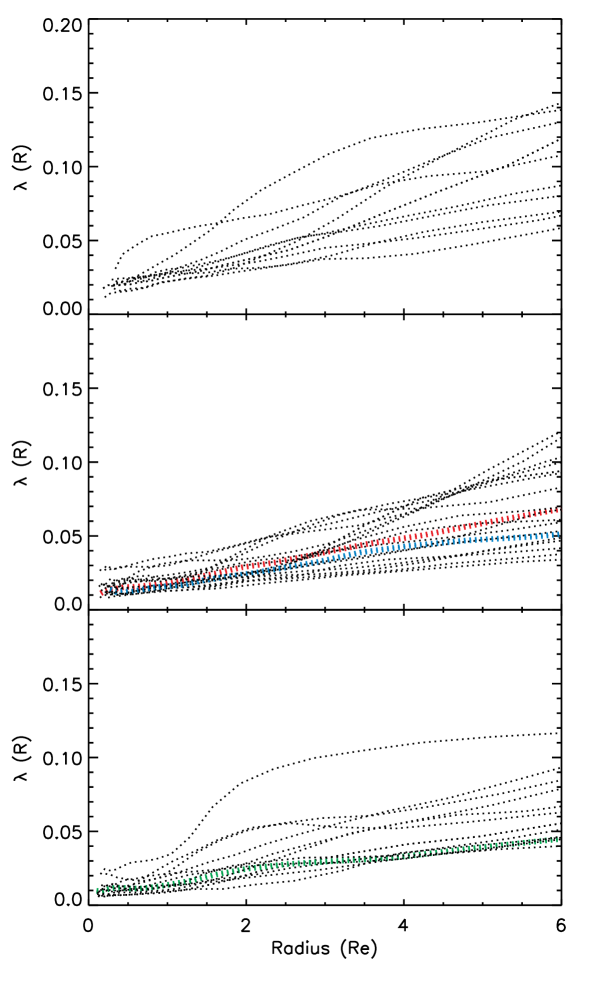
Figure 12 shows the resulting profiles, again with the simulated galaxies binned according to their outer circular velocity . The left panels of Fig. 12 show the profiles for edge-on view, while the right panels show the face-on profiles. Most of the simulated profiles have a very regular form, reaching a nearly constant value at , but some increase or decrease more noticeably at large radii.
The profiles for a large number of nearby ETGs are shown out to in Fig. 5 of Emsellem et al. (2011). More extended profiles for ETGs are shown in Proctor et al. (2009, out to ) and Coccato et al. (2009, out to ). The variations and general shapes of the profiles from the cosmological galaxies agree with the observed profiles of ETGs to large radii, shown in Fig. 14 of Coccato et al. (2009), and the typical values at , -, also agree. Their slopes at small radii appear somewhat shallower than the typical slopes seen in the SAURON and ATLAS3D data (e.g., Fig. 5 in Emsellem et al., 2011). However, even for the unusual model M1017, within , there are similar profiles in Emsellem et al. (2011).
As mentioned above, ETGs can be classified into fast and slow rotators according to their values at . For classifying the simulated galaxies we follow Emsellem et al. (2007), taking to define fast rotators (solid lines in Fig. 12) and for slow rotators (dotted lines). The main reason for this choice is that this classification does not depend on ellipticity. We find that among 42 cosmological galaxies, 23 are fast rotators (based on the edge-on profiles) and 19 are slow rotators. The fraction of slow rotators is largest in the group of simulated galaxies with the highest circular velocities at . In the face-on view (right panels of Fig. 12), none of these systems rotates rapidly, and they are all classified as slow rotators. The fraction of slow rotators among the simulated galaxies () is significantly more than in the ATLAS3D sample (Emsellem et al., 2011); however, the sample selection (predominantly massive galaxies in the simulation) is not comparable to the ATLAS3D sample (see Oser et al., 2010).
It is clear from Fig. 12 that most of the simulated edge-on profiles are flat to slightly rising for . Thus, most fast rotators at continue to rotate rapidly at large radii. Most of the slow rotators have mildly increasing in the outer regions, especially for the group of less massive systems with circular velocities at large radii .
5.2 profiles
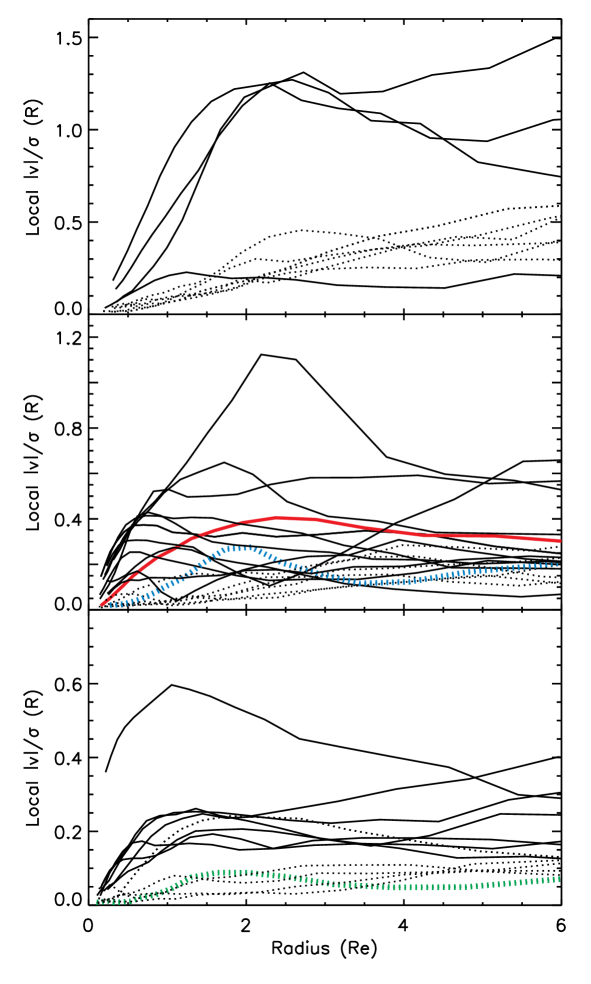
To obtain a more detailed picture of the angular momentum in the outer stellar haloes, it is useful to study the more local angular momentum parameter as well. The local profiles for all simulated galaxies in edge-on view are shown in the middle panels of Fig. 12. For most simulated galaxies, the profiles are nearly flat or increasing mildly with radius after reaching a plateau at . However, there are also a few exceptions for which decreases at large , and some with a strong local concentration of specific angular momentum. These features do not show up as well in the cumulative profiles.
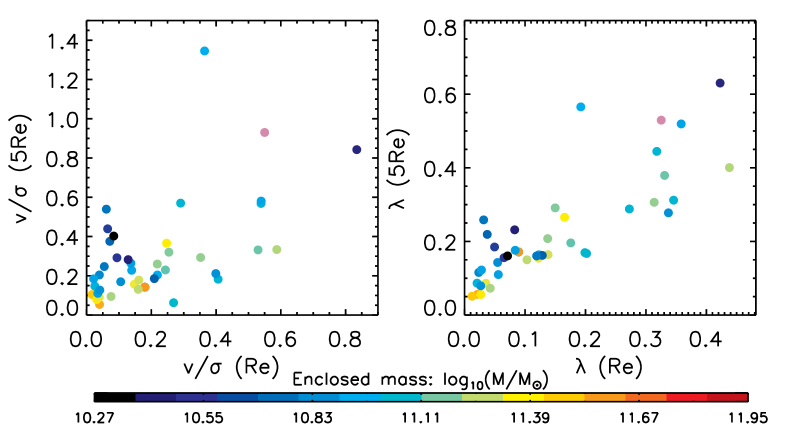
The left panel of Fig. 13 shows a correlation with much scatter between the central and outer local specific angular momentum, at and . The right panel of Fig. 13 shows the close relation between the values at and , which follows from the nearly flat profiles. The correlation between the two values is stronger than for the local angular momentum at the same radii, because of the cumulative nature of within radius .
5.3 Temporal smoothing needed for angular momentum profiles at large radii
In Fig. 8 we showed the velocity fields of three typical galaxies: a slow rotator with very little rotation at any radii (M0125, left panels), a fast rotator for which rotation is significant at all radii (M0300, right panels), and a system rotating slowly in the inner but rotating rapidly for (M1017, middle panels). Especially the maps in Fig. 8 show the different rotational properties of these model galaxies well.
We use the same three simulated galaxies to show the beneficial effect of the temporal smoothing on the cumulative and local profiles in Fig. 14, where the smoothed profiles from Fig. 12 are shown in red and the unsmoothed profiles are overplotted in black, for comparison. The upper panel shows that the amplitudes of the unsmoothed profiles are significantly higher than those of the time-smoothed counterparts. The lower panels show a similar effect in the local and profiles; these have large fluctuations for a single snapshot, especially for the slow rotators, with values of up to a factor of larger than in the smoothed profiles.
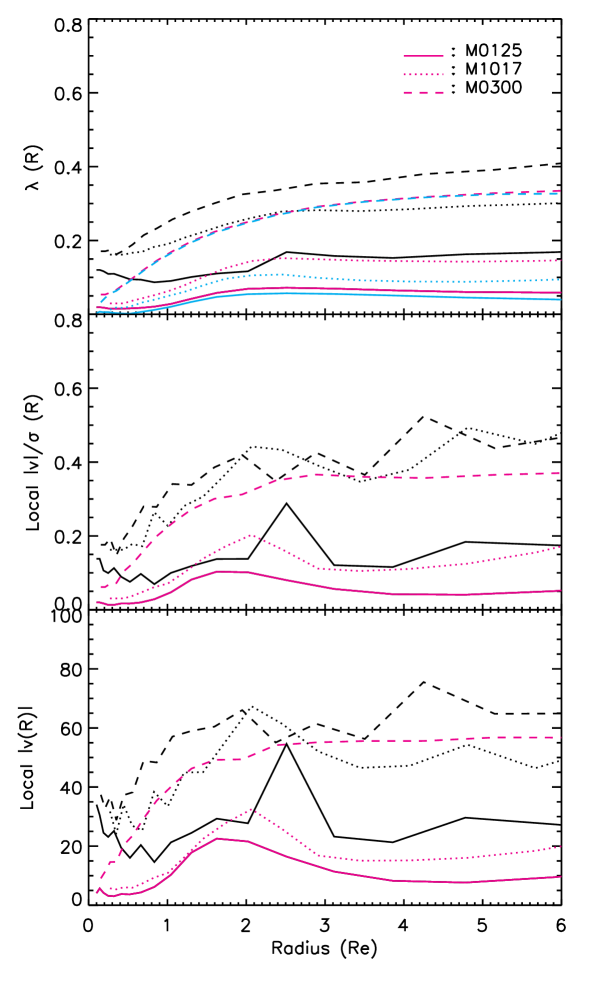
The reason for the higher amplitudes in the unsmoothed case lies in the definition of the parameters in terms of absolute values of mean velocity, so that negative and positive fluctuations cannot cancel in the angular or radial summation. The unsmoothed profiles can therefore be biased significantly by particle noise, especially for the slow rotators (such as model M0125) and in the center, and by global asymmetries (such as seen in model M0300 out to large radii). The light-blue curves in the top panel of Fig. 14 show the results of an additional test for this effect. They are determined from computing separately for the positive and negative velocity sides of the mean velocity maps in Fig. 8, but without the absolute value convention of eq. 9, and then adding the absolute values from both sides. This has the effect that positive and negative velocities on each side are allowed to cancel, which mimicks the effect of removing the noise or the asymmetry by the phase-mixing that occurs during temporal smoothing. It is clear from Fig. 14 that the profiles obtained from this asymmetric averaging and from temporal smoothing agree closely with each other for all three simulated galaxies. This shows that to obtain a correct indication of the angular momentum of the system, the time averaging is necessary.
5.4 Correlations of angular momentum and ellipticity
The observations of the SAURON (Cappellari et al., 2007) and ATLAS3D projects (Emsellem et al., 2011) have shown evidence for correlations between specific angular momentum parameters (either or profiles) with ellipticity and mass of these ETGs. S0-like fast rotator ETGs agree with being a family of oblate systems viewed at random inclination angles, while slow rotator ETGs are moderately flattened () and often show kinematical misalignments, indicating that they are triaxial systems.
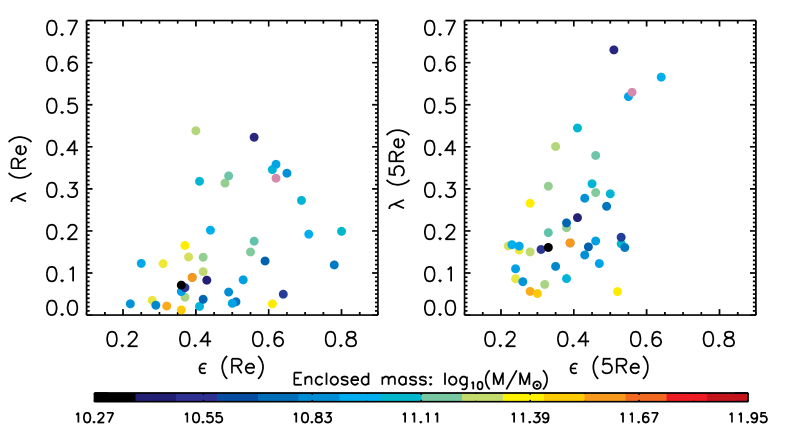
To compare with these observations, we show in Figure 15 the parameters versus the ellipticities of the 42 simulated galaxies, both at (left) and (right). Here ellipticity , where are the long and short semi-axes of the projected ellipse in edge-on projection (see §3.3). We list the values of ellipticity at and in columns and of Table 1, recalling that the central ellipticities for the lower mass systems have some uncertainty due to softening. The values of and at agree with those from direct analysis given in Naab et al. (2013), but small differences exist which can be attributed to the different analysis procedures. Some of the galaxies contain highly flattened disk-like structures which result in large ellipticities at .
Generally, the simulated slow rotators are rounder than the fast rotators, similar as in the observations. The distributions at and are similar, despite the already mentioned possibility that the ellipticity within could be somewhat influenced by softening. The left panel of Fig. 15 is in general agreement with the ATLAS3D observations (Fig. 6 in Emsellem et al., 2011); however, the ellipticity range is narrower for the simulated galaxies and there are no simulated galaxies with . This is because the ATLAS3D sample contains some very flat ETGs which may be disk galaxies, while our sample galaxies are mostly spheroidal galaxies. The equivalent face-on distribution is compressed towards , and values , are rare. A randomly projected sample fills the same area as in Fig. 15 but has a stronger weighting towards the origin of the plot (see Naab et al., 2013, Fig. 11).
The colour bar in Fig. 15 labels the stellar mass of the simulated galaxies within . This shows the correlations between angular momentum, ellipticity and stellar mass for the simulated galaxies: more massive galaxies rotate more slowly on average (have smaller ) and they are rounder, while the specific angular momenta for the less massive galaxies are spread over a wider range, in broad agreement with Fig. 11 in Emsellem et al. (2011) and Fig. 16 in Coccato et al. (2009).
6 Conclusions and discussion
In this work, we presented the first detailed analysis of the inner and outer dynamics of a large sample of simulated galaxies, studying the mass distributions, outer kinematics, and angular momentum distributions of 42 resimulated galaxies from the high-resolution cosmological re-simulations of Oser et al. (2010). Here we summarize and discuss our main results.
1. The stellar components of the model galaxies have approximately power-law density profiles well fitted by cored Sérsic profiles with large , falling somewhat less steeply towards large radii than ETGs (e.g., Kormendy et al., 2009).
2. Due to the interaction between dark matter and baryons during the assembly processes, the dark matter density profiles of the model galaxies deviate from the NFW-like profiles characteristic for dark matter only models in the inner few 10’s of kpc (Navarro et al., 1996, 2010). The DM density slopes and the slopes of the DM CVCs for agree with power laws and vary systematically with mass, such that the DM CVC is approximately flat () for less massive systems and slightly rising () for high mass galaxies.
3. The corresponding total CVCs are slightly falling () for the less massive systems and approximately flat () for the more massive model galaxies. This agrees with mass determinations for local galaxies (see Introduction).
4. The dark matter fractions within the projected stellar half mass radius are in the range - and increase to - at . Larger and more massive galaxies have higher dark matter fractions. The fractions and trends with mass and size are in agreement with observational estimates.
5. The short axes of the simulated galaxies and their host dark matter haloes are well aligned within througout the radial range probed (-), and their shapes are correlated. Long and intermediate axes are either aligned or misaligned by , i.e., switch their order, within slightly larger () scatter.
6. We computed mean velocity , velocity dispersion , and local fields out to for the simulated galaxies and illustrated their kinematic diversity. We temporally smoothed these velocity fields in order to suppress particle noise and fluctuations from small satellites and illustrated the necessity and effect of this in some detail. The simulated galaxy sample contains both purely dispersion-supported systems with no or little rotation, and objects that show disk-like rotation at a level of . We also showed a rarer case with a disk-like structure at . The observed outer velocity fields of galaxies from PNe show a similar kinematic diversity.
7. Radial profiles of root mean square velocity are slowly declining, independent of whether the simulated galaxies are fast or slow rotators, and similar for edge-on and face-on projections. These profiles resemble the majority group of outer profiles determined in nearby ETGs from PNe velocities by Coccato et al. (2009); however, there are no analogues in the simulated galaxies for the rapidly falling profiles seen in the observed sample. This could mean that these objects form through a channel different from the simulated galaxies studied here, or it could be related to the difficulty of modelling disk galaxies in the cosmological simulations; this issue requires further study.
8. We determined cumulative and local angular momentum parameter profiles for the stellar components of all simulated galaxies from the time averaged velocity fields. For most simulated galaxies, the edge-on -profiles are flat or slighty rising within . Most fast rotators rotate fast at both small and large radii, but some have decreasing rotation at large radii. Lower mass slow rotators have mildly increasing with , whereas high-mass slow rotators have flat -profiles. Overall, increases with ellipticity, but with much scatter. These properties appear to broadly agree with those of observed ETGs.
9. Simulated galaxies with a large fraction of accreted stars are generally radially anisotropic. Only systems with a high fraction of in-situ stars show tangential anisotropy. These trends are due to the fact that in the simulation the accreted stars are tidally dissolved from merging satellites on preferentially radial orbits. We also find that massive galaxies and slow rotators amongst the simulated galaxies are mostly radially anisotropic, while the fast rotators have both radial and tangential anisotropy profiles.
7 Acknowledgments
This project was mostly carried out while XW was as a postdoc in the dynamics group at MPE. During the final stages she acknowledges an Alexander von Humboldt fellowship at AIfA at Bonn University. We thank F. de Lorenzi, P. Das, and L. Morganti for their work and help with the NMAGIC code, and the anonymous referee for comments which helped to improve the paper.
| Model | |||||
|---|---|---|---|---|---|
| M0094 | 3.86 | 0.39 | 0.39 | 0.17 | 0.80 |
| M0125 | 4.81 | 0.32 | 0.28 | 0.06 | 1.29 |
| M0175 | 4.28 | 0.36 | 0.30 | 0.05 | 6.61 |
| M0190 | 4.07 | 0.61 | 0.52 | 0.06 | 2.86 |
| M0204 | 3.72 | 0.28 | 0.24 | 0.09 | 2.50 |
| M0209 | 2.48 | 0.42 | 0.38 | 0.21 | 1.18 |
| M0215 | 3.16 | 0.31 | 0.25 | 0.16 | 1.04 |
| M0224 | 3.22 | 0.38 | 0.22 | 0.16 | 1.10 |
| M0227 | 4.53 | 0.37 | 0.28 | 0.27 | 1.42 |
| M0259 | 3.05 | 0.48 | 0.33 | 0.31 | 0.82 |
| M0290 | 2.17 | 0.40 | 0.35 | 0.40 | 0.57 |
| M0300 | 3.06 | 0.55 | 0.46 | 0.29 | 1.28 |
| M0329 | 2.96 | 0.37 | 0.32 | 0.07 | 1.24 |
| M0380 | 2.82 | 0.56 | 0.33 | 0.20 | 0.96 |
| M0408 | 2.59 | 0.49 | 0.46 | 0.38 | 0.63 |
| M0443 | 1.94 | 0.42 | 0.28 | 0.15 | 0.80 |
| M0549 | 3.39 | 0.44 | 0.23 | 0.17 | 0.98 |
| M0616 | 3.00 | 0.41 | 0.38 | 0.09 | 5.75 |
| M0664 | 2.16 | 0.36 | 0.24 | 0.11 | 3.25 |
| M0721 | 2.02 | 0.69 | 0.50 | 0.29 | 1.93 |
| M0763 | 3.32 | 0.41 | 0.41 | 0.44 | 1.05 |
| M0858 | 2.08 | 0.80 | 0.53 | 0.17 | 0.24 |
| M0908 | 2.09 | 0.61 | 0.45 | 0.31 | 0.44 |
| M0948 | 3.69 | 0.22 | 0.26 | 0.08 | 4.25 |
| M0959 | 2.29 | 0.29 | 0.35 | 0.12 | 5.11 |
| M1017 | 1.70 | 0.49 | 0.43 | 0.14 | 1.63 |
| M1061 | 2.55 | 0.51 | 0.49 | 0.26 | 8.60 |
| M1071 | 1.85 | 0.25 | 0.25 | 0.16 | 1.63 |
| M1091 | 1.58 | 0.50 | 0.47 | 0.12 | 9.13 |
| M1167 | 1.87 | 0.53 | 0.46 | 0.18 | 1.95 |
| M1192 | 2.29 | 0.59 | 0.44 | 0.16 | 0.88 |
| M1196 | 2.28 | 0.62 | 0.55 | 0.52 | 1.07 |
| M1306 | 1.47 | 0.65 | 0.43 | 0.28 | 0.51 |
| M1646 | 1.95 | 0.78 | 0.54 | 0.16 | 4.47 |
| M1859 | 1.60 | 0.42 | 0.38 | 0.22 | 5.14 |
| M2283 | 1.43 | 0.64 | 0.53 | 0.19 | 6.77 |
| M2665 | 1.57 | 0.37 | 0.31 | 0.16 | 3.16 |
| M3431 | 0.98 | 0.36 | 0.33 | 0.16 | 4.95 |
| M3852 | 1.49 | 0.56 | 0.51 | 0.63 | 0.97 |
| M4323 | 1.35 | 0.43 | 0.41 | 0.23 | 2.26 |
| M5014 | 1.33 | 0.62 | 0.56 | 0.53 | 1.71 |
| M6782 | 1.30 | 0.71 | 0.64 | 0.57 | 3.63 |
| Model | Mass* | Slope of | Slope of | a | RMS | ||||
|---|---|---|---|---|---|---|---|---|---|
| () | |||||||||
| M0094 | 34.49 | 388.80 | 0.02 | 294.32 | 0.24 | 296.00 | 0.20 | 1.31 | 1.55 |
| M0125 | 31.22 | 375.83 | 0.03 | 298.30 | 0.23 | 297.60 | 0.19 | 1.42 | 1.57 |
| M0175 | 26.49 | 372.44 | -0.03 | 299.45 | 0.14 | 296.18 | 0.16 | 1.45 | 3.71 |
| M0190 | 22.67 | 320.43 | -0.08 | 241.16 | 0.09 | 243.62 | 0.13 | 0.92 | 1.94 |
| M0204 | 19.34 | 303.63 | 0.03 | 229.31 | 0.27 | 230.79 | 0.22 | 0.79 | 2.08 |
| M0209 | 14.37 | 309.16 | -0.09 | 232.47 | 0.13 | 236.07 | 0.06 | 1.75 | 1.64 |
| M0215 | 19.90 | 337.30 | 0.01 | 259.32 | 0.22 | 261.00 | 0.14 | 1.33 | 1.61 |
| M0224 | 17.89 | 304.75 | 0.02 | 227.35 | 0.23 | 230.15 | 0.14 | 0.68 | 2.94 |
| M0227 | 22.23 | 317.13 | 0.00 | 244.73 | 0.18 | 247.19 | 0.18 | 0.94 | 2.04 |
| M0259 | 14.28 | 297.33 | -0.06 | 227.16 | 0.13 | 226.97 | 0.12 | 1.25 | 1.58 |
| M0290 | 15.87 | 319.75 | -0.10 | 225.31 | 0.12 | 229.24 | 0.11 | 1.20 | 1.96 |
| M0300 | 13.43 | 277.36 | -0.10 | 204.18 | 0.11 | 207.10 | 0.09 | 0.98 | 1.69 |
| M0329 | 15.36 | 309.59 | -0.05 | 235.69 | 0.18 | 237.27 | 0.11 | 1.55 | 0.82 |
| M0380 | 12.29 | 309.77 | -0.06 | 249.41 | 0.10 | 248.51 | 0.09 | 1.46 | 2.51 |
| M0408 | 12.75 | 297.20 | -0.13 | 217.43 | 0.06 | 219.60 | 0.06 | 1.15 | 2.00 |
| M0443 | 16.62 | 345.03 | -0.09 | 235.38 | 0.20 | 237.56 | 0.09 | 1.13 | 1.24 |
| M0549 | 8.38 | 237.34 | 0.04 | 190.32 | 0.19 | 189.23 | 0.13 | 0.77 | 2.06 |
| M0616 | 9.38 | 259.79 | -0.09 | 203.62 | 0.09 | 206.24 | 0.11 | 0.92 | 2.38 |
| M0664 | 7.48 | 246.16 | -0.09 | 184.48 | 0.14 | 187.15 | 0.07 | 0.98 | 2.99 |
| M0721 | 9.63 | 276.12 | -0.24 | 193.45 | -0.05 | 198.68 | -0.02 | 1.55 | 2.76 |
| M0763 | 9.85 | 238.93 | -0.09 | 179.72 | 0.04 | 183.14 | 0.01 | 1.29 | 3.73 |
| M0858 | 10.27 | 264.88 | -0.23 | 171.90 | 0.02 | 176.39 | -0.01 | 1.46 | 2.42 |
| M0908 | 9.67 | 264.42 | -0.21 | 176.03 | 0.02 | 178.18 | 0.01 | 1.21 | 1.44 |
| M0948 | 6.64 | 237.28 | -0.02 | 198.55 | 0.11 | 197.98 | 0.10 | 1.41 | 2.31 |
| M0959 | 6.05 | 222.72 | -0.06 | 167.71 | 0.15 | 171.47 | 0.02 | 1.52 | 2.95 |
| M1017 | 6.39 | 254.50 | -0.18 | 182.86 | -0.01 | 185.65 | 0.01 | 1.14 | 0.97 |
| M1061 | 5.18 | 206.25 | -0.15 | 157.89 | 0.02 | 159.55 | 0.04 | 1.24 | 1.01 |
| M1071 | 7.79 | 240.60 | -0.17 | 157.46 | 0.06 | 159.63 | 0.07 | 0.91 | 1.88 |
| M1091 | 7.53 | 243.13 | -0.21 | 152.81 | 0.01 | 155.36 | -0.02 | 1.03 | 1.10 |
| M1167 | 7.37 | 249.04 | -0.17 | 172.20 | 0.06 | 173.63 | 0.04 | 1.12 | 1.09 |
| M1192 | 4.36 | 189.01 | -0.07 | 141.12 | 0.12 | 144.20 | 0.06 | 1.05 | 3.17 |
| M1196 | 7.73 | 257.84 | -0.19 | 188.89 | -0.01 | 189.65 | 0.00 | 1.46 | 1.50 |
| M1306 | 6.51 | 245.04 | -0.21 | 156.97 | 0.01 | 160.81 | 0.01 | 1.09 | 2.18 |
| M1646 | 5.38 | 224.42 | -0.20 | 161.42 | 0.01 | 164.57 | -0.02 | 1.30 | 1.57 |
| M1859 | 4.51 | 211.94 | -0.13 | 149.00 | 0.08 | 152.64 | 0.01 | 1.02 | 1.70 |
| M2283 | 3.39 | 187.63 | -0.17 | 126.38 | 0.05 | 128.99 | -0.05 | 1.23 | 1.92 |
| M2665 | 3.17 | 185.07 | -0.22 | 131.70 | -0.03 | 135.47 | -0.02 | 1.33 | 1.97 |
| M3431 | 1.87 | 175.82 | -0.25 | 119.96 | -0.02 | 125.09 | -0.10 | 1.34 | 1.86 |
| M3852 | 2.64 | 173.24 | -0.23 | 123.50 | -0.09 | 127.22 | -0.15 | 1.42 | 1.60 |
| M4323 | 2.38 | 169.72 | -0.27 | 114.39 | -0.09 | 116.01 | -0.08 | 1.05 | 1.09 |
| M5014 | 2.26 | 163.71 | -0.30 | 109.18 | -0.12 | 116.20 | -0.15 | 1.73 | 3.77 |
| M6782 | 1.95 | 158.66 | -0.28 | 112.41 | -0.10 | 116.33 | -0.16 | 1.42 | 1.60 |
References
- Abadi et al. (2006) Abadi M. G., Navarro J. F., Steinmetz M., 2006, MNRAS, 365, 747
- Allgood et al. (2006) Allgood B., Flores R. A., Primack J. R., Kravtsov A. V., Wechsler R. H., Faltenbacher A., Bullock J. S., 2006, MNRAS, 367, 1781
- Auger et al. (2010) Auger M. W., Treu T., Bolton A. S., Gavazzi R., Koopmans L. V. E., Marshall P. J., Moustakas L. A., Burles S., 2010, ApJ, 724, 511
- Bailin et al. (2005) Bailin J., Kawata D., Gibson B. K., Steinmetz M., Navarro J. F., Brook C. B., Gill S. P. D., Ibata R. A., Knebe A., Lewis G. F., Okamoto T., 2005, ApJ, 627, L17
- Barnabè et al. (2011) Barnabè M., Czoske O., Koopmans L. V. E., Treu T., Bolton A. S., 2011, MNRAS, 415, 2215
- Behroozi et al. (2010) Behroozi P. S., Conroy C., Wechsler R. H., 2010, ApJ, 717, 379
- Bender et al. (1994) Bender R., Saglia R. P., Gerhard O. E., 1994, MNRAS, 269, 785
- Bender et al. (1989) Bender R., Surma P., Doebereiner S., Moellenhoff C., Madejsky R., 1989, A&A, 217, 35
- Bernardi et al. (2003) Bernardi M., Sheth R. K., Annis J., Burles S., Finkbeiner D. P., Lupton R. H., Schlegel D. J., SubbaRao M., Bahcall N. A., Blakeslee J. P., Brinkmann J., Castander F. J., Connolly A. J., et al. 2003, AJ, 125, 1882
- Bett et al. (2010) Bett P., Eke V., Frenk C. S., Jenkins A., Okamoto T., 2010, MNRAS, 404, 1137
- Brook et al. (2012) Brook C. B., Stinson G., Gibson B. K., Roškar R., Wadsley J., Quinn T., 2012, MNRAS, 419, 771
- Capaccioli (1989) Capaccioli M., 1989, in H. G. Corwin Jr. & L. Bottinelli ed., World of Galaxies (Le Monde des Galaxies) Photometry of early-type galaxies and the R exp 1/4 law. pp 208–227
- Cappellari et al. (2006) Cappellari M., Bacon R., Bureau M., Damen M. C., Davies R. L., de Zeeuw P. T., Emsellem E., Falcón-Barroso J., Krajnović D., Kuntschner H., McDermid R. M., Peletier R. F., Sarzi M., van den Bosch R. C. E., van de Ven G., 2006, MNRAS, 366, 1126
- Cappellari et al. (2007) Cappellari M., Emsellem E., Bacon R., Bureau M., Davies R. L., de Zeeuw P. T., Falcón-Barroso J., Krajnović D., Kuntschner H., McDermid R. M., Peletier R. F., Sarzi M., van den Bosch R. C. E., van de Ven G., 2007, MNRAS, 379, 418
- Cassata et al. (2011) Cassata P., Giavalisco M., Guo Y., Renzini A., Ferguson H., Koekemoer A. M., Salimbeni S., Scarlata C., Grogin N. A., Conselice C. J., Dahlen T., Lotz J. M., Dickinson M., Lin L., 2011, ApJ, 743, 96
- Churazov et al. (2008) Churazov E., Forman W., Vikhlinin A., Tremaine S., Gerhard O., Jones C., 2008, MNRAS, 388, 1062
- Churazov et al. (2010) Churazov E., Tremaine S., Forman W., Gerhard O., Das P., Vikhlinin A., Jones C., Böhringer H., Gebhardt K., 2010, MNRAS, 404, 1165
- Coccato et al. (2013) Coccato L., Arnaboldi M., Gerhard O., 2013, MNRAS
- Coccato et al. (2009) Coccato L., Gerhard O., Arnaboldi M., Das P., Douglas N. G., Kuijken K., Merrifield M. R., Napolitano N. R., Noordermeer E., Romanowsky A. J., Capaccioli M., Cortesi A., de Lorenzi F., Freeman K. C., 2009, MNRAS, 394, 1249
- Croton et al. (2006) Croton D. J., Springel V., White S. D. M., De Lucia G., Frenk C. S., Gao L., Jenkins A., Kauffmann G., Navarro J. F., Yoshida N., 2006, MNRAS, 365, 11
- Daddi et al. (2005) Daddi E., Renzini A., Pirzkal N., Cimatti A., Malhotra S., Stiavelli M., Xu C., Pasquali A., Rhoads J. E., Brusa M., di Serego Alighieri S., Ferguson H. C., Koekemoer A. M., Moustakas L. A., Panagia N., Windhorst R. A., 2005, ApJ, 626, 680
- Dalla Vecchia & Schaye (2012) Dalla Vecchia C., Schaye J., 2012, ArXiv e-prints
- de Lorenzi et al. (2007) de Lorenzi F., Debattista V. P., Gerhard O., Sambhus N., 2007, MNRAS, 376, 71
- de Lorenzi et al. (2009) de Lorenzi F., Gerhard O., Coccato L., Arnaboldi M., Capaccioli M., Douglas N. G., Freeman K. C., Kuijken K., Merrifield M. R., Napolitano N. R., Noordermeer E., Romanowsky A. J., Debattista V. P., 2009, MNRAS, 395, 76
- de Lorenzi et al. (2008) de Lorenzi F., Gerhard O., Saglia R. P., Sambhus N., Debattista V. P., Pannella M., Méndez R. H., 2008, MNRAS, 385, 1729
- Deason et al. (2012) Deason A. J., Belokurov V., Evans N. W., McCarthy I. G., 2012, ApJ, 748, 2
- Dekel & Silk (1986) Dekel A., Silk J., 1986, ApJ, 303, 39
- Dekel et al. (2005) Dekel A., Stoehr F., Mamon G. A., Cox T. J., Novak G. S., Primack J. R., 2005, Nature, 437, 707
- Di Matteo et al. (2008) Di Matteo T., Colberg J., Springel V., Hernquist L., Sijacki D., 2008, ApJ, 676, 33
- Duc et al. (2011) Duc P.-A., Cuillandre J.-C., Serra P., Michel-Dansac L., Ferriere E., Alatalo K., Blitz L., Bois M., Bournaud F., Bureau M., Cappellari M., Davies R. L., et al. 2011, MNRAS, 417, 863
- Emsellem et al. (2011) Emsellem E., Cappellari M., Krajnović D., Alatalo K., Blitz L., Bois M., Bournaud F., Bureau M., et al. 2011, MNRAS, 414, 888
- Emsellem et al. (2007) Emsellem E., Cappellari M., Krajnović D., van de Ven G., Bacon R., Bureau M., Davies R. L., de Zeeuw P. T., Falcón-Barroso J., Kuntschner H., McDermid R., Peletier R. F., Sarzi M., 2007, MNRAS, 379, 401
- Feldmann et al. (2010) Feldmann R., Carollo C. M., Mayer L., Renzini A., Lake G., Quinn T., Stinson G. S., Yepes G., 2010, ApJ, 709, 218
- Fontana et al. (2006) Fontana A., Salimbeni S., Grazian A., Giallongo E., Pentericci L., Nonino M., Fontanot F., Menci N., Monaco P., Cristiani S., Vanzella E., de Santis C., Gallozzi S., 2006, A&A, 459, 745
- Gerhard et al. (2001) Gerhard O., Kronawitter A., Saglia R. P., Bender R., 2001, AJ, 121, 1936
- Governato et al. (2010) Governato F., Brook C., Mayer L., Brooks A., Rhee G., Wadsley J., Jonsson P., Willman B., Stinson G., Quinn T., Madau P., 2010, Nature, 463, 203
- Graham et al. (2003) Graham A. W., Erwin P., Trujillo I., Asensio Ramos A., 2003, AJ, 125, 2951
- Guedes et al. (2011) Guedes J., Callegari S., Madau P., Mayer L., 2011, ApJ, 742, 76
- Guo et al. (2010) Guo Q., White S., Li C., Boylan-Kolchin M., 2010, MNRAS, 404, 1111
- Hahn et al. (2010) Hahn O., Teyssier R., Carollo C. M., 2010, MNRAS, 405, 274
- Hilz et al. (2013) Hilz M., Naab T., Ostriker J. P., 2013, MNRAS, 429, 2924
- Hilz et al. (2012) Hilz M., Naab T., Ostriker J. P., Thomas J., Burkert A., Jesseit R., 2012, MNRAS, 425, 3119
- Hoekstra et al. (2004) Hoekstra H., Yee H. K. C., Gladders M. D., 2004, ApJ, 606, 67
- Hopkins et al. (2010) Hopkins P. F., Bundy K., Hernquist L., Wuyts S., Cox T. J., 2010, MNRAS, 401, 1099
- Ilbert et al. (2010) Ilbert O., Salvato M., Le Floc’h E., Aussel H., Capak P., McCracken H. J., Mobasher B., et al 2010, ApJ, 709, 644
- Jesseit et al. (2009) Jesseit R., Cappellari M., Naab T., Emsellem E., Burkert A., 2009, MNRAS, 397, 1202
- Jing & Suto (2002) Jing Y. P., Suto Y., 2002, ApJ, 574, 538
- Johansson et al. (2009) Johansson P. H., Naab T., Ostriker J. P., 2009, ApJ, 697, L38
- Johansson et al. (2012) Johansson P. H., Naab T., Ostriker J. P., 2012, ApJ, 754, 115
- Kazantzidis et al. (2004) Kazantzidis S., Kravtsov A. V., Zentner A. R., Allgood B., Nagai D., Moore B., 2004, ApJ, 611, L73
- Koopmans et al. (2006) Koopmans L. V. E., Treu T., Bolton A. S., Burles S., Moustakas L. A., 2006, ApJ, 649, 599
- Kormendy & Bender (1996) Kormendy J., Bender R., 1996, ApJ, 464, L119+
- Kormendy et al. (2009) Kormendy J., Fisher D. B., Cornell M. E., Bender R., 2009, ApJS, 182, 216
- Krajnović et al. (2011) Krajnović D., Emsellem E., Cappellari M., Alatalo K., Blitz L., Bois M., Bournaud F., Bureau M., et al. 2011, MNRAS, 414, 2923
- Lyskova et al. (2012) Lyskova N., Churazov E., Zhuravleva I., Naab T., Oser L., Gerhard O., Wu X., 2012, MNRAS, 423, 1813
- Mandelbaum et al. (2006) Mandelbaum R., Hirata C. M., Broderick T., Seljak U., Brinkmann J., 2006, MNRAS, 370, 1008
- McCarthy et al. (2010) McCarthy I. G., Schaye J., Ponman T. J., Bower R. G., Booth C. M., Dalla Vecchia C., Crain R. A., Springel V., Theuns T., Wiersma R. P. C., 2010, MNRAS, 406, 822
- McNeil-Moylan et al. (2012) McNeil-Moylan E. K., Freeman K. C., Arnaboldi M., Gerhard O. E., 2012, A&A, 539, A11
- Méndez et al. (2001) Méndez R. H., Riffeser A., Kudritzki R.-P., Matthias M., Freeman K. C., Arnaboldi M., Capaccioli M., Gerhard O. E., 2001, ApJ, 563, 135
- Morganti et al. (2013) Morganti L., Gerhard O., Coccato L., Martinez-Valpuesta I., Arnaboldi M., 2013, MNRAS, 431, 3570
- Moster et al. (2010) Moster B. P., Somerville R. S., Maulbetsch C., van den Bosch F. C., Macciò A. V., Naab T., Oser L., 2010, ApJ, 710, 903
- Murphy et al. (2011) Murphy J. D., Gebhardt K., Adams J. J., 2011, ApJ, 729, 129
- Naab et al. (2009) Naab T., Johansson P. H., Ostriker J. P., 2009, ApJ, 699, L178
- Naab et al. (2007) Naab T., Johansson P. H., Ostriker J. P., Efstathiou G., 2007, ApJ, 658, 710
- Naab et al. (2013) Naab T., Oser L., Emsellem E., Cappellari M., Krajnovic D., McDermid R. M., Alatalo K., et al. 2013, ArXiv e-prints
- Nagino & Matsushita (2009) Nagino R., Matsushita K., 2009, A&A, 501, 157
- Napolitano et al. (2009) Napolitano N. R., Romanowsky A. J., Coccato L., Capaccioli M., Douglas N. G., Noordermeer E., Gerhard O., Arnaboldi M., de Lorenzi F., Kuijken K., Merrifield M. R., O’Sullivan E., Cortesi A., Das P., Freeman K. C., 2009, MNRAS, 393, 329
- Navarro et al. (1996) Navarro J. F., Frenk C. S., White S. D. M., 1996, ApJ, 462, 563
- Navarro et al. (2010) Navarro J. F., Ludlow A., Springel V., Wang J., Vogelsberger M., White S. D. M., Jenkins A., Frenk C. S., Helmi A., 2010, MNRAS, 402, 21
- Novak et al. (2006) Novak G. S., Cox T. J., Primack J. R., Jonsson P., Dekel A., 2006, ApJ, 646, L9
- Oppenheimer & Davé (2008) Oppenheimer B. D., Davé R., 2008, MNRAS, 387, 577
- Oser et al. (2012) Oser L., Naab T., Ostriker J. P., Johansson P. H., 2012, ApJ, 744, 63
- Oser et al. (2010) Oser L., Ostriker J. P., Naab T., Johansson P. H., Burkert A., 2010, ApJ, 725, 2312
- Proctor et al. (2009) Proctor R. N., Forbes D. A., Romanowsky A. J., Brodie J. P., Strader J., Spolaor M., Mendel J. T., Spitler L., 2009, MNRAS, 398, 91
- Romanowsky & Fall (2012) Romanowsky A. J., Fall S. M., 2012, ApJS, 203, 17
- Schuberth et al. (2010) Schuberth Y., Richtler T., Hilker M., Dirsch B., Bassino L. P., Romanowsky A. J., Infante L., 2010, A&A, 513, A52
- Sérsic (1963) Sérsic J. L., 1963, Boletin de la Asociacion Argentina de Astronomia La Plata Argentina, 6, 41
- Strader et al. (2011) Strader J., Romanowsky A. J., Brodie J. P., Spitler L. R., Beasley M. A., Arnold J. A., Tamura N., Sharples R. M., Arimoto N., 2011, ApJS, 197, 33
- Syer & Tremaine (1996) Syer D., Tremaine S., 1996, MNRAS, 282, 223
- Teyssier et al. (2011) Teyssier R., Moore B., Martizzi D., Dubois Y., Mayer L., 2011, MNRAS, 414, 195
- Trujillo et al. (2007) Trujillo I., Conselice C. J., Bundy K., Cooper M. C., Eisenhardt P., Ellis R. S., 2007, MNRAS, 382, 109
- Trujillo et al. (2004) Trujillo I., Erwin P., Asensio Ramos A., Graham A. W., 2004, AJ, 127, 1917
- van Dokkum (2005) van Dokkum P. G., 2005, AJ, 130, 2647
- van Dokkum et al. (2010) van Dokkum P. G., Whitaker K. E., Brammer G., Franx M., Kriek M., et al. 2010, ApJ, 709, 1018
- van Uitert et al. (2012) van Uitert E., Hoekstra H., Schrabback T., Gilbank D. G., Gladders M. D., Yee H. K. C., 2012, ArXiv e-prints
- Weijmans et al. (2009) Weijmans A.-M., Cappellari M., Bacon R., de Zeeuw P. T., Emsellem E., Falcón-Barroso J., Kuntschner H., McDermid R. M., van den Bosch R. C. E., van de Ven G., 2009, MNRAS, 398, 561
- Yang et al. (2012) Yang X., Mo H. J., van den Bosch F. C., Zhang Y., Han J., 2012, ApJ, 752, 41