Substellar-Mass Condensations in Prestellar Cores
Abstract
We present combined Submillimeter-Array (SMA) + single-dish images of the (sub)millimeter dust continuum emission toward two prestellar cores SM1 and B2-N5 in the nearest star cluster forming region, Ophiuchus. Our combined images indicate that SM1 and B2-N5 consist of three and four condensations, respectively, with masses of and sizes of a few hundred AU. The individual condensations have mean densities of cm-3 and the masses are comparable to or larger than the critical Bonner-Ebert mass, indicating that the self-gravity plays an important role in the dynamical evolution of the condensations. The coalescence timescale of these condensations is estimated to be about yr, which is comparable to the local gravitational collapse timescale, suggesting that merging of the condensations, instead of accretion, plays an essential role in the star formation process. These results challenge the standard theory of star formation, where a single, rather featureless prestellar core collapses to form at most a couple of condensations, each of which potentially evolves into a protostar that is surrounded by a rotating disk where planets are created.
Subject headings:
ISM: clouds — ISM: kinematics and dynamics — ISM: structure — stars: formation1. Introduction
According to the standard theory of star formation, stars form out of dense cores embedded in molecular clouds (e.g., Shu et al., 1987; McKee & Ostriker, 2007). The dense cores prior to the protostellar formation, or prestellar cores, are thought to be smooth with no condensations inside (Bacmann et al., 2000). The gravitational collapse of such a core impedes the growth of the local density fluctuations, resulting in the formation of at most a couple of condensations, each of which potentially evolves into a protostar that is surrounded by a rotating disk where planets are created. Recent millimeter and submillimeter observations have revealed that the core mass functions (CMFs) resemble the stellar initial mass function (IMF) (Motte et al., 1998; Stanke et al., 2006; Maruta et al., 2010). The resemblance between the CMFs and IMF appears to claim that these cores are the direct precursors of individual stars or small stellar systems like binaries.
The above scenario of star formation implicitly assumes that the core has a smooth density distribution and does not contain significant condensations. This assumption appears to be supported by recent observations by Schnee et al. (2010, 2012), who suggested that the prestellar cores do not contain significant substructures on the basis of the interferometric observations with arcsecond resolution (see also Olmi et al., 2005). Maury et al. (2010) studied substructures around several Class 0 sources with subarcsecond resolution and found no clear signs of fragmentation at 100 AU. On the other hand, several previous observations revealed the presence of gravitationally-unbound, substellar-mass structures with sizes of a few thousands AU inside prestellar cores in Taurus (Langer et al., 1995; Peng et al., 1998; Takakuwa et al., 2003; Roy et al., 2011). The origins and fates of these small structures inside the prestellar cores remain to be elucidated. These previous studies of substructures in prestellar cores have concentrated primarily on the relatively-isolated environments. Hence, none of the previous observations have clearly answered the question as to whether prestellar cores in cluster-forming regions have significant substructure or not, because of the lack of high spatial resolution observations [see, however, Kamazaki et al. (2001) for the discovery of thousand-AU scale, substellar-mass structures in Oph A]. However, since most stars form in the clustered environments, it is important to elucidate the structures and properties of prestellar cores in the clustered environments.
In the clustered environments, the identified cores tend to be more compact than those in quiescent regions, and their sizes are comparable to a telescope beam size. An area covered by a typical single prestellar core in quiescent regions is often occupied by a small cluster of cores in cluster-forming regions (Motte et al., 1998). To verify whether prestellar cores in the cluster environments contain substantial internal structures or not, we analyze in this Letter two representative prestellar cores (SM1 and B2-N5) in Ophiuchus, the nearest cluster-forming region at a distance of 120 pc, using the dust continuum data obtained by SMA. The SMA data have spatial resolution of a few hundreds AU, one of the finest among the available data of prestellar cores.
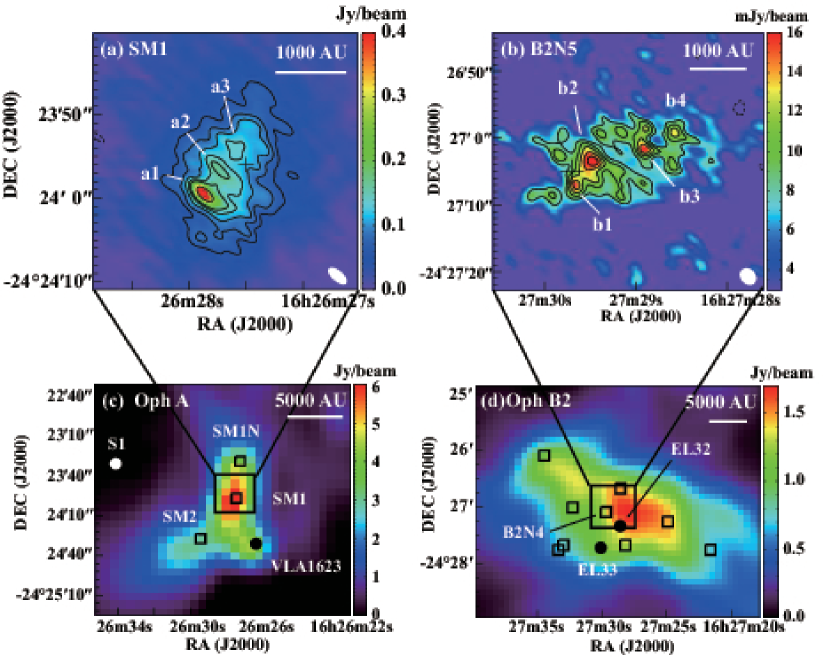
The first target SM1, located in the middle of the Oph A filamentary cloud, has the strongest submillimeter continuum emission in Oph (André et al., 1993). The filamentary morphology is suggestive of interaction with a nearby young B star S1. The total mass and dust temperature of SM1 are estimated to be 2 and K, respectively (Motte et al., 1998). The second target B2-N5 is located in the Oph B2 cloud that contains a number of prestellar cores. In the Oph B2 cloud, a gigantic outflow has recently been detected (Nakamura et al., 2011). This core was identified in the N2H+ (1-0) emission and is one of the cores having the largest column densities in the Oph B2 cloud. The total mass and temperature are estimated to be about a few tenth (Friesen et al., 2010, N2H+) and K (Friesen et al., 2009, NH3), respectively.
2. Data
2.1. Single-dish Continuum Data
The Oph cluster-forming region consists of several sub-parsec scale clouds with masses of order of , each of which contains several prestellar cores. Our target cores SM1 and B2-N5 are located in the Oph A and B2 clouds, respectively. Here, we briefly describe the dust continuum data toward Oph, taken by the single-dish observations.
The 850 m data of the Oph A cloud taken with the SCUBA were obtained through the archival system of the COMPLETE Survey (Ridge et al., 2006). The FWHM beam size of the JCMT was 14′′ at 850m. The mean rms noise level of the data is 10 mJy beam-1.
The 1.1 mm data of the Oph B2 cloud were obtained with the AzTEC camera (Wilson et al., 2008) on the ASTE telescope (Ezawa et al., 2004). The FWHM beam size of the ASTE was 28′′ at 1.1 mm. The observations were performed in the raster scan mode. Each field was observed several times with azimuth and elevation scans. The separation among scans was adopted to be 117′′, which is a quarter of the AzTEC field of view (FoV 7). The effective beam size of the data was 40′′ after the FRUIT imaging which is an iterative mapping method to recover the spatially-extended component (Liu et al., 2010). The noise level was less than 10 mJy beam-1 in the entire observed area. The details of the data will be presented elsewhere.
In general, it is difficult to completely recover the emission from extended structures with bolometric observations using the ground-based telescopes due to the atmospheric emission. For SCUBA, the emission from the structures larger than is suppressed in removing the atmospheric emission during the data reduction process, making the 850 m map mostly devoid of the extended emission. The AzTEC image also has the same problem for the structures larger than the field of view of . However, this effect is expected not to be severe because the sizes of the cores and the condensations identified below are smaller than and for SCUBA and AzTEC, respectively.
2.2. SMA Data
The target prestellar cores SM1 and B2-N5 were observed in the SMA compact configuration at 870 m and 1.1 mm, respectively. We obtained the continuum data through the SMA data archive. The SMA is a double-sideband instrument (Ho et al., 2004), having a number of spectral windows of the SMA correlator (“chunks”). Each target was observed in a single pointing mode.
Table 1 summarizes the observational parameters. The minimum projected baseline lengths were 11 and 12 (8.2′′ and 7.5′′) at 870 m and 1.1 mm, respectively, and for a Gaussian emission distribution with a FWHM of ( 800 AU), the peak flux recovered is 50% of the peak flux of the Gaussian (Wilner & Welch, 1994). This problem is called the missing flux problem. To recover the missing fluxes from extended structure and obtain more reliable images and physical properties of the structures, we combined the SMA data and the available single-dish data (Takakuwa et al., 2007): i.e., 850 m SCUBA data for SM1 and 1.1 mm AzTEC data for B2-N5. Below, we mainly discuss the combined SMAsingle-dish images.
3. Results
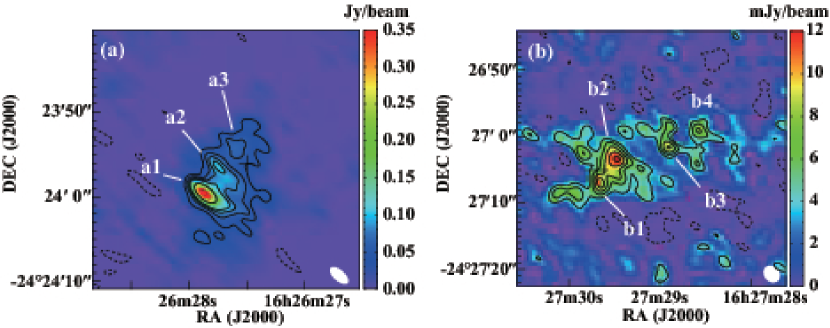
The combined images are presented in Figure 1. For comparison, the original SMA images are also shown in Fig. 2. Our high spatial dynamic range images constructed by combining the single-dish data and SMA data have spatial resolution and sensitivity to dust emission superior to those of existing millimeter and submillimeter observations toward prestellar cores in active cluster-forming regions, without significant effects of the missing flux inherent in any interferometric observations. Both images have clearly revealed the presence of significant substructure inside the prestellar cores. Here, we define a compact AU-scale structure with a peak intensity larger than 10 rms noise level as a condensation. For SM1, we identified three condensations, labeled as a1, a2, and a3 in Fig. 1(a). The southernmost condensation, a1, appears extremely compact, and the internal structure is unresolved even with a few arcsecond resolution. The existence of the thousands AU-scale substructure in the Oph A cloud has been pointed out by the previous interferometric observations (Kamazaki et al., 2001). Our image indicates that the substructure previously identified as the strongest 3mm continuum emission (core A in Figure 2 of Kamazaki et al. (2001)) is much more compact and consists of two condensations a1 and a2. The substructure is more prominent in B2-N5, which contains several small condensations, as shown in Fig. 1(b). Here, we identified 4 condensations in the map. The separations of the condensations are about 510 arcseconds, or AU.
We note that the condensations identified from the combined images can be recognized easily even in the interferometric images alone (Figure 2), and the small-scale structures are essentially the same as those presented in Figure 1. The peak fluxes of all the condensations identified in the SMA images alone are more than 4 rms noise levels, indicating that these condensations are the real structures existing in the prestellar cores.
Table 2 summarizes the physical properties of the identified condensations. We applied two-dimensional Gaussian fitting to the condensations by using the IMFIT task in MIRIAD and derived their sizes, positions, and peak and total fluxes. The masses of the condensations are estimated using the dust opacity of g-1 cm2 with (Hildebrand et al., 1983). This opacity is in agreement with the values adopted by other studies of prestellar cores within a factor of a few (e.g., Ossenkopf & Henning, 1994; Evans et al., 2009; André et al., 1996). The typical masses of the condensations are of the order of . For comparison, the mass of the critical Bonner-Ebert sphere whose mean density coincides with the estimated mean density of each condensation is listed in Table 2. The elongated beam shapes influence the estimation of the local densities and therefore . Since the identified condensations have sizes comparable to the beam sizes, presented in Table 2 may be underestimated. Almost all the condensations have masses comparable to or larger than the critical Bonner-Ebert masses (), indicating that the self-gravity plays an important role in the dynamical evolution of the condensations.
We note that the masses estimated from the continuum emission depend strongly on the adopted opacity and temperature. These two parameters are generally difficult to measure accurately. The dust opacity has uncertainty at least by a factor of a few. Therefore, the masses of the condensations listed in Table 2 are reduced by a factor of a few when the actual dust opacity is smaller. The adopted temperatures also have uncertainty. Here, K is adopted for SM1, although a larger temperature of 27 K is reported (André et al., 1993). For B2-N5, the dust temperature is assumed to be equal to the kinetic temperature of 15 K, which is determined by the NH3 observations (Friesen et al., 2009). In Oph B2, the protostellar outflow from EL32 (Nakamura et al., 2011) may have directly injected turbulent motions in adjacent dense regions including B2-N5, and may have increased the temperature of B2-N5. However, the N2H+ () hyperfine fitting indicates that the temperature of B2-N5 appears low (Friesen et al., 2009). The NH3 observations may not trace the densest gas in Oph B2, and the adopted temperature may be overestimated in the densest parts. Even if we take into account these uncertainties of the dust opacity and temperature, all the condensations still have masses that are comparable to or larger than , for SM1. For Oph B2, the masses of the condensations may become somewhat smaller than when we take into account the larger dust opacity and smaller temperature. Even in that case, the existence of the large-amplitude fluctuations at this small-scale is surprising because such large-amplitude fluctuations give a significant impact on the structure formation during the gravitational collapse of the parent core (Goodwin et al., 2004).
4. Discussion
The significant substructure inside the prestellar cores implies that the basic unit of star formation in the clustered environments is much smaller than previously considered. In fact, recent theoretical and observational studies suggest that prestellar cores formed in the clustered environments tend not to be self-gravitating, but pressure-confined because of the strong inter-core turbulence (Maruta et al., 2010; Nakamura & Li, 2011).
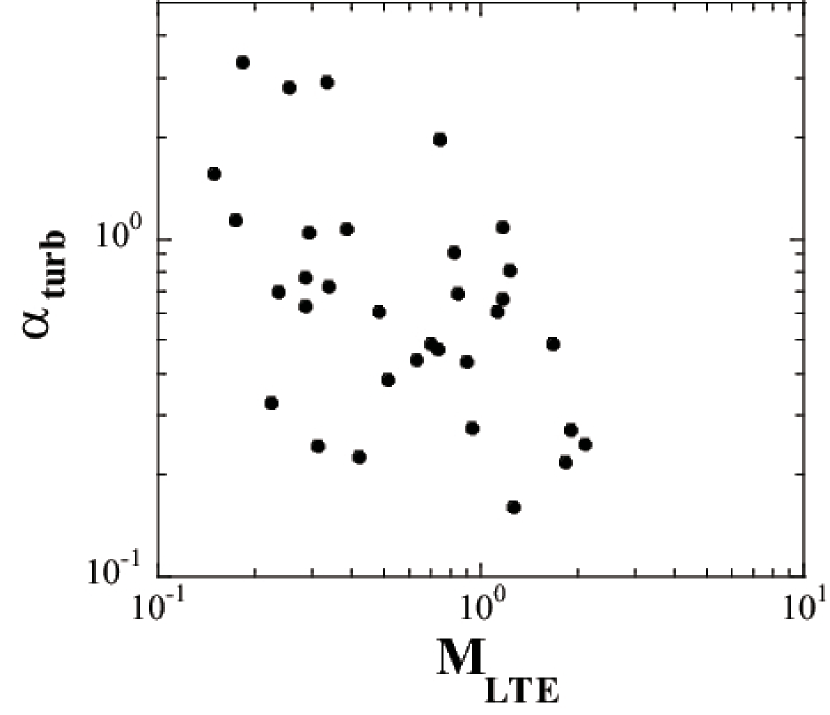
How were these substellar-mass condensations created in parent prestellar cores? One possibility is the fragmentation due to internal turbulent motions, or turbulent fragmentation, in short. In the standard theory of star formation, the cloud turbulence is considered to be less important inside the prestellar cores. However, cluster-forming regions are highly turbulent. Supersonic turbulence potentially triggers the formation of dense regions where the turbulent dissipation preferentially happens (Nakamura & Li, 2011). In such dense regions the large-amplitude fluctuations can be left. To quantify the dynamical importance of the core internal turbulence, we present in Figure 3 the ratios of the turbulent to gravitational energy () for the prestellar cores in Oph as a function of the LTE mass, , where is the turbulent energy , is the gravitational energy , is the three-dimensional nonthermal velocity dispersion, is the gravitational constant, and is the core radius. All the prestellar cores were identified in a high density tracer, H13CO+ (), using the Nobeyama 45m telescope whose beam size is about 2000 AU (Maruta et al., 2010). The mean value of is estimated to be about 0.8, suggesting that the internal turbulence can contribute significantly to the core dynamics. This is in contrast to the cores of quiescent regions like Taurus (Goodwin et al., 2004), where tends to be smaller. In addition, the values of are significantly larger than the threshold for turbulent fragmentation of (Goodwin et al., 2004). Thus, the turbulent motions are responsible for the formation of the condensations inside the prestellar cores in Oph.
H13CO+ sometimes suffers from the molecular depletion in the dense parts of the prestellar cores. Since Maruta et al. (2010) adopted a constant H13CO+ fractional abundance, the estimated core masses (and thus ) may be underestimated (overestimated) if H13CO+ is significantly depleted. However, the depletion effect is expected to be minor as discussed in §4.3 of Maruta et al. (2010). Therefore, we believe that the estimation of the core masses and is reasonable, and our conclusion is not altered by the effects of the molecular depletion.
What is the fate of these substellar-mass condensations? Both the prestellar cores contain condensations with sizes of order AU and masses of a few hundredth . Almost all the condensations have masses comparable to or larger than the critical Bonner-Ebert mass. Therefore, they are expected to be gravitationally bound. From the mean separation between the condensations of a few AU the coalescence timescale of these condensations is estimated to about yr, comparable to the free-fall times of the individual condensations with densities of cm-3, where the relative velocities among condensations are assumed to be equal to the velocity dispersion of B2-N5, km s-1. Therefore, these condensations can either merge with themselves or collapse individually to form small groups of low-mass protostars and/or prot-brown dwarfs. Here, the mean separation projected on the plane of the sky is adopted to calculate the coalescence timescale and therefore the estimated coalescence timescale gives a lower limit. Unless the actual mean separation is larger than the adopted value by a factor of , the coalescence timescale is still comparable to the local free-fall time and thus our conclusion is not altered significantly (see Peng et al. (1998) and Takakuwa et al. (2003) for more quantitative analysis on the separations of condensations.).
According to the standard theory of star formation, a typical prestellar core has sizes of 104 AU and masses of a few 10 and is considered to have no significant substructures. The fragmentation during the prestellar phase is considered to be significantly impeded by the global gravitational collapse before a opaque disk is formed (Hennebelle & Teyssier, 2008; Machida et al., 2008). The prestellar cores could fragment into at most a couple of condensations that grow in mass by accretion and eventually evolve into protostars. Thus, a binary or small multiple system is created. The rotating disks are created around individual protostars and the planets are produced there. However, the recent hydrodynamic simulation of gravitational collapse of a prestellar core has posed a challenge to this standard picture. In a series of three-dimensional radiation hydrodynamic simulations, the protostellar radiation destroys the opaque disks that would evolve into circumstellar disks (Schonke &Tscharnuter, 2011). Although whether the disks are completely destroyed or not may depends on the size of the disk formed, this effect of the protostellar radiation significantly constrains the planet formation from the circumstellar disks. In our scenario, substellar-mass condensations are already formed before the protostars are created. Some of these substellar-mass condensations potentially evolve into giant planets orbiting around protostars or proto-brown dwarfs under the influence of the protostellar radiation that can remove a significant amount of mass from the condensations.
Here, we revealed that the two representative prestellar cores in the Oph cluster forming region contain hundreds AU-scale structures. Another compact structure with 1000 AU was also found toward the southern part of Oph A, Oph A-N6 (Bourke et al., 2012). Very recently, Barsony et al. (2012) discovered a surprising number of brown dwarf candidates in this region. Although the follow-up spectroscopic observations would be needed, they estimated the ratio of the brown dwarfs () to low-mass stars () to be about 1.4, more than 5 times larger than the previous estimation. Our observations may explain the abundance of substellar-mass objects like brown dwarfs in this region. However, it remains unclear whether the small-scale structures are really common in prestellar cores in the clustered environments. Further observations with higher spatial resolution and higher sensitivity will be needed to clarify the internal structures of the prestellar cores. The high-angular resolution interferometric observations such as ALMA will provide us an excellent opportunity to explore the substructures of prestellar cores.
References
- André et al. (1993) André, P., Ward-Thompson, D., & Barsony, M., 1993, A&A, 406, 122
- André et al. (1996) André, P., Ward-Thompson, D., & Motte, F., 1996, A&A, 314, 625
- Bacmann et al. (2000) Bacmann, A., André, P., Puget, J.-L., Abergel, A., Bontemps, S., & Ward-Thompson, D. 2000, A&A, 361, 555
- Barsony et al. (2012) Barsony, M., Haisch Jr., K. E., March, K. A., & McCarthy, C., 2012, ApJ, 751, 22
- Bourke et al. (2012) Bourke, T. L., Myers, P. C., Caselli, P. et al., 2012, ApJ, 745, 117
- Ezawa et al. (2004) Ezawa, H., Kawabe, R., Kohno, K., & Yamamoto, S. 2004, Proc. SPIE, 5489, 763
- Evans et al. (2009) Evans II, N. J., Dunham, M. M., Jorgensen, J. K. et al. 2009, ApJS, 181, 321
- Friesen et al. (2009) Friesen, R. K., Di Francesco, J., Shimajiri, Y., & Takakuwa, S., 2010, ApJ, 708, 1002
- Friesen et al. (2010) Friesen, R. K., Di Francesco, J., Shimajiri, Y., & Takakuwa, S., 2010, ApJ, 708, 1002
- Goodwin et al. (2004) Goodwin, S. P., Whitworth, A. P., & Ward-Thompson, D., 2004, A&A, 414, 633
- Hennebelle & Teyssier (2008) Hennebelle, P. & Teyssier, R., 2008, A&A, 477, 25
- Hildebrand et al. (1983) Hildebrand, R. H., 1983, Q. J. R. Astron. Soc. 24, 267
- Ho et al. (2004) Ho, P. T. P., Moran, J. M., & Lo, K. Y., 2004, ApJ, 616, L1
- Johnstone et al. (2000) Johnstone, D., Wilson, C. D., Moriarty-Schieven, G., et al., 2000, ApJ, 545, 327
- Kamazaki et al. (2001) Kamazaki, T., Saito, M., Hirano, N., & Kawabe, R., 2001, ApJ, 548, 278
- Langer et al. (1995) Langer, W. D., Velusamy, T., Kuiper, T. B. H., Levin, S., Olsen, E., & Migenes, V. 1995, ApJ, 453, 293
- Liu et al. (2010) Liu, G., Calzetti, D., Yun, M. S., et al. 2010, AJ, 139, 1190
- Machida et al. (2008) Machida, M. N., Tomisaka, K., Matsumoto, T., & Inutsuka, S., 2008, ApJ, 677, 327
- Maruta et al. (2010) Maruta, H., Nakamura, F., Nishi, R., Ikeda, N., & Kitamura, Y., 2010, ApJ, 714, 680
- Maury et al. (2010) Maury, A. J., André, P. Hennebelle, P. et al. 2010, A&A, 512, 40
- McKee & Ostriker (2007) McKee, C. F. & Ostriker, E. C., 2007, ARA&A, 45, 565
- Motte et al. (1998) Motte, F., André, P., & Neri, R., 1998, A&A, 336, 150
- Nakamura et al. (2011) Nakamura, F., Kamada, Y., Kamazaki, T., et al., 2011, ApJ, 726, 46
- Nakamura & Li (2011) Nakamura, F. & Li, Z.-Y., 2011, ApJ, 740, 36
- Olmi et al. (2005) Olmi, L., Testi, L., & Sargent, A. I. 2005, A&A, 431, 253
- Ossenkopf & Henning (1994) Ossenkopf, V. & Henning, T. 1994, A&A, 291, 943
- Peng et al. (1998) Peng, R., Langer, W. D., Velusamy, T., Kuiper, T. B. H., & Levin, S. 1998, ApJ, 497, 842
- Ridge et al. (2006) Ridge, N. A., Di Francesco, J., Kirk, H., et al. 2006, AJ, 131, 2921
- Roy et al. (2011) Roy, N., Datta, A., Momjian, E., & Sarma, A. P. 2011, ApJ, 739, L4 AJ, 131, 2921
- Schnee et al. (2010) Schnee, S., Enoch, M., Johnstone, D., et al., 2010, ApJ, 718, 306
- Schnee et al. (2012) Schnee, S., Sadavoy, S., Di Francesco, J. & Johnstone, D., 2012, ApJ, 755, 178
- Schonke &Tscharnuter (2011) Schonke, J. & Tscharnuter, W. M., 2011, A&A, 526, 139
- Shu et al. (1987) Shu, F. H., Adams, F. C., & Lizano, S. 1987, ARA&A, 25, 23
- Stanke et al. (2006) Stanke, T., Smith, M. D., Gredel, R., & Khanzadyan, T., 2006, A&A, 447, 609
- Takakuwa et al. (2003) Takakuwa, S., Kamazaki, T., Saito, M., & Hirano, N. 2003, ApJ, 584, 818
- Takakuwa et al. (2007) Takakuwa, S., Ohashi, N., Bourke, T. L., et al., 2007, ApJ, 662, 431
- Wilner & Welch (1994) Wilner, D. J., & Welch, W. J. 1994, ApJ, 427, 898
- Wilson et al. (2008) Wilson, G. W., Austermann, J. E., Perera, T. A., et al. , 2008, MNRAS, 386, 807
| Parameter | SM1 | B2-N5 |
|---|---|---|
| Observing Date | July 29, 2007 | June 1, 2008 |
| Number of antennas | 7 | 8 |
| R.A. (J2000) | 16:26:27.60 | 16:27:29.15 |
| Decl.(J2000) | -24:23:55.0 | -24:27:02.0 |
| Primary beam HPBW | 36′′ | 45′′ |
| Synthesized beam HPBW | (P.A.=49∘) | (P.A.=40∘) |
| Baseline coverage | 10.9 - 148.2 (k) | 12.1 - 114.2 (k) |
| LO frequency | 341.5 GHz | 274.2 GHz |
| Bandwidth | 4.0 GHz | 3.8 GHz |
| Gain calibrator | NRAO530 | 1625-254 |
| Flux of the gain calibrator | 1.4 Jy | 0.79 Jy |
| Passband calibrator | 3C273, 3C454.3 | 3C279, Jupiter |
| Flux calibrator | Uranus | Titan |
| System temperature | 150 - 600 (K) | 300 - 600 (K) |
| rms noise level | 4.8 mJy/beam | 1.2 mJy/beam |
| Name | R.A. | Dec. | Sp | St | Size | Mass | density | |
|---|---|---|---|---|---|---|---|---|
| (J2000) | (J2000) | (mJy/beam) | (mJy) | (AUAU) | () | ( cm-3) | () | |
| a1 | 16:26:27.8 | -24:24:00 | 455 | 742 | 0.15 | 30.7 | 0.014 | |
| a2 | 16:26:27.7 | -24:23:57 | 176 | 958 | 0.17 | 4.6 | 0.036 | |
| a3 | 16:26:26.6 | -24:23:54 | 138 | 769 | 0.13 | 2.2 | 0.053 | |
| b1 | 16:27:29.6 | -24:27:07 | 15.2 | 44 | 0.033 | 1.4 | 0.03 | |
| b2 | 16:27:29.5 | -24:27:04 | 17.4 | 136 | 0.10 | 0.53 | 0.056 | |
| b3 | 16:27:28.9 | -24:27:02 | 15.8 | 47 | 0.035 | 1.3 | 0.036 | |
| b4 | 16:27:28.6 | -24:26:59 | 13.1 | 49 | 0.036 | 0.79 | 0.046 |
Note. — The physical quantities listed in the table are evaluated from deconvolved Gaussian-fitted model parameters. The core masses are estimated by adopting the dust temperatures of 20 K and 15 K for the prestellar cores, SM1 and B2-N5, respectively. The size is given by the FWHM major and minor axes obtained from the IMFIT Gaussian fitting.